
Glue Level Estimation through Automatic Visual Inspection in PCB
Manufacturing
Bruno P. Iglesias
1
, Mario Otani
2
and Felipe G. Oliveira
1
1
Institute of Exact Sciences and Technology (ICET), Federal University of Amazonas (UFAM),
Itacoatiara, Amazonas, Brazil
2
Cal-Comp, Institute of Research and Technological Innovation (ICCT), Manaus, Amazonas, Brazil
Keywords:
Glue Level Control, Automatic Visual Inspection, Machine Learning.
Abstract:
Nowadays, the increasing use of automatic visual inspection approaches in the manufacturing process is re-
markable. The automation of production lines implies profitability and product quality. Moreover, optimized
human resources result in process optimization and production increase. This work addresses the problem of
optimizing the glue tube replacement in Printed Circuit Boards (PCB) manufacturing, warning a human oper-
ator only just in time to replace the glue tube. We propose an approach to estimate the glue level, in the glue
injection process, during PCB manufacturing. The proposed methodology is composed of three main steps: i)
Pre-Processing; ii) Feature extraction; and iii) Glue level estimation through machine learning. The proposed
predictive model learns the relation between visual features and the glue level in the tube. Real and simulated
experiments were carried out to validate the proposed approach. Results show the obtained Root Mean Square
Error (RMSE) measure of 0.88, using Random Forest regression model. Furthermore, the proposed approach
presents high accuracy even regarding noisy images, resulting in RMSE measures of 3.64 and 4.15 for a Salt
and Pepper and Gaussian noise, respectively. Experiments demonstrate reliability and robustness, optimizing
the manufacturing.
1 INTRODUCTION
In the current economy, manufacturing companies
must be competitive. The mentioned competitiveness
depends on increasing production, providing quality
to the manufacturing processes. In this context, the in-
spection process plays a fundamental role in the qual-
ity of industrial tasks (Rahman et al., 2019).
The automation of visual inspection approaches
has grown consistently in recent decades, with partic-
ularly relevant challenges being posed in different in-
dustrial scenarios and manufacturing processes (Ab-
dul Rahman et al., 2018).
In some well-stated production lines, it is not al-
ways possible to include internal sensors in enclosed
devices, like injection glue tubes. Thereby, automatic
visual inspection approaches are efficient and reason-
able to address the refered problems. Automatic vi-
sual inspection can be applied to: i) waste reduction;
ii) quality of final products improvement; or iii) pro-
cess optimization (Thielen et al., 2020).
In this paper, we present an approach to optimize
the glue tube replacement, during the glue injection
process, in manufacturing of Printed Circuit Board
(PCB). The glue level is estimated from visual fea-
tures, warning the human operator within the appro-
priate time to replace empty glue tubes. We also intro-
duce a liquid level estimation strategy based on Ran-
dom Forest (RF), to obtain a more efficient estimation
of glue levels. Experiments in real-world scenarios
and simulations show that the obtained results are ac-
curate and applicable in industrial scenarios.
Our main contribution is to provide an approach
to estimate the glue level in an autonomous glue in-
jection process. Furthermore, the proposed predictive
model learns the relation between visual features and
the semantic level. Thereby, the human operator is al-
located to glue tube replacement only at the appropri-
ate time, optimizing the human resource during man-
ufacturing of PCB. Figure 1 presents a 3D model of
an experimental setup used for automatic visual in-
spection, regarding a glue injection process in PCB
production line.
The remainder of this paper is structured as fol-
lows. In Section II we present a brief discussion on
related works regarding automatic visual inspection.
Iglesias, B., Otani, M. and Oliveira, F.
Glue Level Estimation through Automatic Visual Inspection in PCB Manufacturing.
DOI: 10.5220/0010540807310738
In Proceedings of the 18th International Conference on Informatics in Control, Automation and Robotics (ICINCO 2021), pages 731-738
ISBN: 978-989-758-522-7
Copyright
c
2021 by SCITEPRESS – Science and Technology Publications, Lda. All rights reserved
731

Figure 1: Three-dimensional model of an experimental
setup used for automatic visual inspection for glue level
control in PCB manufacturing.
The proposed methodology is presented in Section III
and validated by real and simulated experiments dis-
cussed in Section IV. Finally, in Section V we draw
the conclusions and discuss paths for future investi-
gation.
2 RELATED WORKS
Problems related to automatic visual inspection are
of significant importance and have been the subject
of intensive investigation (Zhang et al., 2018) (Rah-
man et al., 2019). For fault detection, the majority of
works perform classification of presence or absence
of faults, in manufacturing processes (Abdul Rahman
et al., 2018) (Vafeiadis et al., 2018).
Many industrial applications are addressed as a
fault detection approach. In (Rocha et al., 2016), a
visual inspection approach is presented to detect ab-
sence/presence of surface mount components (SMC)
on printed circuit boards (PCB). The authors propose
a methodology based on the combination of Machine
Vision and Machine Learning (using Support Vector
Machine (SVM)) to detect component absence, with
more quality and precision, using noisy digital images
acquired directly from PCB industrial production line.
The obtained results demonstrated the robustness of
the methodology, obtaining 97.25% of accuracy.
(Zhou et al., 2017) has proposed a detection ap-
proach for oil-air and oil-water interfaces, from im-
ages of transparent tubes containing water and oil. A
statistical based approach to detect the mentioned in-
terfaces is used. Through real experiments, results
show that the multi-interface detection method has
high precision and reaches the requirements of indus-
trial applications.
In some industrial applications, liquid control is a
paramount task. (Zhang et al., 2018) presents a ma-
chine vision approach for liquid particle inspection in
pharmaceutical injection. The authors proposed an
approach based on particles segmentation, tracking
and classification, to reduce potential defects in injec-
tion process. From the experiments, the proposed in-
spection approach demonstrates effectiveness in real
application, achieving accuracy above 97%.
The authors of (Abdul Rahman et al., 2018) pro-
posed a strategy to classify bottles regarding shape
and level. In shape analysis the bottles are classified
in ”good” or ”defect” classes. Meanwhile, in level
analysis the liquid is classified in ”overfilled”, ”under-
filled” and ”good” classes. For this, a local standard
deviation and Hough transform technique are used,
using a decision tree as a learning model. The experi-
mental results obtained from the developed technique
show an accuracy of 97% for shape and 93% for level
analysis.
In (Saad et al., 2017) is presented a real-time in-
spection approach for beverages product. The pro-
posed system regards color concentration and bottle’s
water level. Quadratic distance technique is applied
for color concentration analysis based on a combina-
tion of Red, Green and Blue (RGB) histogram. The
vertical and horizontal coordinates are used to inspect
three conditions of the level, which are ”overfill”,
”underfill” and ”passed”. The proposed system has
achieved 100% accuracy using 246 samples.
In mounting processes, glue injection and level
control are important steps for efficient manufactur-
ing. In (Vafeiadis et al., 2018) the authors proposed
the inspection of dies attachment on PCB, using ma-
chine learning techniques. For this, an analysis is per-
formed regarding the excess or insufficient glue injec-
tion. For the inspection of PCB, a pixel-based vector
of the regions of interest is used, altogether with a
SVM classifier. The experiments achieved an accu-
racy of 81.39%.
The existing solutions for liquid level control are
based on the classification of the liquid level into
”overfill”, ”underfill” and ”good” classes (Saad et al.,
2017) (Abdul Rahman et al., 2018). The closest ap-
proach, regarding glue control, only inspect the ex-
cess or insufficient level of injected glue on PCB
(Vafeiadis et al., 2018). Thereby, although previous
works on automatic liquid level control approaches
exist, to the best of our knowledge, there is no prior
work tackling specifically the automatic glue level
control in PCB manufacturing problem.
The presented approach is particularly interesting
because it proposes an automatic glue level control
for PCB production. Additionally, it predicts the con-
tinuous level representation during the glue injection
process. In this sense, it is possible to verify the
ICINCO 2021 - 18th International Conference on Informatics in Control, Automation and Robotics
732
Color space
changing
Binarization
Morphological
operation
Pre-Processing
Feature extraction
Contour
extraction
Glue area
estimation
Glue level
prediction
Machine Learning
Image
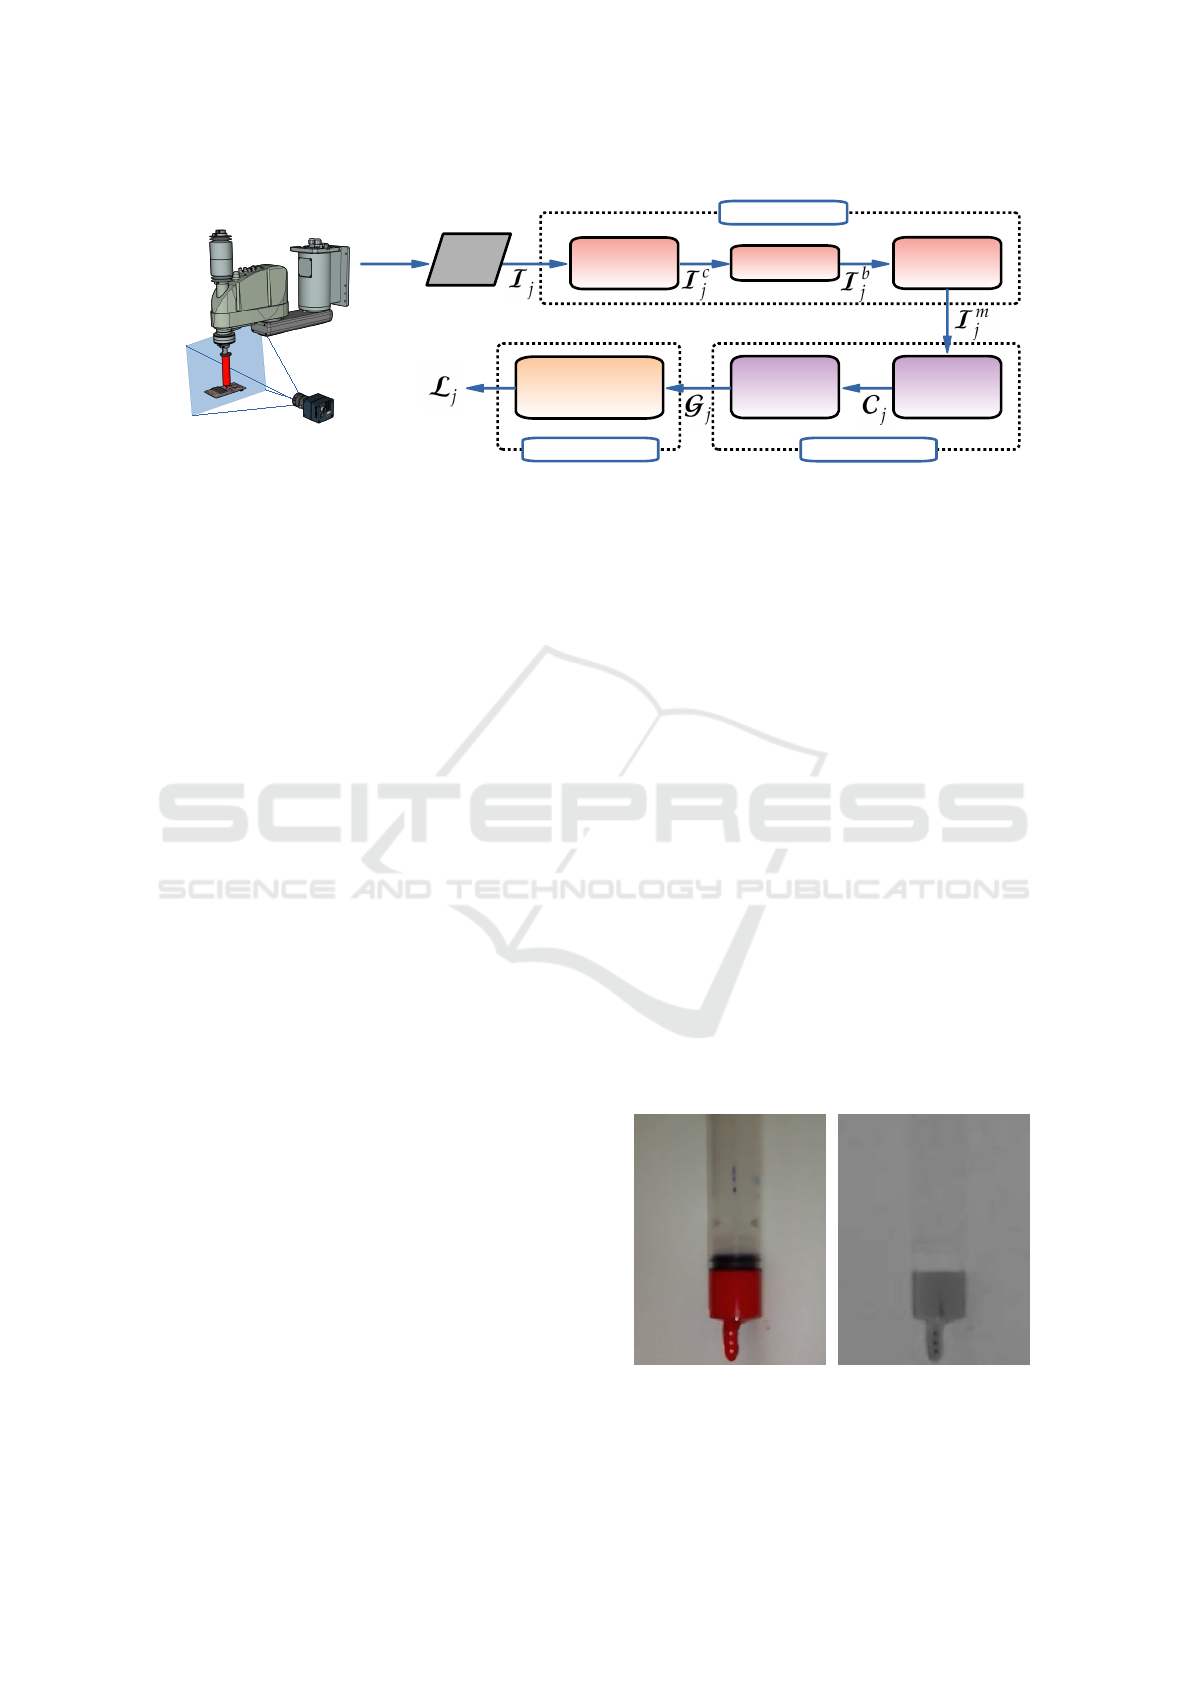
Figure 2: Overview of the proposed approach for automatic visual inspection for glue level control, through the stages: i)
Pre-Processing; ii) Feature extraction; and iii) Glue level prediction through machine learning.
percentage of glue into the tube during the injection
process, warning the human operator, to replace the
empty tube, only in proper time. Moreover, it pro-
vides important information for manufacturing man-
agement.
3 METHODOLOGY
In this paper, we propose an automatic visual in-
spection for glue level control process, based on vi-
sual features and machine learning combining. An
overview of the proposed methodology is shown in
Figure 2, whose details will be presented in the next
subsections.
In Figure 2 we present an overview of the
proposed approach, highlighting the main steps to
achieve the glue level estimation, indicating the cor-
rect time to replace the empty glue tube. To reach
this goal, images are acquired continuously and a pre-
processing stage is performed. Shape based features
are extracted to quantify the glue level into the tube.
Finally, a machine learning technique is applied to
predict the glue level.
Our problem can be summarized as follows:
Problem 1 (automatic visual inspection). Let
~
I
j
=
{
i
1
,i
2
,...,i
n
}
be a series of glue tube images provided
by a camera. Also let
~
L
j
=
{
l
1
,l
2
,...,l
n
}
be a series
of previously known reference glue levels. Our main
goal is to correctly associate an unknown image (
~
I
k
)
to the correspondent glue level (
~
L
k
), representing the
glue level in the tube.
3.1 Pre-processing
3.1.1 Color Space Changing
In applications involving structured environment and
predefined objects and lighting conditions, color in-
formation is used as a feature to represent patterns.
In multi-band images, each layer represents a spec-
trum, corresponding to a complementary information
to multi-band image combining. In this sense, indi-
vidual layers are frequently used to filter patterns in
learning processes.
In this work the images (
~
I ) are initially acquired
in Red, Green and Blue (RGB) color space and after
the images are converted to L*U*V* color space. In
L*U*V* color space images, the colors are based on
Tristimulus value (L) and Chromaticity (U and V) co-
ordinates, where L component has the range [0,100],
U component has the range [-134,220], and V compo-
nent has the range [-140,122] (Remmach et al., 2020).
For glue level estimation, the V component is used, as
monochromatic image (
~
I
c
), due to sensitivity to pat-
terns in glue tube images. In Figure 3 are presented
examples of raw RGB and V component images.
(a) (b)
Figure 3: Color space changing process. Figures 3a and 3b
correspond to RGB and V component images, respectively.
Glue Level Estimation through Automatic Visual Inspection in PCB Manufacturing
733

3.1.2 Binarization
Binarization is a technique used to transform a gray
level image (
~
I
c
) into a binary image (
~
I
b
). Binariza-
tion consists of using a threshold value to separate
pixels into two classes, the background (black pixels)
and foreground (white pixels). The quality of a bina-
rization method relies on finding an efficient threshold
value.
Otsu binarization function is a global method
used to find a threshold value based on maximizing
the interclass variance of background and foreground
(Otsu, 1979) (Gonzalez and Woods, 2017). The Otsu
threshold value (T) is computed as folows:
ω
0
=
N
0
M × N
. (1)
ω
1
=
N
1
M × N
. (2)
N
0
+ N
1
= M × N. (3)
ω
0
+ ω
1
= 1. (4)
µ = µ
0
× ω
0
+ µ
1
× ω
1
. (5)
Where, M and N are the amount of image rows
and columns, respectively. N
0
and N
1
are the amount
of pixels that are greater than and less than the thresh-
old (T ), respectively. ω
0
and ω
1
are the proportion of
pixels. µ
0
and µ
1
are the average gray values of pix-
els in background and foreground. µ is the average
gray value of all pixels. A simplified equation for the
interclass variance (g) is given by:
g = ω
0
× ω
0
× (µ
1
− µ
0
)
2
. (6)
Thereby, to find the threshold value which maxi-
mizes the interclass variance between background and
foreground, all gray values must be evaluated. The in-
terclass variance assessment is performed as follows:
T
max
= arg(max(g(T ))). (7)
Otsu binarization method is used in this work be-
cause it can efficiently separate background and fore-
ground in structured environments with predefined
objects. Moreover, Otsu method can reduce noise
very well.
3.1.3 Morphological Operation
Morphological operations are nonlinear functions that
process images based on shape and are especially
suited to the processing of binary images. Morpho-
logical image processing removes imperfections tak-
ing into account the form and structure of the image.
Morphological operations probe an image with a
matrix called structuring element. For this, the struc-
turing element is positioned in all locations in the
image, being compared with the current position al-
together within its neighborhood. Many image pro-
cessing functions are based on the mentioned strategy,
such as: i) erosion; ii) dilation; iii) opening; and iv)
closing.
Erosion () shrinks an image by stripping away a
layer of pixels from both the inner and outer bound-
aries of regions. Dilation (⊕) adds a layer of pixels to
both the inner and outer boundaries of regions. Open-
ing (#) opens up a gap between objects connected
by a thin bridge of pixels. Moreover, any regions that
have survived the erosion are restored to their original
size by the dilation. Closing ( ) fills holes in the re-
gions while keeping the initial region sizes (Gonzalez
and Woods, 2017).
In this work, we use the opening morphological
operation due to removing small regions and small
connections, as can be observed in Figure 4. Further-
more, the glue tube size is preserved during image
processing. Additionally, a rectangular structuring el-
ement is used, with a size of 5 ×5. The opening func-
tion is represented as follows:
A # B = (A B) ⊕ B. (8)
Figure 4: Glue tube image after Otsu binarization and open-
ing morphological operation stages.
3.2 Feature Extraction
3.2.1 Contour Extraction
Contour corresponds to a line connecting all the
points along a boundary, representing an object’s
shape. The technique used in this work to extract
the contour from binary images performs the border
following for topological analysis. The referred tech-
nique is used due to its efficiency in shape representa-
tion.
ICINCO 2021 - 18th International Conference on Informatics in Control, Automation and Robotics
734

In the mentioned technique, first, a pixel that satis-
fies the border conditions is defined as a starting point.
After, into an auxiliary structure, i) a uniquely iden-
tifiable number is assigned to the starting point, ii) a
sequential number of the border is also assigned to
the newly found border, and iii) the parent border is
assigned to the newly found border. A new pixel is as-
sessed, and if the border conditions are satisfied, the
new pixel is added to the auxiliary structure as a new
border component. In the end, only the binary image
contour remains in the output image (
~
C ), represent-
ing the shape of objects (Suzuki and be, 1985). Figure
5 presents the glue contour, extracted from raw glue
tube image, representing a shape feature.
Figure 5: Glue contour extracted from glue tube image.
3.2.2 Glue Area Estimation
After the image pre-processing stage, filtering the
most relevant features and reducing noise, and after
contour extraction stage, filtering only the remaining
glue within the tube, in the current stage the glue area
on image is quantified.
Regarding the rectangular glue shape, verified in
frontal image of the glue tube, we compute the rectan-
gle which completely covers the glue with minimum
area, representing the glue area on image. In this way,
it is possible to compute the rectangle area (
~
G ), from
obtained width and height, as follows:
~
G = width × height. (9)
Thereby, from an image acquired from a glue tube
in injection process it is possible to estimate the visual
glue area to predict the glue level in unknown scenar-
ios. The estimated glue area corresponds to the shape
feature representation used in learning process.
3.3 Glue Level Prediction
The glue level prediction in this work is performed us-
ing the Random Forest supervised learning algorithm.
Random forest is a bagging technique, where the trees
in random forest are run in parallel. It operates by
constructing a set of decision trees at training time
and outputting the class that is the mode of the classes
(classification) or mean prediction (regression) of the
individual trees (Breiman, 2001).
In the Random Forest algorithm, features are ran-
domly selected to build several uncorrelated decision
trees. The referred randomness implies in data rep-
resentation diversity and overfitting reduction, in the
training process. Additionally, the Random Forest
technique selects the features that contribute the most
to the learning process and discards those that do not.
Thus, it is possible to create more discriminative mod-
els for the regression process (Forsyth, 2019).
The prediction of random forest regression is an
average of the predictions produced by the trees in the
forest. Each tree prediction corresponds to a weighted
average of the response values (Y
1
,...,Y
n
), observed
in the original training data. The final random forest
prediction at some observed predictor vector (X
0
) is a
combination of the training response values given by:
ˆ
Y (X
0
) =
n
∑
i=1
w
i
(X
0
)Y
i
, (10)
where w
i
(X
0
),...,w
n
(X
0
) are the non-negative
weights regarding the constraint
∑
n
i=1
w
i
(X
0
) = 1, as
follows:
min
1≤i≤n
Y
i
≤
ˆ
Y (X
0
) ≤ max
1≤i≤n
Y
i
. (11)
Random Forest regression was used in this work
due to robust and efficient results in automatic visual
inspection (Thielen et al., 2020)(Dong et al., 2020).
Additionally, the predictions given by random forests
regression are always within the range of response
values in the training dataset.
4 EXPERIMENTS
In this section we present experimental results
and compare the performance against existing ap-
proaches.
4.1 Experimental Setup
The glue tube is mounted on an Epson SCARA G3-
351S robot, in a PCB production line. Images from
the glue tube were collected using a Basler AcA5472-
17uc camera, mounted with a Lens TS1614 F1.4
f16mm. A Dell laptop with an Intel
R
Core
T M
i7-
8550U CPU and 16 GiB DDR3-2133 main memory
is used to execute the proposed approach (Figure 6).
Glue Level Estimation through Automatic Visual Inspection in PCB Manufacturing
735
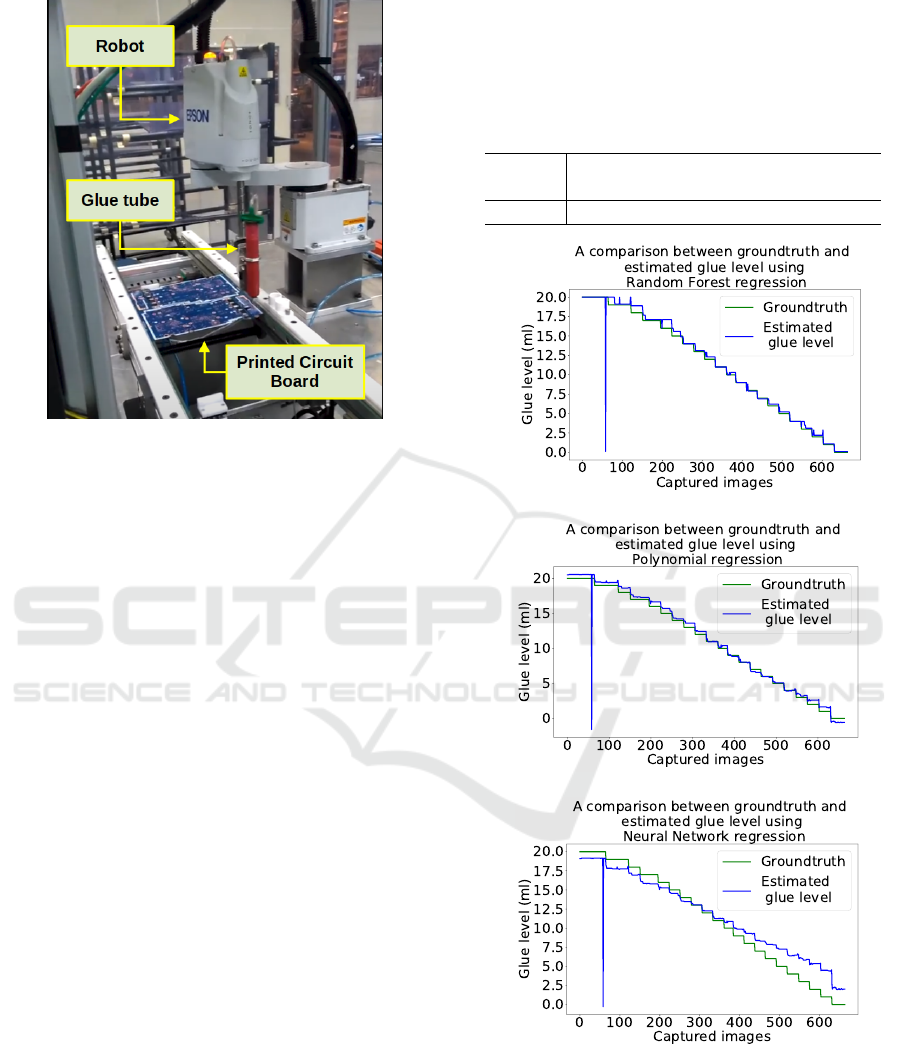
Figure 6: Experimental setup used for automatic visual in-
spection for glue level control in PCB manufacturing.
4.2 Glue Level Prediction Assessment
This experiment evaluates the accuracy of the pro-
posed approach for glue level control. Glue tubes
similar to industrial glue tubes were used in these
experiments. Additionally, three different regression
models are evaluated: i) Random Forest (proposed);
ii) Polynomial; and iii) Neural Network. The com-
parison regression models were used due to good
results obtained in automatic liquid analysis (Saad
et al., 2017)(Abdul Rahman et al., 2018) and overall
automatic visual inspection context (Rahman et al.,
2019)(Thielen et al., 2020).
The regression model training is performed from
a set of input images and the testing stage regards an-
other set of input images, different from training im-
age dataset. For the training process, are used 205
images, meanwhile for the testing process, are used
3320 images.
The proposed Random Forest regression model
uses 100 trees in the forest and the minimum number
of samples required to split an internal node equals
2. The used Polynomial regression model is based on
3rd degree polynomial, represented through a cubic
spline. Meanwhile, the Multilayer Perceptron (MLP)
Neural Network regression model uses a hidden layer
of size 15, Adam optimizer and Relu activation func-
tion, for 500 epochs.
To evaluate the prediction’s quality, the RMSE
method is used to quantify how similar the known
glue levels (groundtruth) and the predicted glue lev-
els are. For RMSE analysis, the closer to zero the
result, the more accurate the predictions are. Table 1,
shows the glue level control results. Results show that
the proposed Random Forest regression model out-
performs the other regression models.
Table 1: Results for glue level prediction. This experiment
presents the RMSE for Random Forest (proposed), Polyno-
mial, and Neural Network regression models.
Random
Forest
Polynomial
Neural
Network
RMSE 0.88 0.95 1.83
(a)
(b)
(c)
Figure 7: Comparison between groundtruth and estimated
glue levels. Figure 7a represents the groundtruth and esti-
mated glue level through Random Forest regression. Fig-
ure 7b represents the groundtruth and estimated glue level
through Polynomial regression. Figure 7c represents the
groundtruth and estimated glue level through Neural Net-
work regression.
Additionally, as complementary analysis, Figure 7
ICINCO 2021 - 18th International Conference on Informatics in Control, Automation and Robotics
736
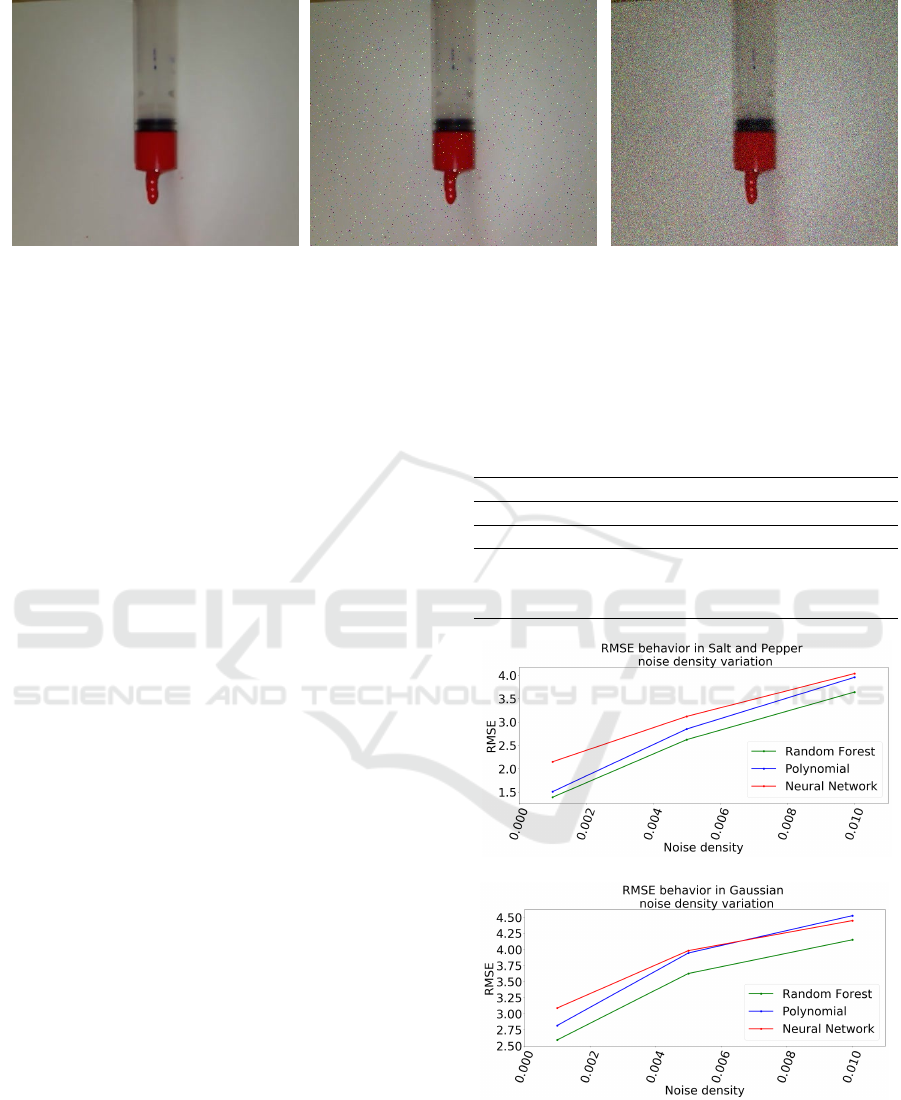
(a) (b) (c)
Figure 8: Glue tube images in injection process. Figure 8a corresponds to raw glue tube image. Figures 8b and 8c correspond
to raw image with Salt and Pepper noise and Gaussian noise, respectively.
represents the comparison between groundtruth glue
levels and the estimated glue levels, regarding the
used regression models. From Figure 7 it is possi-
ble to verify the proximity between estimated and true
glue levels. In Figure 7a we can observe the most
accurate predictions, using the proposed regression
model.
4.3 Robustness Evaluation of Glue
Level Prediction in Presence of
Noise
This experiment evaluates the robustness of the pro-
posed approach for glue level control in presence
of noise. Two different types of noise are added
in glue tube images, Salt and Pepper and Gaussian.
The three different regression models, Random For-
est (proposed), Polynomial and Neural Network, are
evaluated. In this experiment the added noise simu-
lates the image acquisition process regarding the pres-
ence of noise.
For this assessment, the regression model train-
ing is performed from a set of images without noise
and the testing stage regards another set of images
with added noise. Figure 8 represents glue tube im-
age examples. Figure 8a represents a glue tube with-
out noise. Figure 8b represents a glue tube with Salt
and Pepper noise, with 0.01 noise density. Figure 8c
represents a glue tube with Gaussian noise, with 0.01
noise density.
To evaluate the prediction’s quality, the RMSE
method is used to quantify how similar the known
glue levels and the predicted glue levels are. For
RMSE analysis, the closer to zero the result, the more
accurate the predictions are. Table 2, shows the glue
level control results for different types of noise and
different regression models. Results show that the
proposed Random Forest regression model outper-
forms the other regression models even in presence of
noise, demonstrating the robustness of the proposed
approach.
Table 2: Results for robustness evaluation of glue level pre-
diction in presence of noise. In this experiment are pre-
sented the RMSE for Salt and Pepper and Gaussian noise.
RMSE
Noise Salt and Pepper Gaussian
Noise density 0.01 0.01
Random Forest 3.64 4.15
Polynomial 3.95 4.52
Neural Network 4.03 4.44
(a)
(b)
Figure 9: RMSE behavior in noise density variation. Fig-
ure 9a corresponds to RMSE behavior in Salt and Pepper
noise variation. Figure 9b corresponds to RMSE behavior
in Gaussian noise variation.
Additionally, the proposed glue level estimation is as-
Glue Level Estimation through Automatic Visual Inspection in PCB Manufacturing
737

sessed through the noise density variation analysis.
Thereby, the glue level estimation accuracy is eval-
uated regarding different noise densities. In Figure
9 the regression models are applied in two different
noises, Salt and Pepper and Gaussian noises, regard-
ing three noise densities, 0.001, 0.005 and 0.01. In
Figures 9a and 9b the RMSE behaviors are presented
regarding the Salt and Pepper and Gaussian noises,
respectively. From Figures 9a and 9b it is possible
to verify the proposed approach effectiveness, even in
different noise densities.
5 CONCLUSION
In this paper, we addressed the problem of automatic
visual inspection for glue level control. Unlike other
state-of-the-art approaches, our method continuously
monitors the glue level during the glue injection pro-
cess in PCB manufacturing, aggregating more infor-
mation to production process.
Real-world and simulated experiments involving
different regression models and simulated noise types
have shown that the obtained glue level predictions
are reliable and accurate considering the obtained re-
sults. Additionally, the proposed approach demon-
strates robustness, even in presence of noise during
image acquisition, and feasibility to real time indus-
trial application, once the experiments were carried
out in real time scenario.
As future work, we intend to combine different
predictive methods to improve the glue level estima-
tion accuracy. We also intend to concentrate efforts
to extend the automatic visual inspection approach to
tackle other types of problems related to PCB manu-
facturing. The volume and position control of injected
glue is also a relevant problem we intend to investi-
gate and incorporate in production lines.
ACKNOWLEDGMENT
This work was developed with support from Cal-
Comp Eletronic through R&D project in Institute of
Exact Sciences and Technology of Federal University
of Amazonas, Itacoatiara, Amazonas.
REFERENCES
Abdul Rahman, N. N., Mohd Saad, N., and Abdullah, A. R.
(2018). Shape and level bottles detection using lo-
cal standard deviation and hough transform. Interna-
tional Journal of Electrical and Computer Engineer-
ing IJECE, 8:5032.
Breiman, L. (2001). Random forests. Machine Learning,
45(1):5–32.
Dong, X., Taylor, C. J., and Cootes, T. F. (2020). A
random forest-based automatic inspection system for
aerospace welds in x-ray images. IEEE Transactions
on Automation Science and Engineering, pages 1–14.
Forsyth, D. (2019). Applied Machine Learning. Springer
International Publishing.
Gonzalez, R. and Woods, R. (2017). Digital image process-
ing, 4th edn. isbn: 9780133356724.
Otsu, N. (1979). A threshold selection method from gray-
level histograms. IEEE Transactions on Systems,
Man, and Cybernetics, 9(1):62–66.
Rahman, N. N. S. A., Saad, N. M., Abdullah, A. R., and
Ahmat, N. (2019). A Review of Vision based De-
fect Detection using Image Processing Techniques for
Beverage Manufacturing Industry. Jurnal Teknologi,
81(3).
Remmach, H., Touahni, R., and Sbihi, A. (2020). Spatial-
color mode detection in uv pairwise projection of the
cie luv color space. In 2020 IEEE International Con-
ference on Informatics, IoT, and Enabling Technolo-
gies (ICIoT), pages 383–388.
Rocha, C. S., Menezes, M. A. G., and Oliveira, F. G.
(2016). Detecc¸
˜
ao autom
´
atica de microcomponentes
smt ausentes em placas de circuito impresso. In
Menotti, D. and Miranda, P., editors, Workshop on In-
dustry Applications (WIA) in the 29th Conference on
Graphics, Patterns and Images (SIBGRAPI’16), vol-
ume 1, S
˜
ao Jos
´
e dos Campos, SP, Brazil.
Saad, N. M., Rahman, N. N. A., Abdullah, A. R., and
Rahim, N. A. (2017). Real-time product quality in-
spection monitoring system using quadratic distance
and level classifier. Journal of Telecommunication,
Electronic and Computer Engineering, 9:57–62.
Suzuki, S. and be, K. (1985). Topological structural anal-
ysis of digitized binary images by border following.
Computer Vision, Graphics, and Image Processing,
30(1):32–46.
Thielen, N., Werner, D., Schmidt, K., Seidel, R., Reinhardt,
A., and Franke, J. (2020). A machine learning based
approach to detect false calls in smt manufacturing. In
2020 43rd International Spring Seminar on Electron-
ics Technology (ISSE), pages 1–6.
Vafeiadis, T., Dimitriou, N., Ioannidis, D., Wotherspoon, T.,
Tinker, G., and Tzovaras, D. (2018). A framework for
inspection of dies attachment on PCB utilizing ma-
chine learning techniques. Journal of Management
Analytics, 5(2):81–94.
Zhang, H., Li, X., Zhong, H., Yang, Y., Wu, Q. M. J., Ge,
J., and Wang, Y. (2018). Automated machine vision
system for liquid particle inspection of pharmaceutical
injection. IEEE Transactions on Instrumentation and
Measurement, 67(6):1278–1297.
Zhou, D., Zhang, G., and Guo, Y. (2017). Detecting multi-
interface from oil-water separation image based on
difference statistics method. In 2017 IEEE Inter-
national Conference on Smart Cloud (SmartCloud).
IEEE.
ICINCO 2021 - 18th International Conference on Informatics in Control, Automation and Robotics
738
