
DQ-MeeRKat: Automating Data Quality Monitoring with a
Reference-Data-Profile-Annotated Knowledge Graph
Lisa Ehrlinger
1,2 a
, Alexander Gindlhumer
1
, Lisa-Marie Huber
1
and Wolfram W
¨
oß
1
1
Johannes Kepler University Linz, Altenberger Straße 69, 4040 Linz, Austria
2
Software Competence Center Hagenberg GmbH, Softwarepark 32a, 4232 Hagenberg, Austria
Keywords:
Data Quality Monitoring, Data Profiling, Automation, Knowledge Graphs, Heterogeneous Data, Sensor Data.
Abstract:
High data quality (e.g., completeness, accuracy, non-redundancy) is essential to ensure the trustworthiness
of AI applications. In such applications, huge amounts of data is integrated from different heterogeneous
sources and complete, global domain knowledge is often not available. This scenario has a number of negative
effects, in particular, it is difficult to monitor data quality centrally and manual data curation is not feasible. To
overcome these problems, we developed DQ-MeeRKat, a data quality tool that implements a new method to
automate data quality monitoring. DQ-MeeRKat uses a knowledge graph to represent a global, homogenized
view of local data sources. This knowledge graph is annotated with reference data profiles, which serve as
quasi-gold-standard to automatically verify the quality of modified data. We evaluated DQ-MeeRKat on six
real-world data streams with qualitative feedback from the data owners. In contrast to existing data quality
tools, DQ-MeeRKat does not require domain experts to define rules, but can be fully automated.
1 INTRODUCTION
The main motivation for this paper can be summa-
rized with a quote from Mike Stonebraker that “with-
out clean data, machine learning is worthless”
1
. This
quote outlines the fact that the best artificial intelli-
gence (AI) model cannot provide reliable results with-
out high-quality training data (Fischer et al., 2021).
In a typical AI application, data is integrated
from heterogeneous sources into a central reposi-
tory (Stonebraker and Ilyas, 2018), which is the ba-
sis for training and testing computational models.
According to the Seattle Report on Database Re-
search (Abadi et al., 2019), the quality of data in
such applications cannot be taken for granted. De-
spite a precise definition of ETL (extract, transform,
load) processes, data quality (DQ) can vary over time,
either in the source systems, or through updates or
deletes in the central repository. Thus, it is crucial to
monitor DQ, because undetected DQ deterioration af-
fects data analysis results (Ehrlinger and W
¨
oß, 2017).
The next step is automation, to cope with the speed
and volume of data, which quickly overwhelms any
DQ monitoring effort (Sebastian-Coleman, 2013).
a
https://orcid.org/0000-0001-5313-0368
1
https://www.youtube.com/watch?v=DX77pAHlVHY
Motivating Example. A company from the automo-
tive industry has several factories distributed globally.
While customer data is created manually by employ-
ees, sensor data from the entire production process is
collected automatically and stored in different grades
of granularity. Individual departments maintain their
own databases (DBs), ranging from relational DBs,
over semi-structured JSON files, to unstructured text
documents. Data comes in different variance (static
master data to highly volatile data streams) and with
different semantic expressiveness.
Challenges. Based on scenario above, the following
challenges can be identified: (C1) DQ problems oc-
cur over the entire data lifecycle, which is partially
caused by (C2) the absence of one global view on the
data. (C3) Semi- and unstructured data sources do not
enforce schema constraints and (C4) manual data cu-
ration is not feasible due to the large amounts of data
processed in these pipelines. The decisions taken by
AI applications in such a setting cannot be trusted.
Contributions. In this paper, we present DQ-
MeeRKat (Automated Data Quality Measurement
using a Reference-data-profile-annotated Knowledge
Graph), a data quality tool, which addresses (C1–
C4) and enables automated DQ monitoring (ADQM)
in real-world AI applications. DQ-MeeRKat com-
bines the aspects of semantic data integration using
Ehrlinger, L., Gindlhumer, A., Huber, L. and Wöß, W.
DQ-MeeRKat: Automating Data Quality Monitoring with a Reference-Data-Profile-Annotated Knowledge Graph.
DOI: 10.5220/0010546202150222
In Proceedings of the 10th International Conference on Data Science, Technology and Applications (DATA 2021), pages 215-222
ISBN: 978-989-758-521-0
Copyright
c
2021 by SCITEPRESS – Science and Technology Publications, Lda. All rights reserved
215

a knowledge graph (KG) with our newly introduced
reference data profiles (RDPs) for ADQM. The appli-
cability of DQ-MeeRKat is demonstrated and eval-
uated with six data streams provided by Tributech
Solutions GmbH
2
. The significant advantage of DQ-
MeeRKat in contrast to existing DQ tools is the fully
automated RDP-based approach into DQ monitoring,
which does not require domain experts to define rules.
2 RELATED WORK
ADQM describes the calculation and storage of DQ
measurements over time to ensure that the qualitative
condition of the data remains stable (Ehrlinger and
W
¨
oß, 2017; Sebastian-Coleman, 2013). (Ehrlinger
and W
¨
oß, 2017) defined the requirements for ADQM
as follows: (R1) defining a DQ measurement strategy,
(R2) setting up a DQ repository to store DQ measure-
ment results over time, (R3) defining the analysis and
visualization of the DQ time series, and (R4) automat-
ing (i.e., scheduling) of DQ measurement. While
(R2–4) depend on the implementation, the question
“how DQ should actually be measured” is not trivial
and according to (Sebastian-Coleman, 2013) one of
the biggest challenges for DQ practitioners. The state
of the art offers two attempts to measure DQ: (1) the
theoretical perspective based on DQ dimensions and
metrics, and (2) the practitioners perspective imple-
mented in most DQ tools. Following, we discuss the
limitations of both perspectives for ADQM and ex-
plain the advantages of our RDP-based approach.
2.1 The Theoretical Perspective
(Wang and Strong, 1996) suggest to start a DQ project
with the selection of DQ dimensions (e.g., complete-
ness, accuracy, timeliness), which are then objec-
tively measured with DQ metrics (i.e., functions that
represent a dimension’s fulfillment with a numerical
value (Heinrich et al., 2018)). Although DQ dimen-
sions and metrics are commonly cited in DQ research,
a wide variety of definitions and classifications exist
for both DQ dimensions (Scannapieco and Catarci,
2002) and DQ metrics (Heinrich et al., 2018; Pipino
et al., 2005). The following limitations appear when
using DQ dimensions and metrics for ADQM:
• Ambiguous Definitions. Due to the wide variety
of definitions and classifications, practitioners of-
ten find it unclear to decide which DQ dimensions
and metrics should be used for DQ measurement
in a specific context (Sebastian-Coleman, 2013).
2
https://www.tributech.io
• DQ Metrics are Not Practically Applicable.
(Bronselaer et al., 2018) point out that the ma-
jority of DQ metrics, specifically those that ad-
here to the requirements for DQ metrics defined
by (Heinrich et al., 2018), cannot be well in-
terpreted and lack sound aggregation properties.
Many DQ metrics also rely on the existence of a
gold standard (a perfect reference), which is often
not available in practice (Ehrlinger et al., 2018).
Only few DQ tools actually implement DQ met-
rics, and these implementations are most often ap-
plicable on attribute-level only (Ehrlinger et al.,
2019).
2.2 The Practitioners Perspective
Most general-purpose DQ tools (e.g., Oracle
EDQ, SAS, Talend, Informatica as investigated
by (Ehrlinger et al., 2019) ) support a domain expert
in the creation of rules to resolve specific DQ prob-
lems, such as, duplicate records or missing values.
According to (Stonebraker and Ilyas, 2018), humans
can capture at most 500 rules, which is too little to
solve big data problems, but their creation is still a
very time-consuming and complex task for domain
experts. DQ-MeeRKat circumvents the manual
creation of DQ rules by implementing RDPs, which
can be initialized automatically.
Most DQ implementations from the DB commu-
nity focus on solving “point problems”, e.g., algo-
rithms for specific challenges (Abadi et al., 2019). In
addition to rule-based approaches, there exist a num-
ber of DQ tools dedicated to pattern-based error de-
tection, outlier detection, or data deduplication. All
of these tools are dedicated to a specific domain or
DQ task (Ehrlinger et al., 2019).
The most similar tool to DQ-MeeRKat in terms
of holistic DQ measurement is HoloDetect (Heidari
et al., 2019). In contrast to DQ-MeeRKat, HoloDe-
tect focuses on single tabular data files and does not
consider non-relational data sources. A further differ-
ence is the use of neural networks to learn error rep-
resentations, whereas we argue that explainability is a
core requirement for DQ measurement and therefore
focus on clearly interpretable statistics in the RDPs.
3 DQ-MeeRKat: APPROACH AND
IMPLEMENTATION
Based on the previous research in Section 2, we sug-
gest to use reference data profiles for ADQM. A
RDP is a composition of different data profiling tasks,
which can be calculated automatically and represent
DATA 2021 - 10th International Conference on Data Science, Technology and Applications
216

Figure 1: Overview on the approach and how to initialize the KG how to use it subsequently for DQ monitoring.
a quasi-gold-standard to verify whether DQ contin-
ues to conform to requirements. Figure 1 shows an
overview of the approach on how to perform ADQM
with RDPs. It is distinguished between two phases:
1. Initialization. Each input data source is described
with a set of schema elements in the KG (cf. Sec-
tion 3.1.1). For each schema element, a new RDP
is calculated and annotated, which stores informa-
tion about the desired target quality of the respec-
tive element (cf. Section 3.1.2).
2. DQ Monitoring. During runtime, current data
profiles (DPs) are calculated on-the-fly, which
have the same skeletal structure as their corre-
sponding RDPs. In each DQ measurement run,
the current DP is verified against its RDP. Deviat-
ing conformance can trigger an alert and is stored
in a conformance report (CR).
Our RDP-based method for ADQM has the fol-
lowing advantages compared to existing solutions:
Data and Domain-independent Solution. While
most DQ tools allow DQ measurement on single tab-
ular files (Ehrlinger et al., 2019), the KG allows to in-
vestigate multiple heterogeneous data sources at once.
Automation. Initialization of DQ-MeeRKat, i.e.,
the creation of the KG (consisting of schema elements
and their annotated RDPs) can be done fully automat-
ically. This automated step replaces the arduous man-
ual DQ rule creation (Stonebraker and Ilyas, 2018).
DQ Dimensions Not Required. In contrast to the
dimension-oriented perspective on DQ, it is also not
necessary to develop DQ metrics and to try to map
them to DQ dimensions. Prior research shows that
very little generally applicable DQ metrics exist and
that they need to be developed separately for specific
domains (Bronselaer et al., 2018; Sebastian-Coleman,
2013). The RDP-based approach can be interpreted
as a measure-centered view with the aim to measure
what can be measured, and that automatically.
Figure 2 shows the architecture of DQ-MeeRKat
with the Java runtime environment in the center.
In alignment with the indices, we first describe the
components for the initialization phase: (3.1.1) data
source connectors and data source description (DSD)
elements as the semantic abstraction layer for access-
ing heterogeneous data sources, (3.1.2) the creation
of RDPs and how they are annotated to DSD ele-
ments, and (3.1.3) GraphDB to store the entire KG.
Section 3.2 covers the components to deploy DQ-
MeeRKat for ADQM: (3.2.1) storage of DQ measure-
ments over time with InfluxDB, and (3.2.2) visualiza-
tion of the DQ time series with Grafana.
Figure 2: DQ-MeeRKat Architecture.
3.1 Components for Initialization Phase
3.1.1 Connectors and DSD Elements
For initializing the KG with semantic information
from different data sources, e.g., relational DBs, CSV
files, or NoSQL DBs, the data source connectors of
the DQ tool QuaIIe (Ehrlinger et al., 2018) have been
reused. The connectors enable access to heteroge-
neous data sources and transform their schema to a se-
mantic abstraction layer using the DSD vocabulary
3
.
Here, we list the most important terms and refer for
details on the connectors to (Ehrlinger et al., 2018):
3
Download the DSD vocabulary: http://dqm.faw.jku.at
DQ-MeeRKat: Automating Data Quality Monitoring with a Reference-Data-Profile-Annotated Knowledge Graph
217

• A Datasource represents one schema of an infor-
mation source and has a type (e.g., relational DB)
and an arbitrary number of concepts.
• A Concept is a real-world object type and can,
e.g., be a table in a relational DB.
• An Attribute is a property of a concept or an as-
sociation; e.g., the column “first name” provides
information about the concept “employees”.
We refer to these terms jointly as “DSD elements”.
During the initialization, the KG is created by map-
ping all data source schemas to their semantic rep-
resentation in the graph. This step is a prerequi-
site for comparing the quality of similar elements
(e.g., two tables storing customers) from different
data sources. To complete the KG, each DSD el-
ement is annotated with a RDP. Figure 1 shows a
schematic representation of the schema graph with
the DSD elements (white) along with their annotated
RDPs (green). Note that the schema graph is more
complex than a simple tree, but relationships (i.e., as-
sociations) have been omitted for clarity. The mir-
rored RDP graph is actually a tree where higher-level
RDPs (e.g., on concept or data source level) are par-
tially based on metrics of lower-level RDPs.
3.1.2 Initialization of Reference Data Profiles
During initialization, each DSD element is annotated
with a RDP, which model the qualitative target state of
the respective element. A RDP contains a set of data
profiling (DP) statistics, which are grouped into DP
categories and have three properties in common: a la-
bel for its identification, a value representing the value
determined by the statistic, and valueClass storing the
corresponding data type of the value. The valueClass
allows an automated selection of the correct compu-
tation process. Table 1 outlines the current structure
of the RDPs (with respect to DP categories and statis-
tics) as well as the values for one data stream (cf. Sec-
tion 4.4 for details). Deviations from this target state
are reported and need to be further investigated.
We used the work on data profiling by (Abed-
jan et al., 2019) as starting point to populate our
RDPs. The current version of DQ-MeeRKat sup-
ports all single-column DP tasks from (Abedjan et al.,
2019), which are listed in Table 1, including infor-
mation like the number of distinct or null values,
data types of attributes, or occurring patterns and
their frequency (e.g., formatting of telephone num-
bers) (Abedjan et al., 2019). The evaluation of all
remaining DP tasks from (Abedjan et al., 2019) is
part of our ongoing research. Specifically, we are cur-
rently working on the incorporation of multi-column
DP tasks and ML models for outlier detection.
Table 1: RDP Structure and Values for ACC-UoD.
DP Category DP Statistic ACC-UoD Value
Cardinalities
RDP size 1,000
Number of nulls 0
Percentage of nulls 0 %
Number distinct 177
Uniqueness 17.7 %
Data types,
patterns, and
domains
Basic type Numeric
Data type Double
Minimum 8.7966
Maximum 12.2485
Average 10.2310
Median 10.2185
Standard deviation 0.3736
Mean absolute deviation 0.2256
Number of digits 2
Number of decimals 14
Histogram
Number of classes 11
Class range 0.3138
Bucket values [4, 10, 60, 223, 376,
240, 62, 16, 4, 2, 3]
Dependencies Key candidate false
3.1.3 Knowledge Graph Store
Knowledge graphs have become a powerful tool to
manage domain knowledge since their core strength
are (1) semantic data modeling, (2) enabling a homog-
enized view of integrated data sources, and (3) infer-
ence of new fact with a reasoner (Hogan et al., 2019).
DQ-MeeRKat uses a KG to store the global do-
main knowledge (consisting of single schema de-
scriptions) and their RDPs. Our schema descriptions
are based on the DSD vocabulary (Ehrlinger et al.,
2018), which is an extension of the W3C standards
Resource Description Framework (RDF)
4
and Web
Ontology Language (OWL)
5
. Since RDF and OWL
support is required to import and process DSD, we
use GraphDB
6
, formerly “OWLIM” (Kiryakov et al.,
2005), as KG store for DQ-MeeRKat. In contrast
to other investigated graph DBs (like AllegroGraph
or Virtuoso), it met all performance requirements
for our use case and integrated seamlessly with DQ-
MeeRKat and frameworks like RDF4J since it is fully
implemented in Java (Ledvinka and K
ˇ
remen, 2019).
3.2 Components for DQ Monitoring
After the initialization phase of DQ-MeeRKat, which
is ideally performed on a cleaned subset of the data,
the quality of modified (i.e., inserted, updated, or
4
https://www.w3.org/RDF
5
https://www.w3.org/OWL
6
http://graphdb.ontotext.com
DATA 2021 - 10th International Conference on Data Science, Technology and Applications
218

deleted) data in the data sources can be continuously
checked by comparing it to the respective RDP. In
each ADQM run, DQ-MeeRKat creates a new cur-
rent DP for each DSD element in the KG. These DPs
have the same skeletal structure as the RDP described
in Section 3.1.2. In addition to the three basic prop-
erties (label, value, and valueClass), the current DPs
also store the reference to their respective RDP. Thus,
each DP statistic could be verified independently.
Based on the foundations for ADQM (Ehrlinger
and W
¨
oß, 2017), there are (in addition to automa-
tion and the selection of a proper DQ measurement
method) two more requirements for deploying our
framework over time: (3.2.1) to persist DQ measure-
ments with a timestamp, which indicates when the
measurement was taken, and (3.2.2) to visualize the
measurements to allow human supervision of outliers
and tracking the DQ development over time.
3.2.1 Data Quality Repository
We used InfluxDB to store DQ measurements over
time, which is the most popular time series DB ac-
cording to DB-Engines
7
and according to the discus-
sion by (Naqvi et al., 2017) suitable for our use case.
The enterprise version would also allow visualization,
which could be used instead of Grafana.
3.2.2 Visualization
Since DQ is usually perceived as subjective and
domain-dependent concept (Wang and Strong, 1996),
it is key to visualize the generated time series data
for the assessment through domain experts (comple-
mentary to automated post-analysis). Although it is
possible to use any visualization on top of InfluxDB,
we employed the well-known open-source software
Grafana
8
, which is also recommended by (Naqvi
et al., 2017). Grafana offers a customizable user inter-
face (UI) that is divided into dashboards, which group
DP statistics into separate visualization cases.
4 DEMONSTRATION AND
EVALUATION
In this section, we demonstrate and evaluate the ini-
talization (of the RDPs) as well as DQ monitoring
with DQ-MeeRKat. The data and setup used for the
experiments is described in Section 4.1. Following,
we conducted a qualitative evaluation in Section 4.2
7
https://db-engines.com/de/ranking/time+series+dbms
8
https://grafana.com
and demonstrate the applicability of DQ-MeeRKat by
means of two experiments: (1) to monitor the quality
of batch-loaded data in Section 4.3, and (2) to monitor
the quality of streaming data in Section 4.4.
4.1 Evaluation Data and Setup
For the evaluation, we used the six real-world data
streams listed in Table 2, which were recorded by an
automotive telematic device. The data was provided
by Tributech Solutions GmbH
2
, an Austrian company
that offers a solution for the audability of provisioned
data streams. In addition to the values collected by the
sensors, each data stream contains information about
the vehicle in which the device was mounted, a times-
tamp, a description of the sensor, the source system,
the controller, and the device group.
Table 2: Evaluation Data Sets.
Data Records Description
ACC-BoF 23,194 Acceleration measures whether the driver is
braking or pushing forward
ACC-StS 23,194 Lateral movement (acceleration – side to side)
ACC-UoD 23,194 Acceleration – up or down
D-Voltage 7,275 Device voltage
E-RPM 11,316 Engine revolutions per minute (RPM)
E-Speed 11,316 Engine speed
DQ-MeeRKat is available on GitHub
9
to support
further evaluations and repeatability. We used In-
fluxDB version 1.7.7.1 and Grafana version 6.2.5. In-
formation on how to install the external requirements
to execute this demo are provided on GitHub.
Four steps are necessary to initialize DQ-
MeeRKat and to create a set of RDPs: (1) estab-
lish the connection to the data sources, (2) load the
schema information, (3) add the schema information
to the KG, and (4) start the automated creation of the
RDP for all DSD elements in the KG. In the follow-
ing, we simulated a setting with heterogeneous data
sources by storing each data streams in a different
DB. The ACC-BoF data stream is accessed through
a Cassandra connector and the ACC-UoD data stream
through the CSV connector.
Co nn ec to rC as sa nd ra c onn 1 = new C on ne ct or Ca ss an dr a (
→ " ho st " , " ACC - BoF " , " u ser " , " pw ") ;
Co nn ec to rC SV con n2 = new C on ne cto rC SV ( " pa th / ACC -
→ UoD . cs v", " ," , " \n " , " ACC - U oD ") ;
Da ta so urc e d sBo F = c onn 1 . lo ad Sch em a () ;
Da ta so urc e d sUo D = c onn 2 . lo ad Sch em a () ;
The class DSDKnowledgeGraph allows to handle
multiple DSD Datasource objects.
9
https://github.com/lisehr/dqmeerkat
DQ-MeeRKat: Automating Data Quality Monitoring with a Reference-Data-Profile-Annotated Knowledge Graph
219

DS DK no wl ed ge Gr ap h kg = new D SD Kn ow le dgeGrap h ( "
→ A cce le ra ti on " );
kg . a dd Da ta so ur ce An dC on ne ct or ( dsBoF , conn1 );
kg . a dd Da ta so ur ce An dC on ne ct or ( dsUoD , conn2 );
With the following statement, all elements within
the KG are traversed and a new RDP is created for
each of them. The parameter RDP SIZE denotes the
number of records used to calculate the RDP.
kg . addD at aP ro fi le ( RDP _S IZE );
After the initial configuration of the RDPs, a cur-
rent DP is created for each batch, which is then stored
in InfluxDB with the respective timestamp.
In fl ux DB Co nn ec ti on inf = new I nf lu xD BC on ne ct io n () ;
kg . a dd Pr of il es To In fl ux ( in f );
4.2 Qualitative Evaluation
To evaluate the quality of automatically generated
RDPs and to verify how much refactoring by do-
main experts is required after the initialization phase,
we consulted the data owners from Tributech Solu-
tions GmbH to verify the RDPs for the provided data
streams. While Table 1 shows the RDP for the ACC-
UoD data stream value, all other RDPs created in the
course of this evaluation are available online
10
. The
feedback is summarized as follows:
• RDP Quality: after detailed investigation, the
automatically generated RDPs were found to be
plausible and to fit the provided data streams very
well. No surprising information and none that
contradicts the underlying data was found.
• Practical Relevance: since Tributech deals with
the auditability of provisioned data streams
2
, our
contact saw the major benefit of our RDP-based
method in the automation of data stream moni-
toring. From the currently implemented statistics
in the RDPs, uniqueness and domain information
(such as minimum, maximum, median, average,
and standard deviation) are specifically relevant
parameters for this use case.
Generally, practical viability is hard to test with-
out a large user study. However, the feedback from
Tributech indicates the general practical relevance of
the current development status of DQ-MeeRKat.
The data owners proposed the following en-
hancements to continue improving the value of DQ-
MeeRKat for deployment in practice: (1) to support
the verification of patterns in the data, e.g., to con-
tinuously monitor a specifically modeled temperature
10
RDPs to this evaluation: https://github.com/lisehr/
dq-meerkat/tree/master/documentation/TributechRDPs
curve in production data, (2) to take changes in the
RDP over time into account, e.g., when the occupancy
rate of a machine depends on the day of the week, and
(3) to enhance the interpretability for the end user,
e.g., by adding guidelines and clear descriptions of
the RDPs for less experienced users.
4.3 Experiment 1: Monitor the Quality
of Batch-loaded Data
In integration scenarios, data is usually loaded batch-
wise (e.g., via an ETL process) in periodic intervals
into a data warehouse or data lake (Giebler et al.,
2019). The task of an ADQM tool in such settings
is to verify whether the newly loaded data continues
to conform to the requirements modeled in the RDP.
To apply DQ-MeeRKat in real-world ETL scenarios,
we implemented the necessary extensions to use it as
plugin for the data integration tool Pentaho
11
.
When performing RDP-based ADQM with batch-
loaded data, 3 parameters need to be set: (1) a thresh-
old th to verify the conformance of a current DP to its
corresponding RDP, (2) the batch size bs, and (3) the
number of records to learn the RDP (RDP size rs). To
obtain the optimal parameter settings, we performed
an evaluation of the influence of the three parameters
on the average RDP conformance reported to the user
(cf. Figure 3). To simulate a scenario with batch-
loaded data, we grouped single records from the data
streams to batches and verified whether the current
DPs of the batch loaded at point t conforms to its
corresponding RDP. The transformation of streaming
data to batches with “window functions” is a common
technique to analyze data streams (Meng et al., 2016).
Figure 3: Parameter Evaluation.
It can be seen that a threshold of 0.1 is sufficient
to achieve a very high conformance for the Tributech
data sets, which was expected by the data owners due
to the nature of the data. With respect to the batch size
and RDP size, 1,000 records turned out to be a good fit
11
https://www.hitachivantara.com/de-de/products/
data-management-analytics/pentaho-platform/
pentaho-data-integration.html
DATA 2021 - 10th International Conference on Data Science, Technology and Applications
220
for our data. Interestingly, the RDP conformance can
deteriorate with an increasing number of records for
learning the RDPs or current data profiles. This shows
that the selection of larger batch sizes (time windows)
moves the conformance focus from time-local infor-
mation to time-global information.
Table 3 shows the conformance report of all six
data six data streams using the parameter setting de-
termined in Figure 3. It can be seen that all vari-
ables (third column) except for the attribute “value”
conform perfectly to their corresponding RDP over
time. Since the sensor values are the only variables
with a relatively high variability, some values exceed
the boundaries defined in the RDP when monitor-
ing the entire data. This conformance report can be
repeated for different data sets by executing RDP-
ConformanceTributechData.java from the GitHub de-
mos/repeatability folder
9
.
Table 3: RDP Conformance of Stream Data “Value” with
Threshold=0.1 and RDP Size=1,000.
CR % Value
bs=1,000
Value
bs=1
Other Variables
bs=1,000 ∨ 1
ACC-BoF 89.75 99.99 100
ACC-StS 86.34 99.98 100
ACC-UoD 93.17 94.73 100
D-Voltage 94.90 100 100
E-RPM 94.81 96.87 100
E-Speed 75.97 86.71 100
4.4 Experiment 2: Monitor the Quality
of Streaming Data
Grouping of multiple streaming records (i.e., win-
dowing) allows for the calculation of aggregates and
complex statistics (Meng et al., 2016). Comparing
only single records to their respective RDP precludes
the use of some statistics presented in Table 1, be-
cause they are either not calculable (e.g., variance) or
loose their semantic meaning (e.g., mean).
The third column in Table 3 shows the confor-
mance report of all six data stream values using the
same threshold and RDP size as for the batch data ex-
periment, but considers single records only. All other
variables (cf. fourth column) show the same perfect
conformance (100 %) as in the previous experiment.
It can be seen that the overall conformance of
the values is higher than with the batch-based con-
formance checks. Since no aggregation statistics are
compared but only (automatically generated) bound-
aries are checked, the proportion of statistics that
do not concern numeric variance (e.g., domain con-
straints, number of null values) is higher. This data set
contains only numeric deviations in DQ with respect
to the sensor values. Both experiments have their
application in practice: experiment 1 for ETL-based
data integration scenarios and experiment 2 for the
conformance verification of sensor or other stream-
ing data that is not preprocessed by window func-
tions. This evaluation shows the differences between
the two use cases and that compliance ratings may not
be directly comparable between different systems and
parameterizations.
The generation of conformance reports as demon-
strated so far is useful for automated post-processing.
Each record exceeding the RDP boundaries can trig-
ger an alert or an automated DQ countermeasure can
be set in place (e.g., the imputation of a missing
value). In other applications, the visualization of the
DQ time series to a user might be more interesting.
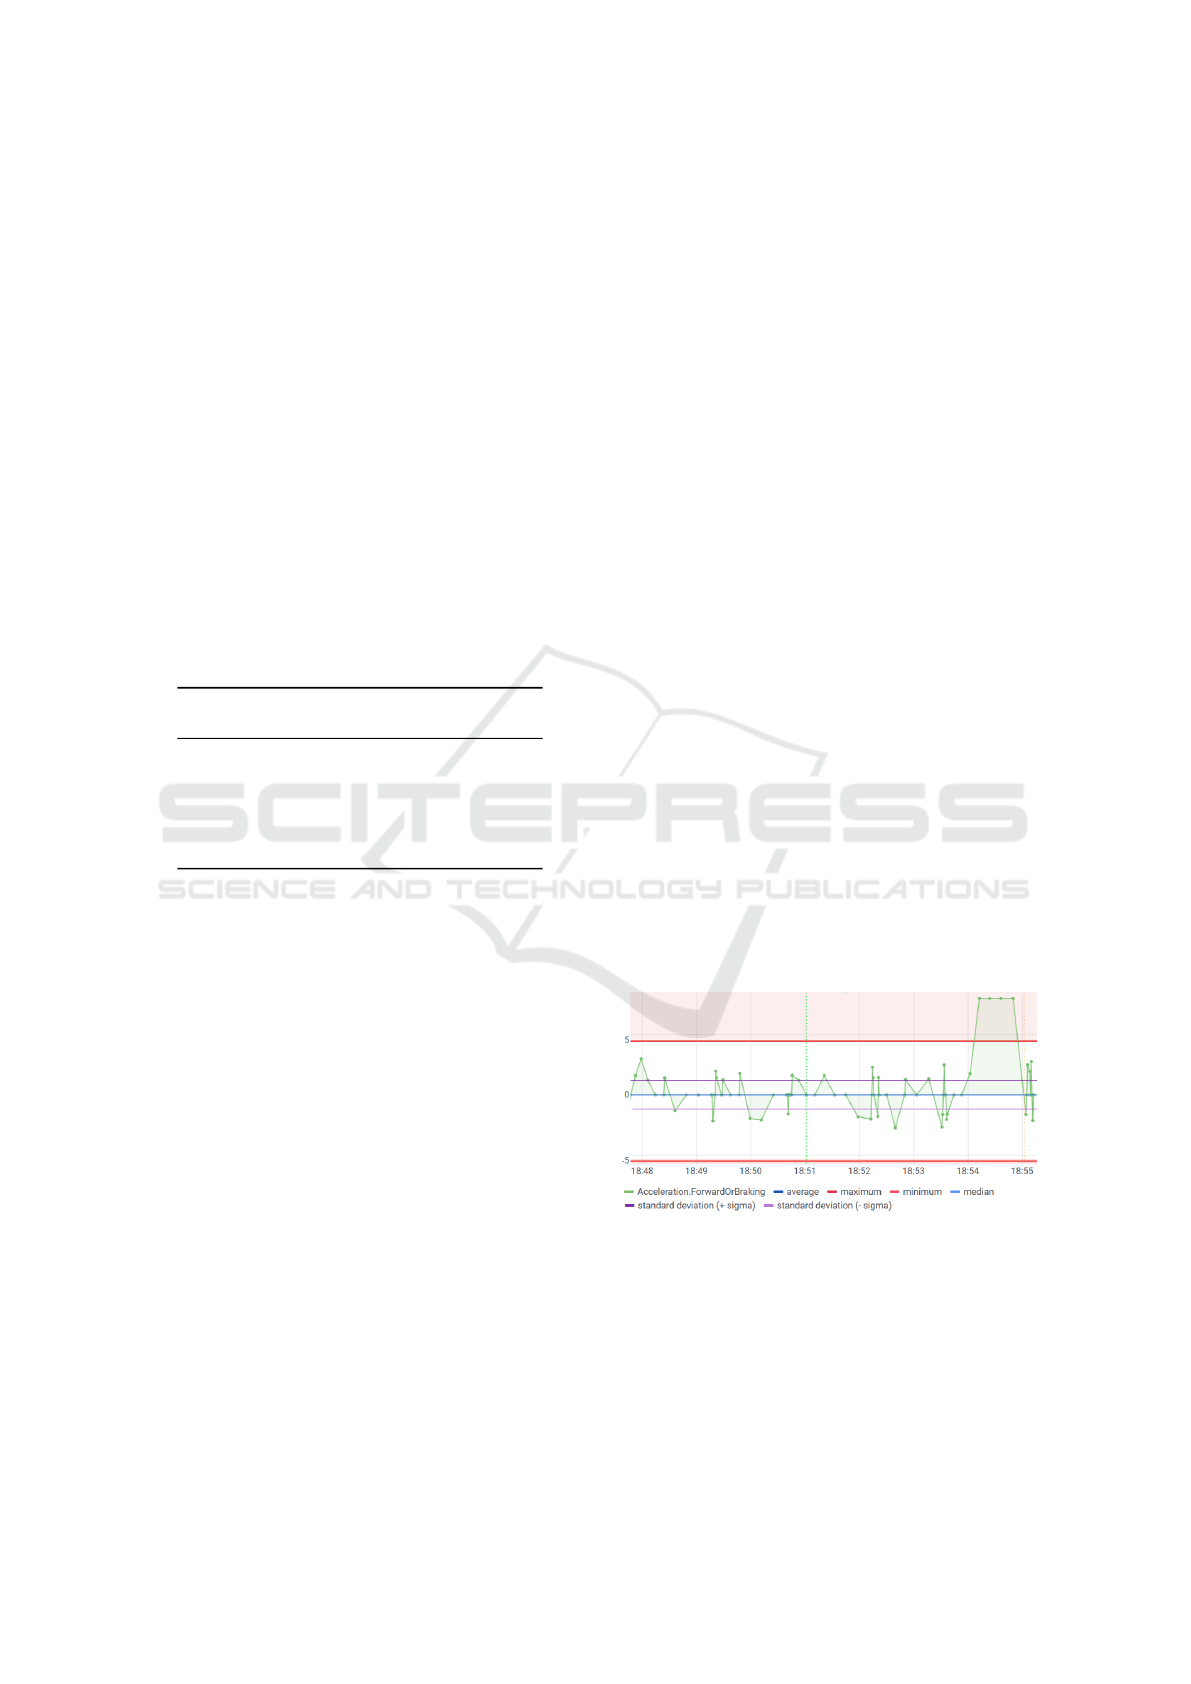
Figure 4 shows an excerpt of the Grafana dashboard.
The green line in Figure 4 represents the current val-
ues of the data stream ACC-BoF. The minimum and
maximum values in the RDPs are colored (dark and
light) red, average and median (dark and light) blue,
and the standard deviation in purple. After a longer
time of DQ monitoring, the ACC-BoF value suddenly
increases to 8.00, which clearly exceeds the maxi-
mum value of 4.44 as defined in the RDP. Follow-
ing, an automatic alert could be raised, which trig-
gers subsequent actions, e.g., prevents the data to be
stored in a central data store or requires intervention
of a domain expert. The visualization dashboard can
be invoked by executing DemoStreamingData.java
from demos/repeatability and further visualizations
are provided in the documentation/adqm-screenshots
folder of the GitHub repository
9
.
Figure 4: Visualization of RDP-based DQ Monitoring of
“Acceleration – Braking or Forward” Data Stream.
DQ-MeeRKat: Automating Data Quality Monitoring with a Reference-Data-Profile-Annotated Knowledge Graph
221

5 CONCLUSION AND OUTLOOK
In this paper, we presented DQ-MeeRKat, a tool
that implements a reference-data-profile-annotated
KG for automated DQ monitoring. We demonstrated
its applicability to (i) automatically learn RDPs for
heterogeneous data sources, and (ii) to calculate new
DPs on-the-fly to verify that newly inserted or up-
dated data continues to conform to the constraints
stored in the RDPs. We are currently working on and
planning the following extensions:
• A UI to enable RDP refinement for domain ex-
perts (cf. suggestion (3) by Tributech).
• As already incorporated in our vision, DQ-
MeeRKat aims to actively support the storage of
different versions per RDP.
• The overall vision for DQ-MeeRKat is to create
a comprehensive “AI-based surveillance state”,
which is capable of characterizing various kinds
of data to detect drifts and anomalies in DQ at the
earliest possible stage. Thus, we are going to en-
hance our RDPs with more complex statistics and
ML models, which are able to capture patterns in
the data (cf. suggestion (1) by Tributech). We will
focus on white-box models only since it is crucial
that statements about DQ are always explainable.
ACKNOWLEDGEMENTS
The research reported in this paper has been funded
by BMK, BMDW, and the Province of Upper Austria
in the frame of the COMET Programme managed by
FFG. The authors thank Patrick Lamplmair of Trib-
utech Solutions GmbH for providing the data streams.
REFERENCES
Abadi, D., Ailamaki, A., Andersen, D., Bailis, P., Balazin-
ska, M., Bernstein, P., Boncz, P., Chaudhuri, S., Che-
ung, A., Doan, A., et al. (2019). The Seattle Re-
port on Database Research. ACM SIGMOD Record,
48(4):44–53.
Abedjan, Z., Golab, L., Naumann, F., and Papenbrock, T.
(2019). Data Profiling. Synthesis Lectures on Data
Management, 10(4):1–154.
Bronselaer, A., De Mol, R., and De Tr
´
e, G. (2018). A
Measure-theoretic Foundation for Data Quality. IEEE
Transactions on Fuzzy Systems, 26(2):627–639.
Ehrlinger, L., Rusz, E., and W
¨
oß, W. (2019). A Survey
of Data Quality Measurement and Monitoring Tools.
CoRR, abs/1907.08138:1–30.
Ehrlinger, L., Werth, B., and W
¨
oß, W. (2018). Automated
Continuous Data Quality Measurement with QuaIIe.
International Journal on Advances in Software, 11(3
& 4):400–417.
Ehrlinger, L. and W
¨
oß, W. (2017). Automated Data Qual-
ity Monitoring. In Proceedings of the 22nd MIT In-
ternational Conference on Information Quality (MIT
ICIQ), pages 15.1–15.9, UA Little Rock, AR, USA.
Fischer, L., Ehrlinger, L., Geist, V., Ramler, R., Sobieczky,
F., Zellinger, W., Brunner, D., Kumar, M., and Moser,
B. (2021). AI System Engineering–Key Challenges
and Lessons Learned. Machine Learning and Knowl-
edge Extraction, 3(1):56–83.
Giebler, C., Gr
¨
oger, C., Hoos, E., Schwarz, H., and
Mitschang, B. (2019). Leveraging the Data Lake:
Current State and Challenges. In Big Data Analyt-
ics and Knowledge Discovery, pages 179–188, Cham.
Springer International Publishing.
Heidari, A., McGrath, J., Ilyas, I. F., and Rekatsinas, T.
(2019). Holodetect: Few-Shot Learning for Error De-
tection. In Intl. Conf. on Management of Data (SIG-
MOD’19), pages 829–846, New York, USA, ACM.
Heinrich, B., Hristova, D., Klier, M., Schiller, A., and
Szubartowicz, M. (2018). Requirements for Data
Quality Metrics. Journal of Data and Information
Quality, 9(2):12:1–12:32.
Hogan, A., Brickley, D., Gutierrez, C., Polleres, A., ,
and Zimmerman, A.(2019). (Re)Defining Knowl-
edge Graphs. In Knowledge Graphs: New Directions
for Knowledge Representation on the Semantic Web
(Dagstuhl Seminar 18371), pages 74–79, Germany.
Kiryakov, A., Ognyanov, D., and Manov, D. (2005).
OWLIM – A Pragmatic Semantic Repository for
OWL. In International Conf. on Web Information Sys-
tems Engineering – WISE 2005 Workshops, vol.3807,
pages 182–192. Springer.
Ledvinka, M. and K
ˇ
remen, P. (2019). A Comparison
of Object-Triple Mapping Libraries. Semantic Web,
pages 1–43. Preprint.
Meng, X., Bradley, J., Yavuz, B., Sparks, E., Venkataraman,
S., Liu, D., Freeman, J., Tsai, D., Amde, M., Owen,
S., et al. (2016). Mllib: Machine Learning in Apache
Spark. The Journal of Machine Learning Research,
17(1):1235–1241.
Naqvi, S. N. Z., Yfantidou, S., and Zim
´
anyi, E. (2017).
Time Series Databases and InfluxDB. Technical re-
port, Universit
´
e Libre de Bruxelles.
Pipino, L., Wang, R., Kopcso, D., and Rybolt, W. (2005).
Developing Measurement Scales for Data-Quality Di-
mensions. Information Quality, 1:37–52.
Scannapieco, M. and Catarci, T. (2002). Data Quality Under
a Computer Science Perspective. Archivi & Computer,
2:1–15.
Sebastian-Coleman, L. (2013). Measuring Data Quality for
Ongoing Improvement: A Data Quality Assessment
Framework. Elsevier, Waltham, MA, USA.
Stonebraker, M. and Ilyas, I. F. (2018). Data Integration:
The Current Status and the Way Forward. Bulletin of
the IEEE Computer Society Technical Committee on
Data Engineering, 41(2):3–9.
Wang, R. Y. and Strong, D. (1996). Beyond Accuracy:
What Data Quality Means to Data Consumers. Jour-
nal of Management Information Systems, 12(4):5–33.
DATA 2021 - 10th International Conference on Data Science, Technology and Applications
222
