
Design of a Simulation Platform to Test the Suitability of Different
PEM Electrolyzer Models to Implement Digital Replicas
Francisco Javier Folgado Gaspar
a
, A. José Calderón Godoy
b
, Isaías González Pérez
c
,
Manuel Calderón Godoy
d
, José María Portalo Calero
e
and Diego Orellana Martín
Industrial Engineering School, University of Extremadura, Avenida de Elvas, Badajoz, Spain
Keywords: Digital Replica, Simulation, Matlab/Simulink, Electrolyzer, Green Hydrogen, Microgrid.
Abstract: Green hydrogen is produced from renewable energies, being a promising integration in the field of microgrids.
For a proper utilization, hydrogen generators, known as electrolyzers, must be studied and handled with a
deep knowledge about their complex and non-linear behavior. In this sense, digital replicas (DR) are mainly
based on mathematical models and constitute a merging paradigm envisioned to accurately represent the
operation of physical systems within a simulated framework. This paper presents the development and initial
implementation of a platform to simulate different models of proton exchange membrane electrolyzers aiming
at evaluating their fitness and performance. The suite Matlab/Simulink has been applied including a Graphical
User Interface to facilitate the interaction with the user. This tool is envisioned to contribute scientists to select
and develop DR of such challenging equipment for tasks like performance analyses, prognostics and control
purposes. The main features of the platform as well as preliminary results are reported.
1 INTRODUCTION
Renewable energy sources (RES) like solar
photovoltaic and wind generators require energy
storage systems to handle in short and long-term
energy flows. This fact achieves higher importance
due to the variability of such RES, which gives place
to situations of significant surplus of energy. The
combined use of RES and hydrogen is a promising
solution for the storage of such surplus energy
(Atlam, 2011).
Hydrogen must be produced using equipment
called electrolyzers or hydrogen generators by
different technologies. Among these, electrolysis of
water using RES seems to be one of the best options
(Guilbert, 2020). This way, the surplus of energy
from RES can be devoted to produce hydrogen
through water electrolysis, acting as long-term energy
storage means (Ogawa, 2018).
Proton exchange membrane (PEM) electrolyzers
(PEMEL) are considered as a viable alternative for
a
https://orcid.org/0000-0001-6010-0685
b
https://orcid.org/0000-0003-2094-209X
c
https://orcid.org/0000-0001-5645-3832
d
https://orcid.org/0000-0001-8380-8547
e
https://orcid.org/0000-0003-4521-5841
generation of hydrogen from RES (Abe, 2019). In
fact, hydrogen generated from RES is commonly
referred to as renewable hydrogen or, even, green
hydrogen (Noussan, 2021).
In this sense, a microgrid can be defined as an
integrated power system made up of several power
generation systems, energy storage means, and
electrical loads. In general, it can consist of a single
autonomous grid or it can be connected to the general
distribution grid. The development of microgrid
technology is of great significance to adjust the
energy structure, protect the environment, solve the
problem of energy consumption in rural and remote
areas, and the transition from the traditional power
grid to a smart grid (Wu, 2020).
The main goal of autonomous microgrids that
include RES and hydrogen is to optimize electricity
production, trying to adapt the production of
electrical energy to the energy demanded, avoiding
energy gaps at all times. In this context, PEMEL are
becoming one of the most useful technologies to
430
Gaspar, F., Godoy, A., Pérez, I., Godoy, M., Calero, J. and Martín, D.
Design of a Simulation Platform to Test the Suitability of Different PEM Electrolyzer Models to Implement Digital Replicas.
DOI: 10.5220/0010582104300437
In Proceedings of the 11th International Conference on Simulation and Modeling Methodologies, Technologies and Applications (SIMULTECH 2021), pages 430-437
ISBN: 978-989-758-528-9
Copyright
c
2021 by SCITEPRESS – Science and Technology Publications, Lda. All rights reserved

produce green hydrogen though RES in microgrids.
The integration of PEMEL in microgrids has shown
interesting advantages to improve microgrid
performance and promote the use of hydrogen energy
(Li, 2019).
PEMEL are composed of a number of individual
cells stacked into a stack to get the desirable
production of hydrogen at a given voltage. The
objective of this approach is to adjust hydrogen
production to the available surplus energy. Hence, a
supervisory and control system must implement an
energy management strategy (EMS) to handle the
activation of the PEMEL (González, 2021).
Figure 1 shows the block diagram of the microgrid
that is being developed in our laboratories. This one
consists of a photovoltaic (PV) array, a lithium
battery, and a combination of electrolyzer, fuel cell
and hydrogen tank.
Figure 1: Schematic diagram of the stand-alone microgrid
with hydrogen subsystem.
Such microgrid is framed in an on-going R&D
Project that deals with the digital transformation in
the field of RES and microgrids. Essentially, this
project consists of the design and development of a
digital representation or Digital Replica (DR) of the
described microgrid.
The concept of DR, also known as digital twin,
receives important research efforts from
academicians and practitioners. There is a lack of a
generalized concept of DR, so the definition proposed
in (Calderón, 2019) is considered in the present work,
namely, a DR is a representation of a physical
process/system which runs in a digital environment.
The objective of DR is beyond simulating the
behavior of the physical counterpart in an off-line
mode, it is expected to accurately emulate the
dynamics of the physical facility running in a
software environment in parallel. Moreover, it is
envisioned to support decision taking in the EMS for
enhanced performance and reduction of degradation
of hydrogen equipment.
In general, DR acts as a powerful workbench on
which to test, evaluate, analyse, etc., as if it were the
real system, avoiding the limitations and technical-
economic disadvantages of taking the physical
system to certain states operatives (Calderón, 2019).
In particular, for the energetic context some
interesting applications are conducting preventive
and predictive maintenance to increase the life time;
decreasing downtimes and associated costs; study of
behavior, detection of deviations and reaction to
extreme situations; optimization of efficiency and
operation from an economic and energy point of
view; as well as making decisions based on data
management, just to name a few (Calderón, 2019).
There is a large and increasing amount of papers
dealing with digital replicas in industrial context;
however, for energy-related frameworks, this topic
has been scarcely treated (Calderón, 2019). For
instance, in (Tao, 2018) DR of wind turbines are
addressed; buildings are digitally mirrored in
(O’Dwyer, 2019); and a cyber-model for power
electronics in microgrids is presented in
(Senthilnathan, 2019). An IoT-based digital twin is
proposed in (Saad, 2020) focusing on communication
aspects of Energy Cyber-Physical Systems. An
algorithm to schedule the energy storage system of a
microgrid is proposed in (Park, 2020) under the
concept of digital twin.
When deploying a DR, the choice of the software
suite is not a trivial task. There is no consensus about
the software that must be applied, in fact, different
approaches are found in previous literature.
EnergyPlus, focused in energy-related facilities, is
used in (O’Dwyer, 2019) to implement a DR. Black-
box models or artificial intelligence tools like Neural
Networks are applied in (Rahman, 2018) and (Park,
2020). LabVIEW, widely used for monitoring and
virtual instrumentation, serves to deploy a DR in
(Senthilnathan, 2019). Focused on mathematical
representations, Matlab/Simulink is selected in
(González-González, 2018).
In this latter regard, a brief literature survey shows
that Matlab/Simulink provides a high degree of
maturity and versatility to implement models and DR
of electrolyzers. For example, the work in (Xiao,
2009) develops the model of a PEM fuel cell under
the Matlab/Simulink environment. A dynamic model
of a PEMEL based on Matlab/Simulink is presented
in (Awasthi, 2011). A Simulink-based model of a
PEMEL is reported in (Beainy, 2014). An alkaline
electrolyzer is simulated in (Tijani, 2014) trough
Matlab. In (Yigit, 2016) Simulink is used to model a
high-pressure PEMEL. The model of a PEMEL
Design of a Simulation Platform to Test the Suitability of Different PEM Electrolyzer Models to Implement Digital Replicas
431

powered by a solar panel is implemented in
Matlab/Simulink in (Albarghot, 2016). Matlab is
applied to simulate hydrogen production through a
PEMEL from PV energy in (Ismail, 2019).
It must be noted that a lack that most of previous
literature present is a user-friendly Graphical User
Interface (GUI), which is an important aspect when
handling models and DR. Only (Xiao, 2009) and
(Tijani, 2014) report the development of a GUI.
Indeed, in (Rocca, 2020) it is asserted that digital
twins need a proper GUI to be more user friendly and
support easier decision making.
This paper presents a platform based on
Matlab/Simulink to assess different models for
PEMEL. The design and initial successful results are
reported. The ultimate goal of the developed platform
is to support the evaluation of different models
available in previous literature in order to implement
a DR. The user is able to choose the model among a
variety and can also edit certain parameters. After
that, the simulation of the selected replica is plotted
and displayed. By using this tool, the suitability of the
model can be analysed and evaluated for the
hydrogen generator. A remarkable feature is that a
GUI has been developed to provide an intuitive and
easy-to-use interaction.
The structure of the rest of the manuscript is as
follows. Section 2 reviews mathematical models
widely validated in literature to be considered as DR.
The organization of the developed platform is
described in Section 3. The fourth section reports the
preliminary implementation and results. Finally, the
main conclusions of the work are addressed.
2 REVIEW OF THE SELECTED
PEMEL MODELS
This section deals with the models, available in the
literature, that have been considered for the
development of the simulation platform. The goal of
this platform is to corroborate the feasibility of each
one of them to adapt itself to a certain real electrolyzer.
Models based on electrical equivalents of the
electrolyzer have been used, since the final objective
is to obtain the relationship between the electrical
energy consumed (input) and the flow of electrolytic
hydrogen generated (output).
In this regard, having an accurate model of a real
device is essential to reproduce its operation and the
interactions with the rest of involved equipment.
The aim of this work is to obtain the input current-
voltage characteristic for a single PEM electrolyzer
cell under steady-state conditions. In these models,
the reversible voltage is defined from Gibbs energy,
whose calculation is based on the Nernst equation.
The remaining voltages (activation overvoltage,
ohmic potential and diffusion over-potential) are
determined by applying the Taffel equation.
It is also possible to determine the electrolyzer
operating efficiency from the H
2
generation ratio as a
function of its operating point.
In this first proposal, the losses of the DC/DC
converter have not been taken into account for the
calculation of the performance of the electrolyzer
stack.
All the considered models have been applied,
tested and compared with the references used,
obtaining results without significant errors.
2.1 Equivalent Electrical Model for a
PEMEL under Steady-state
Conditions
In this case, the equivalent electrical model developed
in (Atlam, 2009; Atlam, 2011) for a PEMEL is
simulated. This simulation is based on the equivalent
circuit model that appears in Figure 2.
Figure 2: Equivalent circuit model for a single PEMEL.
As can be observed in Figure 2, the static behavior
of the electrolyzer is represented by a reversible
voltage in series with a resistance. The reversible
potential is the voltage of the electrolyzer without
losses. The higher heating value (HHV) for e
rev
is
considered a constant DC voltage source equal to
1.476V (T=20ºC, p=1atm).
The reversible potential consists of the ideal
electrochemical potential, V
i
, along with the
activation over-potential.
The ohmic over potential during the operation are
collected in R
i
. For these conditions, the non-linear
model used in this case responds to the equation,
V=1.46760 − 1.4760e
.
+ 0.3264I
(1)
On the other hand, the ideal electrochemical potential,
V
i
, is defined for the electrolysis reaction and is
obtained from the increase in Gibbs free energy
according to the expression:
SIMULTECH 2021 - 11th International Conference on Simulation and Modeling Methodologies, Technologies and Applications
432

V
=
∆G
2F
(2)
Being:
∆G=285,840 − 163.2(273+ T)
(3)
Under normal pressure and temperature conditions
(20ºC and 1 atm), V
i
=1.233V.
To determine the hydrogen generation ratio
according to the electrolyzer operation point, the
Faraday law is used. The hydrogen production rate,
v
H
(ml min
-1
) with respect to the input current I (A)
can be calculated by expression,
v
=
v
(
l
)
10
ml
l
60 s
min
I
C
s
2F
(
C
)
=
v
(
10
)(
60
)
I
2F
(4)
The electrochemical power of hydrogen can be
derived from V
i
(i.e. useful power P
H2
) through the
expression,
P
=
v
ml
min
∆G
l
mol
v
l
mol
10
ml
l
60 s
min
=
v
(10
)
(
60
)
I
2F
2FV
v
(
10
)
(
60
)
=IV
(5)
According to (Atlam, 2011) the input electrical
power, P, of a cell is defined by Eq. (6):
P=VI=𝐼
𝑅
+𝐼𝑒
=𝑣
2𝐹
𝑣
10
(
60
)
𝑅
+𝑣
2𝐹
𝑣
10
(
60
)
𝑒
(6)
The PEMEL cell efficiency η
e
is obtained from the
ratio between the electrochemical power of hydrogen
and the input power,
η
=
𝑃
P
=
𝑉
𝐼
𝑉
𝐼
=
𝑉
𝑉
(7)
The effect of pressure and temperature on the
characteristic I-V curve of a PEMEL cell is
investigated in this work. To do this, both R
i
and e
rev
have been modelled as functions of p and T.
𝑅
(
T,p
)
=𝑅
+𝑘 𝑙𝑛
𝑝
𝑝
+𝑑𝑅
(𝑇− 𝑇
)
(8)
𝑒
(
T,p
)
=𝑒
+
𝑅(273 + 𝑇)
2𝐹
𝑙𝑛
𝑝
𝑝
(9)
The I-V characteristic is obtained for a single PEMEL
cell, with conditions of normal ambient temperature
(20 ºC) and nominal atmospheric pressure (1 atm).
2.2 Modelling by Varying Temperature
and Pressure
In the previous case, the reversible potential is
considered a constant value of 1.476V. This is
because both the ideal electrochemical potential, Vi,
and the activation overpotential are calculated for
nominal conditions of temperature and pressure
(T=20 ºC, p=1 atm).
In this case, the effects of varying electrolyzer
temperature and pressure on electrolyzer performance
behavior and over-potentials are presented and
analysed.
The developed model in (Awasthi, 2011) aims at
determining the relationship between the cell current
and cell voltage. This model is based on equation (9),
but instead of considering e
rev, o
a constant value
(1.229V), in this work a temperature dependant value
is applied. The temperature dependant value or
reversible cell voltage is given by:
E
=1.229 − 0.9×10
(𝑇
− 298)
(10)
The activation overpotential is calculated applying
the Butler-Volmer equation for both anode and
cathode, giving:
η
=
𝑅𝑇
𝛼
𝐹
𝑎𝑟𝑐 sinh
𝑖
2𝑖
,
+
𝑅𝑇
𝛼
𝐹
𝑎𝑟𝑐 sinh
𝑖
2𝑖
,
(11)
Ohmic over-voltages:
η
=
𝛿
𝐼
𝐴
𝜎
(12)
2.3 Model According to Tafel’s Law
According to Tafel’s law, the cell voltage in this
case is expressed as a function of the current density
(Ismail, 2019):
𝑉
=a+b×log
(
I
)
+c×I
(13)
The parameters a, b and c are defined according to the
particular features of an electrolyzer cell (e.g.,
geometry, flow, material, pressure and temperature
conditions)
Taking into account the ideal gas law, the
hydrogen production rate is calculated by:
𝑄
=
𝑁
×𝑅×𝐼
×𝑇
𝑍×𝐹×𝑃
=
𝑁
×8.32×𝐼
×𝑇
2 × 96500× 0.1013
(14)
Design of a Simulation Platform to Test the Suitability of Different PEM Electrolyzer Models to Implement Digital Replicas
433

The efficiency of electrolyzer is given by the
following equation:
η
=
1.23 × s
𝑉
(15)
2.4 Dynamic Emulation of a PEMEL
The objective of this case is to develop a dynamic
model of a PEMEL. The equivalent circuit model
considered is shown in Figure 3.
Figure 3: Equivalent circuit scheme of the PEMEL.
This model uses resistor-capacitances (RC)
networks to represent the dynamic behavior of the
electrolyzer in the cathode (R1C1) an in the anode
(R2C2) respectively. As pointed in (Atlam, 2011), the
V
int
voltage reproduces the power converted into
hydrogen, whereas the resistance R
int
reproduces the
losses in the membrane.
Although the two capacitances can be assumed
equal, the resistors represent different effects: R
2
simulates Gibbs energy and the heat loss in the anode,
and R
1
only just the heat loss in the cathode.
3 OPERATION AND
STRUCTURE OF THE
PLATFORM
The GUI serves as a centralized tool for the study of
the behavior of the different electrolyzer models
presented in the literature. The models selected for the
interface have been (Atlam, 2011), (Awasthi, 2011),
(Ismail, 2019) and (Guilbert, 2019).
The model (Atlam, 2011) has been taken as an
example to explain the functioning and structure of
the GUI.
In addition, the design of the GUI has been
performed taking into account the guidelines reported
in the ISA-101 standard.
The performance of the designed platform is
based on the relationship between the block diagrams
of the DR in Simulink, the Matlab workspace and the
GUI. Fist, the user configures the values of the
parameters used for a specific model of the
electrolyzer. These values are loaded to the Matlab
workspace from where they are read by Simulink in
order to simulate the DR.
For the case of (Atlam, 2011), the block diagram
in Figure 4 differentiates the voltage calculation for
constant or pressure and temperature dependant
values of e
rev
and R
i
.
Figure 4: Block diagram of the model described in
subsection 2.1.
To finish, the results are sent back to the
workspace and read by the GUI to present the data to
the user.
The flow of data and information during the
execution of the GUI is represented in Figure 5.
The interconnection between environments
allows the user to handle only the GUI without the
need to interact directly with the models in Simulink
or the Matlab workspace.
Data exchange between the platform and the
experimental setup of the PEMEL will be handled by
means of a middleware, namely using the interface
OPC (Open Platform Communications).
This way, magnitudes gathered by the automation
system of the microgrid will be shared with the GUI
for real-time operation.
Figure 5: Data flow and operation scheme.
SIMULTECH 2021 - 11th International Conference on Simulation and Modeling Methodologies, Technologies and Applications
434
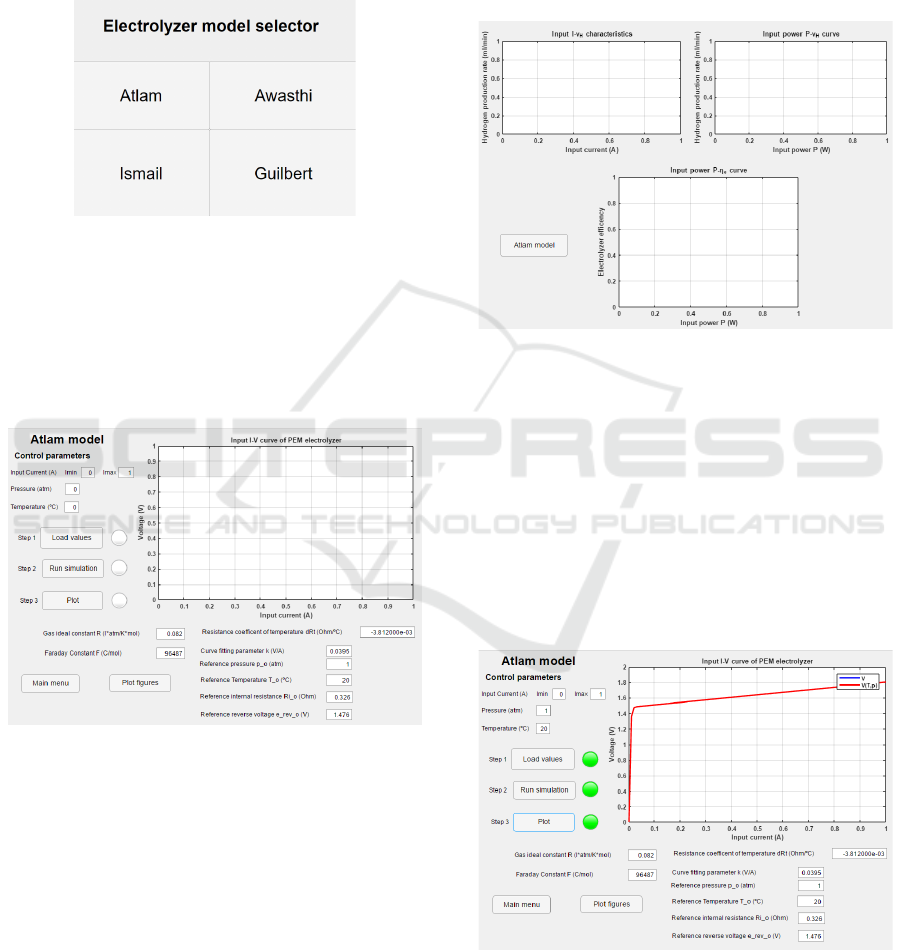
3.1 Structure of the GUI
The GUI has a structure composed of several tabs
navigable between them by a series of buttons. The
main tab “Electrolyzer model selector” allows the
user to access the display and control tabs of each of
the DR modelled on Simulink.
Figure 6: Main tab Electrolyzer model selector.
Inside the model tab (see Figure 7), the GUI
shows a configuration zone of the parameter used in
the DR, buttons ordered in a specific sequence to
execute the Simulink simulation and represent the
results, and a graph associated with the I-V curve
characteristic of the electrolyzer.
Figure 7: Atlam model tab.
The “Load values” button sends the values of the
model parameters to the Matlab workspace to be read
by Simulink in its simulation. The “Run simulation”
button runs the simulation of the current Simulink
model. At the end of the simulation, the results are
stored in the Matlab workspace. The “plot” button
reads the values stored in the workspace and
generates the figures of the model’s representative
curves.
Each button is accompanied by a LED indicator
that shows the state of the step. If the indicator is in
red color it means that the step is running and if it is
in green color, the step has finished, and the user can
continue to run the next step.
The “Main menu” button returns the view to the
main tab by saving the current status of the model tab.
On the other hand, the “Plot figures” button changes
the tab displayed to one centred on the representation
on the remaining plots of the model, such as the
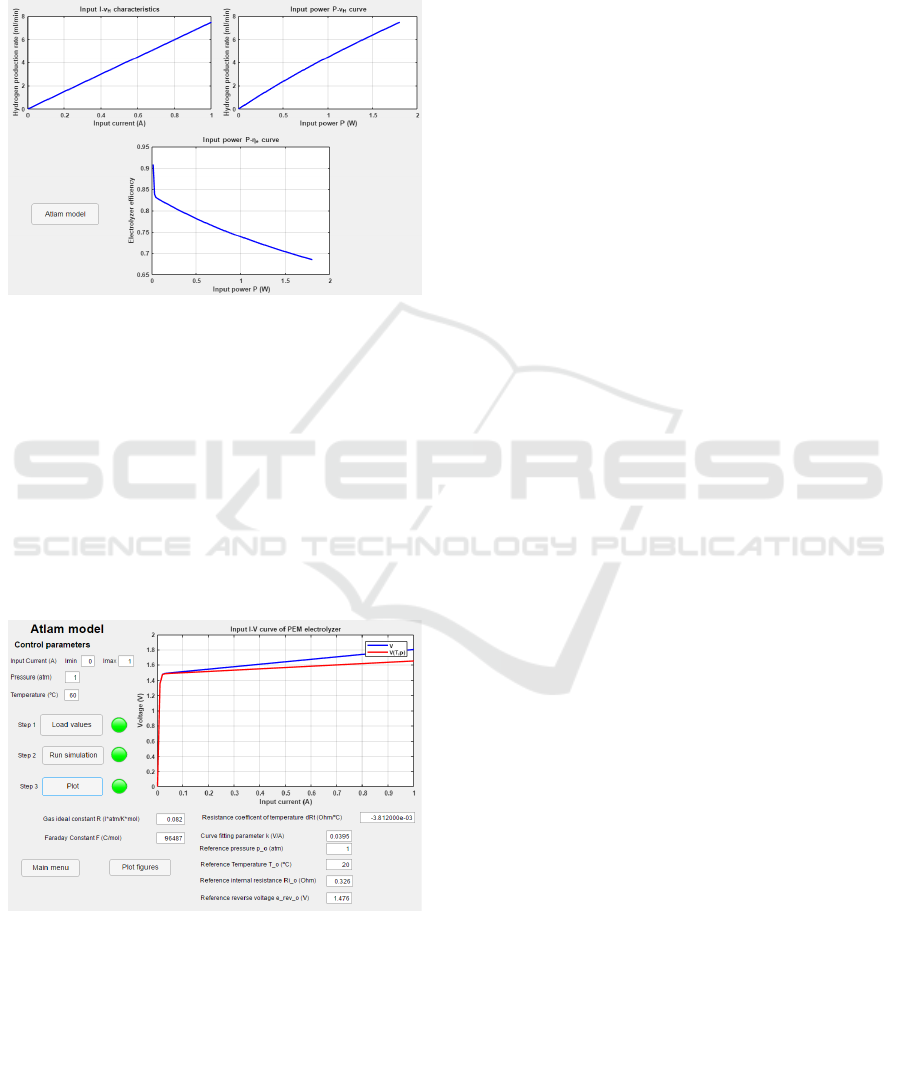
curves I-vH, P-vH and P-ηe. (see Figure. 8)
Figure 8: Plot figures tab.
4 IMPLEMENTATION AND
RESULTS
In order to demonstrate the implementation of the
developed platform, the model (Atlam, 2011) has
been simulated under normal pressure and
temperature conditions (T=20 ºC, p=1 atm) to
compare the result of the DR with the model. The
obtained results are seen in Figure 9.
Figure 9: Input I-V curves at 20 ºC and 1 atm represented
in the GUI.
The curves I-V and I-V(T,p) coincide because the
simulated pressure and temperature conditions are
Design of a Simulation Platform to Test the Suitability of Different PEM Electrolyzer Models to Implement Digital Replicas
435
equal to the reference pressure and temperature
values (T=To=20 ºC, p=po=1 atm).
The LED indicators show that all steps have been
successfully completed and all curves shown,
including those in the “Atlam figures” tab, match the
model curves (Atlam, 2011), as seen in Figure 10.
Figure 10: I-vH, P-vH and P-ηe curves simulated in the
GUI.
By repeating the simulation under temperature
condition 60 ºC and pressure 1 atm, the following I-
V curves are obtained.
Figure 11 shows the effects of pressure and
temperature variation on the voltage calculation, as
well as the GUI response to interaction and parameter
modification.
As in the previous simulation, the curves coincide
with those of the model (Atlam, 2011), concluding
that the behavior
of the DR match with the model.
Figure 11: I-V curves at 60 ºC and 1 atm represented in the
GUI.
5 CONCLUSIONS
This paper has presented a platform based on
Matlab/Simulink to study models of PEMEL. A user-
friendly GUI facilitates the visualization and
interpretation of the simulated data, as well as the
customization of certain parameters of the considered
models. As a proof of concept, the results achieved
for the well-known equivalent circuit model proposed
in (Atlam, 2011) have been reported.
Further works will address the implementation of
a DR through the comparison of experimental data of
PEMEL stacks with the models using the developed
platform. Moreover, the user-friendly features of the
GUI are yet to be studied through usability tests in
order to evaluate and improve its aspect and
operation.
ACKNOWLEDGEMENTS
This project was co-financed by European Regional
Development Funds FEDER and by the Junta de
Extremadura (IB18041).
REFERENCES
Abe, J.O., Popoola, A.P.I., Ajenifuja, E., Popoola, O.M.,
2019. Hydrogen energy, economy and storage: Review
and recommendation. International Journal of
Hydrogen Energy, vol. 44, pp. 15072-15086.
Atlam, O., 2009. An experimental and modelling study of a
photovoltaic/proton-exchange membrane electrolyser
system. International Journal of Hydrogen Energy, vol.
34, pp. 6589-6595.
Atlam, O., Kolhe, M. 2011. Equivalent electrical model for
a proton exchange membrane (PEM) electrolyser.
Energy Conversion and Management, vol. 52, pp.
2952-2957.
Awasthi, A., Scott, K., Basu, S., 2011. Dynamic modeling
and simulation of a proton exchange membrane
electrolyzer for hydrogen production. International
Journal of Hydrogen Energy, vol. 36, pp. 14779-14786.
Beainy, A., Karami, N., Moubayed, N. Simulink Model for
a PEM Electrolyzer Based on an Equivalent Electrical
Circuit. International Conference on Renewable
Energies for Developing Countries 2014, November
2014, Beirut, Lebanon.
Calderón, A.J., González, I., 2019. Design and
implementation of Smart Micro-Grid and its Digital
Replica. First steps. 16th International Conference on
Informatics in Control, Automation and Robotics,
Prague, Czech Republic.
González, I., Calderón, A.J., Portalo, J.M., 2021.
Innovative Multi-Layered Architecture for
Heterogeneous Automation and Monitoring Systems:
Application Case of a Photovoltaic Smart Microgrid.
Sustainability, vol. 13, pp. 2234.
SIMULTECH 2021 - 11th International Conference on Simulation and Modeling Methodologies, Technologies and Applications
436

Guilbert, D., Vitale, G., 2020. Improved Hydrogen-
Production-Based Power Management Control of a
Wind Turbine Conversion System Coupled with
Multistack Proton Exchange Membrane Electrolyzers.
Energies, vol. 13, pp. 1239.
Ismail, T.M., Ramzy, K., Elnaghi, B.E., Abelwhab, M.N.,
El-Salam, M.A., 2019. Using MATLAB to model and
simulate a photovoltaic system to produce hydrogen.
Energy Conversion and Management, vol. 185, pp.
101-129.
Li, Z., Zheng, Z., Xu, L., Lu, X., 2019. A review of the
applications of fuel cells in microgrids: opportunities
and challenges. BMC Energy, vol. 1, pp. 8.
Albarghot, M., Sasi, M., Rolland, L., 2016.
MATLAB/Simulink Modeling and Experimental
Results of a PEM Electrolyzer Powered by a Solar
Panel. Journal of Energy and Power Engineering, vol.
10, pp. 779-785.
Noussan, M., Raimondi, P.P., Scita, R., Hafner, M. (2021).
The Role of Green and Blue Hydrogen in the Energy
Transition—A Technological and Geopolitical
Perspective. Sustainability, vol. 13, 298.
O’Dwyer, E., Pan, I., Acha, S., Shah, N., 2019. Smart
energy systems for sustainable smart cities: Current
developments, trends and future directions. Applied
Energy, vol. 237, pp. 581-597.
Ogawa, T., Takeuchi, M., Kajikawa, Y., 2018. Analysis of
Trends and Emerging Technologies in Water
Electrolysis Research Based on a Computational
Method: A Comparison with Fuel Cell Research.
Sustainability, vol. 10, pp. 478.
Park, H.-A; Byeon, G.; Son, W.; Jo, H.-C.; Kim, J.; Kim,
S., 2020. Digital Twin for Operation of Microgrid:
Optimal Scheduling in Virtual Space of Digital Twin.
Energies, vol. 13, 5504.
Rahman, S.M., Rasheed, A., San, O., 2018. A Hybrid
Analytics Paradigm Combining Physics-Based
Modeling and Data-Driven Modeling to Accelerate
Incompressible Flow Solvers. Fluids, vol. 3, pp. 50.
Rocca, R.; Rosa, P.; Sassanelli, C.; Fumagalli, L.; Terzi, S.,
2020. Integrating Virtual Reality and Digital Twin in
Circular Economy Practices: A Laboratory Application
Case. Sustainability, vol. 12, 2286.
Saad, A.; Faddel, S.; Mohammed, O., 2020. IoT-Based
Digital Twin for Energy Cyber-Physical Systems:
Design and Implementation. Energies, vol. 13, 4762.
Senthilnathan, K., Annapoorani, I., 2019. Multi-Port
Current Source Inverter for Smart Microgrid
Applications: A Cyber Physical Paradigm. Electronics,
vol. 8, pp. 1.
Yigit, T., Selamet, O.F., 2016. Mathematical modeling and
dynamic Simulink simulation of high-pressure PEM
electrolyzer system. International Journal of Hydrogen
Energy, vol. 41, pp. 13901-13914.
Tao, F., Zhang, M., Liu, Y., Nee, A.Y.C., 2018. Digital twin
driven prognostics and health management for complex
equipment. CIRP Annals – Manufacturing Technology,
vol. 67, pp. 169-172.
Tijani, A.S., Yusup, N.A.B., Rahim, A.H.A., 2014.
Mathematical Modelling and Simulation Analysis of
Advanced Alkaline Electrolyzer System for Hydrogen
Production. Procedia Technology, vol. 15, pp. 798-806.
Wu, Y., Wu, Y., Guerrero, J.M., Vasquez, J.C., Palacios-
García, E.J., Guan, Y., 2020. IoT-enabled Microgrid for
Intelligent Energy-aware Buildings: A Novel
Hierarchical Self-consumption Scheme with
Renewables. Electronics, vol. 9, 550.
Xiao, Y.; Agbossou, K. Interface Design and Software
Development for PEM Fuel Cell Modeling based on
Matlab/Simulink Environment. 2009 WRI World
Congress on Software Engineering, Xiamen, China.
Design of a Simulation Platform to Test the Suitability of Different PEM Electrolyzer Models to Implement Digital Replicas
437
