
Location Determination of On-body Inertial Sensors
Hisham Madcor
1 a
, Osama Adel
1 b
and Walid Gomaa
1,2 c
1
Cyber-Physical Systems Lab, Department of Computer Science and Engineering,
Egypt-Japan University of Science and Technology, Borg El-Arab, Alexandria, Egypt
2
Faculty of Engineering Alexandria University, Alexandria, Egypt
Keywords:
Sensor Position, Multi-sensory, Intertial Sensors, Human-centered Computing.
Abstract:
Human Activity Recognition has gained tremendous drive in recent years. This is due to the increasing ubiq-
uity of all types of sensors in commodity devices such as smartphones, smart watches, tablets, etc. This has
made available to the normal user a continuous stream of data including visual data, inertial motion data, au-
dio, etc. In this paper we focus on data streamed from inertial motion units (IMUs). Such units are currently
embedded on almost all wearable devices including smart watches, wrist bands, etc. In many research works,
as well as in many real applications, different specialized IMU units are mounted on different body parts. In
the current work, we try to answer the following question: given the streamed inertial signals of a gait pattern,
as well as some other activities, determine which sensor location on the subject’s body generated this signal.
We validate our work on several datasets that contain multi-dimensional measurements from a multitude of
sensors mounted on different body parts. The main sensors used are the accelerometer and gyroscope. We use
the Random Forest Classifier over the raw data without any prior feature extraction. This has proven yet very
effective as evidenced by the results using different metrics including accuracy, precision, recall, F1-score,
etc. An important application of such research can be in data augmentation of timeseries inertial data. This
can be used as well for healthcare applications, for example, in treatment assessment for people with motion
disabilities.
1 INTRODUCTION
Human Activity Recognition (HAR) is a field of re-
search that boomed in popularity in recent years with
the ubiquity of wearable smart devices such as smart
watches and smartphones. Using the inertial sen-
sors (such as accelerometers, gyroscopes and mag-
netometers) embedded inside these devices, the mo-
tion dynamics of different activities can be recorded,
streamed to a processing unit, and be analyzed to rec-
ognize the action the current user is doing. Similarly,
recent research showed also that the identity of the
user can be identified using these sensors during one
of the most common activities done throughout the
day, i.e. walking (Adel et al., 2020).
Nevertheless, since these devices can be used in
so many different contexts (e.g. sports, medical pur-
poses, research purposes), they can be placed on dif-
ferent locations on human body (wrists, legs, arms,
a
https://orcid.org/0000-0002-8727-7242
b
https://orcid.org/0000-0003-3471-5787
c
https://orcid.org/0000-0002-8518-8908
etc.). The variety of places that these sensors can be
placed on can greatly affect the accuracy of human
activity recognition or person identification. Mean-
while, detecting sensor placement has not attracted
enough attention in research and has been done im-
plicitly in few works on few common places (such as
right and left pockets and right and left hands only)
(Primo et al., 2014).
In this paper we focus on the detection of loca-
tion of on-body inertial sensors using Random Forest
Classifier during various activities using four differ-
ent publicly available datasets that use inertial sensors
( accelerometer and gyroscope included). The contri-
butions of this work are as follows:
• We present a full detection of inertial wearable
sensors on different parts of human body during
various activities on four different datasets.
• We work on raw inertial data without any feature
extraction algorithms.
• We achieved an average accuracy of 92.33% on
all the four datasets.
Madcor, H., Adel, O. and Gomaa, W.
Location Determination of On-body Inertial Sensors.
DOI: 10.5220/0010582806930700
In Proceedings of the 18th International Conference on Informatics in Control, Automation and Robotics (ICINCO 2021), pages 693-700
ISBN: 978-989-758-522-7
Copyright
c
2021 by SCITEPRESS – Science and Technology Publications, Lda. All rights reserved
693
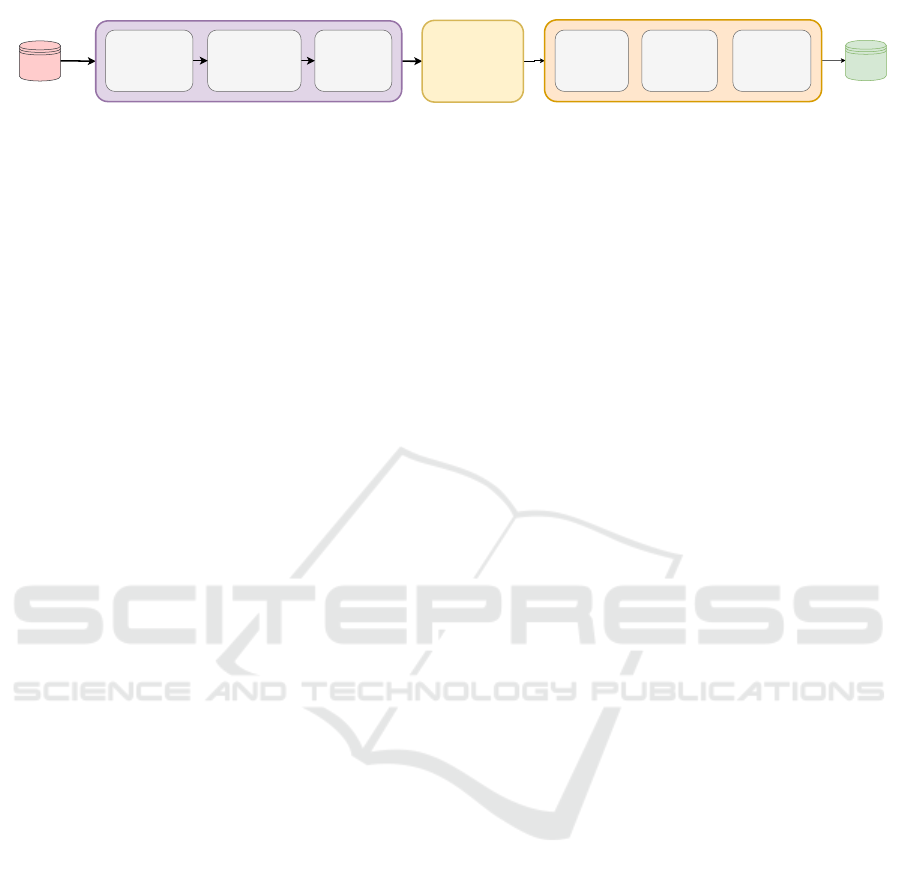
Model Evaluation Data Processing Model Training Results
Data
Unfolding
Segmentation
&
Labeling
Load data as
Numpy
Random
Forest
Classifier
Dataset
Confusion
Matrix
Classification
Report
Accuracy
Figure 1: Experiments pipeline.
The rest of the paper is organized as follows. Sec-
tion 1 as introduction. The related work is presented
in Section 2. Then, we explain our proposed method-
ology in Section 3, which we explain in it the experi-
ments pipeline shown in Figure 1. After that, we show
our experiments in Section 4. Our results and discus-
sion are presented in Section 5. Finally, Section 6 is
the conclusion of our work and the future plans.
2 RELATED WORK
(Kunze et al., 2005) managed to derive the location
of the acceleration sensor on the user’s body using
the sensor’s signals only. Their algorithm in detecting
the location of the sensor is not affected by the sen-
sor’s orientation. Using this algorithm, they managed
to identify the time periods where the user is walking
and then by using the unique characteristics of walk-
ing they could identify the location of the sensor on
the user’s body. The fact that the location of the sensor
is an interesting context was what motivated them to
do this work. In addition to that, They denoted that the
locations of the sensors was chosen according to reg-
ularly used devices and sensors. They used four clas-
sifiers: C 4.5, Naive Bayes, Naive Bayes simple and
Nearest Neighbor. The experiments were on 6 sub-
jects. They conducted 3 runs each run was between
12 and 15 minutes with 8 activities performed. The
senors were placed on 6 different body parts: wrist,
right side of the head, left trouser’s pocket and left
breast pocket. The C 4.5 classifier got the highest ac-
curacy among the four used classifiers by accuracy
89.81%.
On the other hand, (Vahdatpour et al., 2011) used
accelerometers to capture the motion data of subjects’
actions. This data allowed them to detect the loca-
tion of the sensor on the subject’s body by using a
mixed supervised and unsupervised time series analy-
sis model. They used Support Vector Machine (SVM)
algorithm to identify the sensors’ locations. Further-
more, they used their own dataset which consisted
of 25 subjects with sensors mounted on 10 different
places on the body. Those 10 places were classi-
fied into 6 regions: forearm, upper arm, head, thigh,
shin and waist. In their first conducted experiment,
they trained and tested the SVM on each subject sep-
arately with training and testing ratio 2:8. The results
were 88%, 98% and 100% for the minimum, mean
and maximum precision, respectively. In the second
conducted experiment, they trained the model on ran-
domly chosen segment from different subjects and the
average accuracy for this experiment was 89%.
In (Sztyler and Stuckenschmidt, 2016), the au-
thors presented a dataset with 17 subjects with 8 per-
formed activities, each subject wore 7 sensors on the
head, chest, upper arm, waist, forearm, thigh and shin.
They used acceleration sensor’s data like the previ-
ous two works to identify the sensor’s location by us-
ing a Random Forest Classifier. They introduced their
method for the location identification by treating the
position as a multi class classification problem that
made the sensors’ locations the targeted classes. They
conducted their experiments on each subject individu-
ally, as they reasoned, due to the difference in individ-
ual behaviour and ages. After they had conducted the
experiments, they achieved an average performance
accuracy of 89% across all positions and subjects.
The authors in (Weenk et al., 2013) introduced an
automatic identification method for inertial sensors
on different body parts during walking. This intro-
duced method allows the user to place inertial sen-
sors in a full body or lower body plus trunk configu-
rations. The number of sensors that implemented by
the user ranges from 17 to 8 inertial sensor in the men-
tioned places respectively. Based on the acceleration
and angular velocity data extracted from the user’s
walking for a few seconds, the identification process
is automatically done. Their dataset is composed of
11 healthy subjects performed 35 walking trials, and
then tested on 7 patients after a reconstruction surgery
in their knee. The authors extracted RMS, variance,
correlation and inter-axis correlation co-efficients fea-
tures from magnitudes and the 3D components of the
acceleration, angular acceleration and angular veloc-
ity. In their experiments, the authors used J4.8 deci-
sion tree algorithm as their classifier. J4.8 is an im-
plementation for C 4.5 algorithm which is the same
classifier used in (Kunze et al., 2005). Their process
gets 100% for lower body sensors plus trunk configu-
rations and 97% for full body sensors.
In this work, however, we conduct our experi-
ments on four publicly available datasets with vary-
ing number of subjects and activities using a Random
ICINCO 2021 - 18th International Conference on Informatics in Control, Automation and Robotics
694

Forest Classifier trained on the raw inertial data of
accelerometer and gyroscope only. We also achieve
state-of-the-art performance in comparison to the pre-
vious works.
3 PROPOSED METHODOLOGY
In this section, we will explain briefly the different
stages of our proposed methodology. As can be seen
in Figure 1, we start by loading the datasets before
performing any processing on them in the preprocess-
ing stage. Next, the data is fed to a machine learn-
ing classifier model for training. After the model is
trained, we evaluate our model using different metrics
on a test set and report our results.
3.1 Data Preprocessing
The data preprocessing stage consists of three steps:
loading the data, data segmentation and labeling, then
data unfolding.
In the first stage, we make sure that all dataset files
are converted to Numpy arrays. This is because each
dataset we use has a different file structure and a dif-
ferent file format, it is an important step to unify all
these datasets in one common format.
Each IMU data file consists of R×C matrix, where
R is the number of timesteps, and C is the number
of axes or channels (i.e. 6 channels for a 3-axis ac-
celerometer and 3-axis gyroscope). We iterate over
each data file for each IMU device and segment the
data into 3-second fixed-length segments. For exam-
ple, if the sampling rate is in our dataset is equal to
50 Hz, our final segments will be 150 × 6 matrices.
For each data segment, we construct a label y corre-
sponding to the IMU device from which the data was
recorded. Hence, if we have M segments, we end up
with M labels as well. To be able to use the data seg-
ments in our machine learning model, we unfold each
data segment into a 1-D vector x ∈ R
RC
. Therefore,
the output of the preprocessing stage is a M × RC data
matrix X, and a M-dimensional labels vector y.
3.2 Model Training
After the data preprocessing stage, the data is ready to
be fed to the model. We train a Random Forest Classi-
fier to predict the location of the IMUs in a number of
datasets. Random Forest Classifier is a ensemble clas-
sifier that uses a large number of decision trees classi-
fiers on features selected randomly from the training
data, and then use averaging to improve the prediction
accuracy and control over fitting (Breiman, 2001). In
our model, We set the number of decision trees to 500,
use the gini index which is the function that measures
the quality of a split. We set the minimum number of
samples to split to 2 samples and used bootstrapping.
3.3 Model Evaluation
After training the model, we then evaluate it on a test
set using four different metrics: the accuracy, preci-
sion, recall and F1-score.
We calculate the test accuracy of the model as fol-
lows:
accuracy = [
1
N
N−1
∑
i=0
1( ˆy
i
= y
i
)] × 100% (1)
where y
i
is the test label number i, ˆy
i
is the pre-
dicted label number i and N is the total number of
samples in the test set. The expression 1(x
i
= y
i
) is
called indicator function which indicates the member-
ship of ˆy in y.
We calculate the precision and recall using the fol-
lowing formulae:
precision =
T P
T P + FP
(2)
recall =
T P
T P + FN
(3)
where T P is the number of true positives, FP is
the number of false positives and FN is the number
of false negatives for each class. The precision ratio
shows the classifiers ability to avoid labeling a pos-
itive sample as negative while the recall ratio shows
the ability of the classifier to correctly find all the pos-
itive samples.
On the other hand, The F1-Score is the harmonic
mean of precision and recall. The F1-Score is calcu-
lated as:
F
1
= 2 ×
precision × recall
precision + recall
(4)
The F1-score is a single number that incorporates
both the prevision and recall. Its maximum value is 1
when the model has perfect precision and recall. The
minimum value is 0 when either the precision or recall
is zero.
4 EXPERIMENTS
In our experiments we apply the steps mentioned in
Section 3 on four publicly available datasets: EJUST-
GINR-1, RealDisp, HuGaDB and MMUSID. Each
Location Determination of On-body Inertial Sensors
695

Table 1: Datasets summary.
Datasets No. of samples No. of sensors No. of activities
Body parts Other
Back Waist Legs Arms BP HCB
EJUST-GINR-1 46236 8 1 1 1 2 4 - -
RealDisp 148698 9 33 1 - 4 4 - -
HuGaDB 70980 6 12 - - 6 - - -
MMUSID 26924 6 1 - - 2 2 1 1
(b)
RealDisp
(a)
EJUST-GINER-1
Back
LUA
RUA
RH
LCRC
Waist
Back
RUA
RLA
LUA
LLA
RC LC
RT
LT
LTRT
RS
RF
LS
LF
RH
BackPack
LH
HCB
LP
RP
LH
(c)
HuGaDB
(d)
MMUSID
Figure 2: Datasets Sensors’ Locations.
dataset has a slightly different number of devices
mounted on different locations on human body as
shown in Figure 2. We load each dataset then feed
75% of the raw data (without any feature extraction)
to our Random Forest Classifier to train on and finally,
we evaluate our model on 25% of the data reporting
the four measure dicussed in Section 3.3.
4.1 Datasets
In this section we give a brief overview of the datasets
used in our experimentation. The highlights of the
four datasets are summarized in Table 1.
4.1.1 EJUST-GINR-1
EJUST-GINR-1 dataset consists of 8 IMUs each unit
streams tri-axis accelerometer and tri-axis gyroscope
data with a sampling rate of 50 Hz. Gait data is
collected from 20 subjects, 10 males and 10 fe-
males (Adel et al., 2020) and the sensory units are
located on 8 different body parts as show in Figure 2a.
4.1.2 RealDisp
The RealDisp dataset consists of 9 IMUs each streams
tri-axis accelerometer, tri-axis gyroscope and tri-axis
magnetic field readings, in addition to orientation es-
timates in 4D format with sampling rate of 50 Hz.
The data is collected from 17 subjects with 33 activ-
ities. There are three scenarios for placing the sen-
sors: Ideal, Self and Mutual. In the ideal scenario, the
instructor places the sensors in the predefined places
on the subject’s body. In the self scenario, the user
is asked by the instructor to position 3 sensors on
the specified locations. In the mutual scenario, the
instructor introduces an intentional disposition of a
number of sensors (4 to 7 sensors) using rotations and
translations with respect to the ideal case (Banos and
T
´
oth, 2014). In our experiment we only use the ideal
scenario files. The sensors are located on 9 different
body parts as shown in Figure 2b.
4.1.3 HuGaDB
HuGaDB dataset consists of 8 units, 6 units are iner-
tial sensor units streaming tri-axial accelerometer and
tri-axial gyroscope readings while the other two are
EMG sensors. The data is collected from 18 subjects
with 12 different activities (Chereshnev and Kert
´
esz-
Farkas, 2017). In our experiment we used only the
inertial sensors readings which are located mainly on
6 different parts of the leg as shown in Figure 2c
ICINCO 2021 - 18th International Conference on Informatics in Control, Automation and Robotics
696

4.1.4 MMUSID
MMUSID consists of 6 sensor units each streaming
tri-axial accelerometer and tri-axial gyroscope read-
ings for 120 subjects with sampling rate of 50 Hz. The
dataset includes only the walking activity but with
different speeds: slow, normal and fast walking (Per-
matasari et al., 2020). The sensors in this dataset are
placed in places that mimic the real life such as in a
backpack, hand-carried bag, right and left pockets and
right and left hands as shown in Figure 2d.
5 RESULTS AND DISCUSSION
5.1 Results
In this section we report the results of our experiments
on each dataset separately. We constructed a confu-
sion matrix for our model on each dataset showing
the cross-accuracy between the classes while the the
vertical axis is the ground truth and the the horizon-
tal axis is the prediction. The confusion matrices for
all datasets are shown in Figure 3a, Figure 3b, Fig-
ure 3c and Figure 3d. It is clear from the diagonal
of the four confusion matrices that the model could
observe all the sensor places with high accuracy in
all the datasets. Moreover, as we see in Table 2,
the model has a test accuracy over all classes for
EJUST-GINR-1, RealDisp, HuGaDB and MMUSID
of 92.86%, 84%, 93.98% and 98.49%, respectively.
5.1.1 EJUST-GINR-1
The EJUST-GINR-1 dataset has 8 sensors that are
placed in 8 different body parts. From the confusion
matrix shown in Figure 3a we could observe that the
Left Calf (LC) and Right Calf (RC) have the highest
detection accuracy among the 8 sensors and the con-
fusion between their place detection is nearly negligi-
ble. The Right Hand (RH) and Left Hand (LH) sen-
sors have some confusion in their place prediction,
but does not have any conflict with any other sen-
sor. The Right Upper Arm (RUA) and the Left Upper
Arm (LUA) have confusion between them only by ac-
curacy of 12.195% and 13.800%, respectively. The
Waist and RUA have a noticeable conflict between
each other by accuracy of 3.579% and 2.826%, re-
spectively.
5.1.2 RealDisp
The RealDisp dataset has 9 sensors in 9 different
places. From the confusion matrix in Figure 3c,
we observe some confusion between sensors loca-
tions. The RUA and Right Leg (RL) both have notice-
able miss-classified cross predictions between each
other by about 6.674% and 6.993% accuracy, respec-
tively. Similarly, we have the Left arm sides LLA and
LUA miss-classified cross-predictions by 6.510% and
6.211%, respectively. The LUA and RUA have miss-
classified cross predictions by 4.197% and 5.628%,
respectively. Nevertheless, the other miss predictions
are surprisingly almost negligible. On the other hand,
for the lower part of the body, we have the Right
Thigh (RT) and the Left Thigh (LT) having predic-
tion confusion by about 6.950% and 7.868%, respec-
tively, while we have the RC and LC confusion by
about 8.038% for RC and 7.249% for LC.
5.1.3 HuGaDB
As we saw in Section 4.1.3 this dataset is mush differ-
ent in the placement of their sensor units, as all of the
6 sensors are located on different places along the two
legs, so we are inspecting how the model could differ-
entiate between places that are very proximal. As we
see in the confusion matrix Figure 3c, we can observe
that RT and LT have some wrong cross predictions
by about 4.997% for the RT and 4.759% for the LT.
Also, for the Right Shin (RS) and Left Shin (LS) they
cross-predict each other by 9.198%, for the RS and
7.414% for the LS. For the Left Foot (LF) and Right
Foot (RF) there is nearly negligible conflict between
them.
5.1.4 MMUSID
The MMUSID dataset is totally different and include
locations for the sensors the other three datasets did
not cover, also it more mimics sensor placement in
real-life(Permatasari et al., 2020) and as we see in
Figure 2d. The sensors are carried mobile phones, in
the left and right pockets (LP and RP), in the Back-
Pack (BP), being hold in the two hands (LH and RH),
and the last one has been in a hand carry bag (HCB).
Those 6 locations are common places to put your
phone in. Therefore, from the confusion matrix in
Figure 3d we can clearly see that because of the dis-
tance found between locations of the sensors there is
nearly no conflict found. However, we can see that
the HCB has a little conflict with the RP by 1.027%.
Also, the RH has little cross conflict with the LH by
1.002%.
5.2 Discussion
From the above results and observations, we can
conclude that in the three datasets EJUST-GINR-1,
Location Determination of On-body Inertial Sensors
697

(a) EJUST-GINR-1 (b)RealDisp
(c) HuGaDB (d) MMUSID
Figure 3: Confusion Matrices.
RealDisp and HuGaDB, there is high degree of con-
fusion between the right and left body parts i.e. LUA
and RUA, LLA and RLA , RS and LS, etc. Similarly,
there is a high degree of confusion between the sen-
sors on the same limb, for instance, the sensors on the
RUA and RLA and LUA and LLA.
Hence, it is apparent one can use the readings from
a sensor mounted on one side of the human body to in-
fer the readings from the opposite side. Also, it shows
that the difference between readings from proximate
body parts are subtle and should not make an issue for
a model trained on data from one of them. However,
the data readings, in the MMUSID, from the right and
left feet are unique, and separate models are required
to for each side.
On the other hand, in the MMUSID dataset, we
found that there is a false prediction in the place of
the HCB sensor with the RP sensor, which indicates
that nearly all the subjects carry their bags in the right
hand which makes the data biased towards the right
handed people only and this may give false predic-
tions in the experiments done on this dataset.
ICINCO 2021 - 18th International Conference on Informatics in Control, Automation and Robotics
698

Table 2: Classification report for Datasets.
Datasets Units Precision Recall F1-Score Accuracy
EJUST-GINER-1
LUA 0.90508 0.91734 0.91117
92.86%
Back 0.96232 0.97432 0.96828
RUA 0.88284 0.88958 0.88620
LC 0.99713 0.97407 0.98547
Waist 0.93180 0.93369 0.93275
RC 0.99869 0.98700 0.99281
LH 0.86200 0.87969 0.87075
RH 0.87805 0.86015 0.86901
RealDisp
RLA 0.86617 0.86994 0.86805
84%
RUA 0.78791 0.83141 0.80907
Back 0.88443 0.88506 0.88475
LUA 0.80887 0.82048 0.81464
LLA 0.88918 0.87701 0.88305
RC 0.82957 0.82937 0.82947
RT 0.84306 0.81188 0.82718
LT 0.82370 0.81449 0.81907
LC 0.84310 0.83337 0.83821
HuGaDB
RF 0.99526 0.98984 0.99304
93.98%
RS 0.88903 0.91019 0.89949
RT 0.93372 0.92804 0.93087
LF 0.98803 0.98938 0.98871
LS 0.90639 0.89236 0.89932
LT 0.92778 0.93029 0.92903
MMUSID
LP 0.99018 0.97882 0.98447
98.49%
RP 0.98244 0.97882 0.98447
HCB 0.98768 0.99175 0.98971
BP 0.98341 0.99213 0.98775
LH 0.98458 0.98139 0.98298
RH 0.98228 0.98837 0.98532
6 CONCLUSIONS AND FUTURE
WORK
In this work, we investigated the problem of detecting
the location of an Inertial Measurement Unit (IMU)
on the human body. The detection of the location
of these devices accurately can have a huge impact
on the accuracy of human activity recognition (HAR)
and person identification. Therefore, we train a Ran-
dom Forest Classifier on four different publicly avail-
able datasets separately and report the accuracy, preci-
sion, recall and F1-score on each one of them. More-
over, we show the confusion between the classifi-
cation of each location and get some important in-
sights. Our model achieved 98.82% accuracy on the
MMUSID dataset which mimic real-life sensor place-
ments, 93.68% accuracy on HuGaDB which incor-
porates 13 activities, 92.85% accuracy on EJUST-
GINR-1 dataset and 83.86% accuracy on ReadlDisp
dataset which incorporate 33 activities. It is important
to notice that we train our model on the raw inertial
data without doing any feature engineering.
In the future, we plan to extend this work to in-
clude sensor location determination from many other
actions. From these we can see how different ac-
tions are dependent on the motion of different body
parts, which can be used, for example, in treatment
assessment for people with motion disabilities. An-
other line of research would be to map the signals
streamed from a given sensor mounted on a specific
place on the body to signals as if they were streamed
from other body parts. This can be considered as a
data augmentation that would extend the size of the
dataset without actually recollecting data using phys-
ical sensors mounted on the target body parts.
ACKNOWLEDGEMENT
This work is funded by the Information Technol-
ogy Industry Development Agency (ITIDA), Infor-
mation Technology Academia Collaboration (ITAC)
Program, Egypt – Grant Number (ARP2020.R29.2
- VCOACH: Virtual Coaching for Indoors and Out-
doors Sporting).
Location Determination of On-body Inertial Sensors
699

REFERENCES
Adel, O., Nafea, Y., Hesham, A., and Gomaa, W. (2020).
Gait-based person identification using multiple iner-
tial sensors.
Banos, O. and T
´
oth, M. A. (2014). Realistic sensor dis-
placement benchmark dataset. Dataset manual, pages
1–4.
Breiman, L. (2001). Random forests machine learning, vol.
45.
Chereshnev, R. and Kert
´
esz-Farkas, A. (2017). Hugadb:
Human gait database for activity recognition from
wearable inertial sensor networks. In International
Conference on Analysis of Images, Social Networks
and Texts, pages 131–141. Springer.
Kunze, K., Lukowicz, P., Junker, H., and Tr
¨
oster, G.
(2005). Where am i: Recognizing on-body posi-
tions of wearable sensors. In International Symposium
on Location-and Context-Awareness, pages 264–275.
Springer.
Permatasari, J., Connie, T., and Song, O. T. (2020). The
mmuisd gait database and performance evaluation
compared to public inertial sensor gait databases. In
Computational Science and Technology, pages 189–
198. Springer.
Primo, A., Phoha, V. V., Kumar, R., and Serwadda, A.
(2014). Context-aware active authentication using
smartphone accelerometer measurements. In Pro-
ceedings of the IEEE conference on computer vision
and pattern recognition workshops, pages 98–105.
Sztyler, T. and Stuckenschmidt, H. (2016). On-body lo-
calization of wearable devices: An investigation of
position-aware activity recognition. In 2016 IEEE In-
ternational Conference on Pervasive Computing and
Communications (PerCom), pages 1–9. IEEE.
Vahdatpour, A., Amini, N., and Sarrafzadeh, M. (2011).
On-body device localization for health and medical
monitoring applications. In 2011 IEEE International
Conference on Pervasive Computing and Communi-
cations (PerCom), pages 37–44. IEEE.
Weenk, D., Van Beijnum, B.-J. F., Baten, C. T., Hermens,
H. J., and Veltink, P. H. (2013). Automatic identifica-
tion of inertial sensor placement on human body seg-
ments during walking. Journal of neuroengineering
and rehabilitation, 10(1):1–9.
ICINCO 2021 - 18th International Conference on Informatics in Control, Automation and Robotics
700
