
Analysis and Application of Multispectral Image Processing Techniques
Applied to Soybean Crops from Drones Vision System
Evelio Gonz
´
alez
1
, Cristhian N
´
u
˜
nez
1
, Jos
´
e Salinas
2
, Jorge Rodas
3
, Mariela Rodas
4
, Enrique Paiva
3
,
Yassine Kali
5
, Maarouf Saad
5
, Fernando Lesme
1
, Jose Lesme
1
, Luis Gonzalez
1
, Belen Maldonado
1
and Jos
´
e Rodr
´
ıguez-Pi
˜
neiro
6
1
Unidad Pedag
´
ogica de Caacup
´
e, Universidad Cat
´
olica Nuestra Se
˜
nora de la Asunci
´
on, Caacup
´
e, Paraguay
2
TECHA, Caacup
´
e, Paraguay
3
Laboratory of Power and Control Systems, Facultad de Ingenier
´
ıa, Universidad Nacional de Asunci
´
on, Luque, Paraguay
4
Instituto Paraguayo de Tecnolog
´
ıa Agraria, Caacup
´
e, Paraguay
5
GR
´
EPCI Laboratory,
´
Ecole de Technologie Sup
´
erieure, Montreal, Canada
6
College of Electronics and Information Engineering, Tongji University, Shangh
´
ai, China
Keywords:
Drones, Multispectral Imaging, Digital Signal Processing, Precision Agriculture.
Abstract:
Drones are important in precision agriculture applications since they represent a new tool that can increase
crop production. In this context, the digital processing of the images obtained from multispectral cameras
integrated into the drones makes it possible to analyze the stress state of the crops, their vigor, a burned area,
among others. The latter are usually obtained through proprietary applications with very high subscription
costs. For this reason, this article presents the step-by-step implementation process of the different methods
or algorithms to be applied to multispectral images using the open-source Python programming language. We
use a soybean crop as an example of the application, and the results obtained from applying the digital image
processing algorithms are presented.
1 INTRODUCTION
Agriculture provides food and raw materials and
employment opportunities to a significant amount
of the population. The agricultural potential of
any country contributes to the process of economic
development through different channels of influence
such as the growth of the farming sector as sustenance
for other sectors of the economy, contributions of
productive factors from the rural sector to other
industries, the assistance of the agricultural industry
to the reduction of poverty, the rural sector as a source
of the domestic market and the agro-export sector as
a source of foreign exchange (Cervantes-Godoy and
Dewbre, 2010).
Agriculture is of paramount importance for the
economic development of several countries and
guarantees the food security of its inhabitants.
However, there is still low penetration of new
technologies in agriculture in most developing
countries, which has repercussions in the lack of
efficiency, productivity, sustainability, optimization
of costs and resources (Puri et al., 2017). In
this context, the use of drones (also known as
unmanned aerial vehicles) as an ally of farmers has
recently appeared and consolidated. The use of
drone technology contributes to multiple processes
in agriculture because it will be possible to capture
important information and evaluate the conditions of
the monitored land and thus detect existing problems,
applying high definition camera technologies and
georeferenced information. for your exact location
(Stehr, 2015). The importance lies in the possibility of
detecting prematurely and efficiently diseases, pests,
and the possible effects that may occur in the future
about climate damage such as frost and droughts
(Patel, 2016).
Digital image processing using a drone’s camera
focuses on the possibility of having a versatile
photogrammetric solution, rapidly deployed in
remote locations and delivering detailed information.
It is possible to obtain an up-to-date photographic
coverage of the growing area of interest using a
high-resolution multispectral digital. The global
positioning systems can georeference the obtained
photographs (or video) and reconstruct a 2D or
3D model using computational tools (Jurado et al.,
2020). To perform the analysis of crops such as
González, E., Núñez, C., Salinas, J., Rodas, J., Rodas, M., Paiva, E., Kali, Y., Saad, M., Lesme, F., Lesme, J., Gonzalez, L., Maldonado, B. and Rodríguez-Piñeiro, J.
Analysis and Application of Multispectral Image Processing Techniques Applied to Soybean Crops from Drones Vision System.
DOI: 10.5220/0010615107070715
In Proceedings of the 18th International Conference on Informatics in Control, Automation and Robotics (ICINCO 2021), pages 707-715
ISBN: 978-989-758-522-7
Copyright
c
2021 by SCITEPRESS – Science and Technology Publications, Lda. All rights reserved
707

the Vegetation Index (VI), water stress (drought),
measure flowering, make an inventory by zones or
plants, identify zones without production, etc. (Shah
et al., 2021).
On the market, there is commercial software
capable of processing multispectral images obtained
by drones. Among the best known and most famous
cases is Pix4Dfields and DJI Terra. The first one
offers the Green Normalized Difference Vegetation
Index (GNDVI), Leaf Chlorophyll Index (LCI),
Modified Chlorophyll Absorption in Reflectance
Index (MCARI), Normalized Difference Red-Edge
(NDRE), Normalized Difference Vegetation Index
(NDVI), and LSIPI2 indices. This software also
allows us to configure any other index as long as it
only requires the red (R), green (G), near-infrared
(NIR), and red-edge (RE) bands of the spectrum.
Another similar software is the DJI Terra, which
offers the NDVI, GNDVI, NDRE, LCI, and OSAVI
indexes. However, both the Pix4Dfields and the DJI
Terra are paid applications under the subscription
model; For the first case, the annual cost at the date
of publication of this article is USD 2,000.00, while
for the second case, the yearly cost of the basic plan
is USD 1,199.00.
We first identify the most popular methods and
algorithms applied to multispectral images obtained
by drones and applied to crops. The main contribution
of this paper is applying step-by-step of the most
relevant algorithms in state of the art (e.g., NDVI or
GNDVI) using an open-source Python programming
language. The rest of the document is divided as
follows. Section 2 introduces the main essential
issues about drones. Section 3 presents the results
obtained by applying the different techniques using
multispectral images obtained from a soybean crop.
The Python codes applied to implement the various
methods are also presented in the same section. The
main conclusions and future work are shown in the
last section.
2 DRONES IN AGRICULTURE
2.1 Drones: Definition, Classification,
and Applications
Drones are reusable aircraft that can maintain
autonomous flight or pilot through the use of radio
control. When referring to the types of drones,
there are several sets of nomenclatures. They are
based on various parameters such as weight, designed
application, level of autonomy, type of operation,
whether civil or military or structural configuration.
The latter encompasses several properties and
topologies that modify these aircraft (Nguyen et al.,
2020; Paiva et al., 2021). Multirotor drones
have several engines that generate thrust using the
propellers and can thus sustain in air. They are aircraft
that provide:
• Better maneuverability.
• Ease of use.
• Increased load capacity.
• Greater comfort for transport due to the
compactness.
On the other hand, the flight ranges are lower and
present difficulties in recovering from engine failure
(Paiva et al., 2018).
The fixed-wing drones use motors for propulsion
and stay thanks to the lift of the winds aloft. These
drones have a wide flight range (especially in linear
flights) and recovery controls in case of failures.
However, for landing and take-off, large areas are
not needed, there are difficulties in maneuvering,
and they are less compact. Finally, hybrid drones
are a combination of fixed-wing and multirotor
configurations, thus inheriting the advantages of both
technologies (Segales et al., 2016). Still, the control
of these drones is quite complex (Kali. et al., 2019;
Paiva et al., 2019a; Gomez et al., 2020; Paiva et al.,
2019b; Kali. et al., 2018; Kali et al., 2018).
According to the classifications expressed above,
these aircraft are ideal for use in different areas of
agriculture. Some examples are the assistance to crop
pollination, automatic precision fumigation. The use
of multispectral imaging by cameras to measure the
analyzed crop is the main focus of this paper.
2.2 Multispectral Images Obtained by
Drones
Most of the drones available in the market typically
have mounted an RGB camera. These types of
cameras mount a sensor that measures the capacity
of light within the visible spectrum. That is, the
spectrum that the human eye is capable of seeing.
With an RGB camera, we will only capture and
interpret colors as we see them. Therefore, we can
only detect problems that are already visible to the
naked eye from an aerial view, such as areas with little
vegetation. There are other ranges of radiation in the
electromagnetic spectrum that go beyond RGB and
are of great importance for precision agriculture. To
see this type of radiation (the human eye is unable to
see them), we need a multispectral sensor (Mogili and
ICINCO 2021 - 18th International Conference on Informatics in Control, Automation and Robotics
708
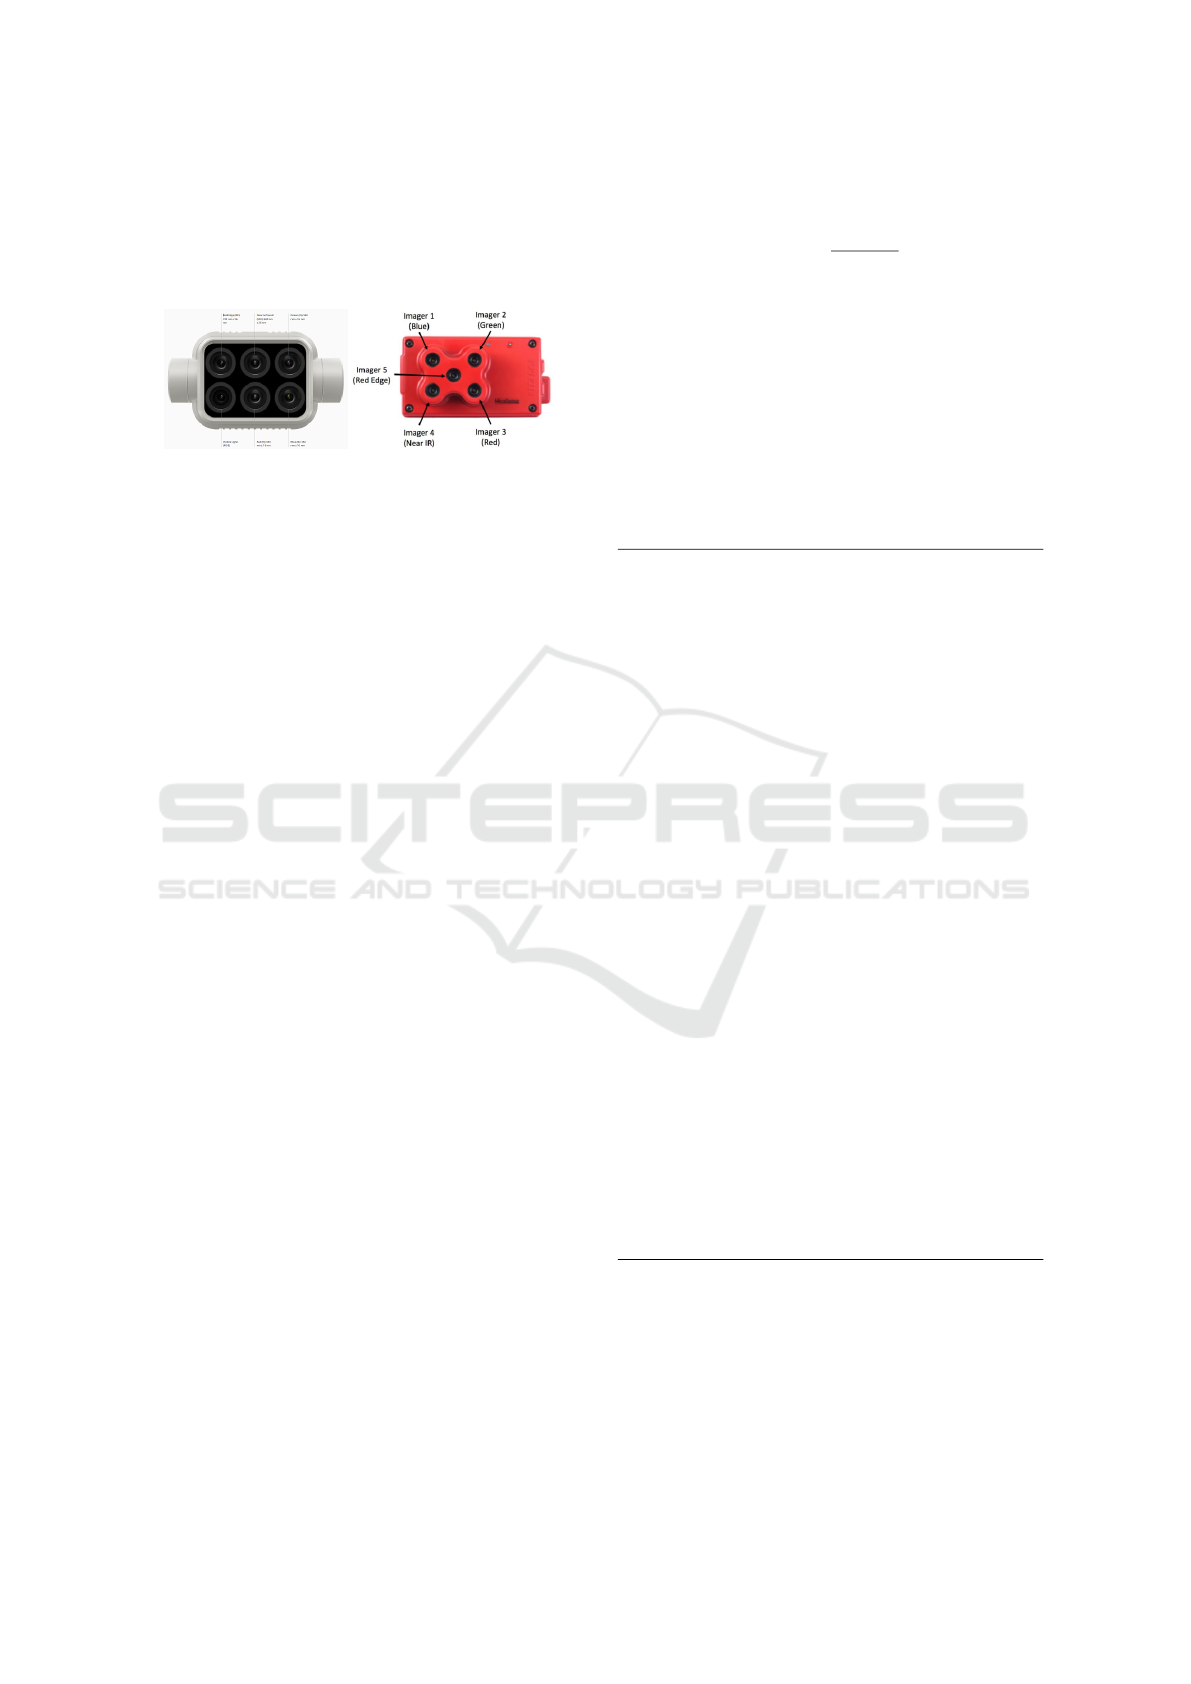
Deepak, 2018). Multispectral cameras have this type
of sensor capable of capturing various spectra of light.
They are small and can take values of up to 6 spectral
bands.
Figure 1: Examples of multispectral cameras.
From the multispectral images captured by this
type of sensor, different VIs can be calculated that
indicate the health and well-being of the vegetation.
These values represent some of the characteristics of
the plants that we analyze in detail in the next section.
3 IMAGING PROCESSING
TECHNIQUES
For this paper, we use a multispectral image of a
soybean crop in Rostock, Germany. Differents VIs is
analyzed for the beforementioned crops by applying
differents digital image processing techniques.
VIs are quantitative measurements based on
reflectance values that tend to measure biomass
or plant vigor. VI is a combination of different
arithmetic operations applied to other spectral bands,
used in a way designed to produce a simple value that
indicates the amount of vigor of vegetation within
a pixel. This makes it possible to estimate and
evaluate the health status of the foliage, based on the
measurement of radiation that plants absorb or reflect.
For instance, chlorophyll, which is the green
pigment in leaves, strongly absorbs visible light for
the photosynthesis process. On the other hand, the
cellular structure of the leaves strongly reflects the
light of the NIR band; the more leaves a plant has,
the more wavelengths of light are affected.
3.1 NDVI
NDVI represents an index that allows you to generate
an image showing greenness (the relative biomass).
This index takes advantage of the contrast between
the characteristics of two electromagnetic bands, the
absorption of chlorophyll pigment in the R band, and
the high reflectivity of plant leaves in the NIR band
(Drisya et al., 2018).
NDV I =
NIR −R
NIR + R
. (1)
This index is the most widely used because its
basic principle relies on that the spongy layers of
leaves reflect a lot of light in the NIR, in stark
contrast to most non-plant objects. When the plant
becomes dehydrated or stressed, the spongy layer
collapses, and the leaves reflect less infrared light
but the same amount in the visible range. The
mathematical combination of these two signals can
help differentiate non-plant plants and healthy plants
from diseased plants. (Esser A, ). The code with the
Python language to obtain NDVI is:
# We start with the import of the modules
# necessary
import rasterio
from rasterio import plot
import matplotlib.pyplot as plt
import numpy as np
import os
# {We read the R band}
imgPath = ’C:/Img/’
red = rasterio.open(imgPath+’IMG_0142_RED.TIF’)
# {We read the NIR band} %leemos la banda NIR
nir = rasterio.open(imgPath+’IMG_0142_NIR.TIF’)
# {We visualize the image}
plot.show(nir)
#{We convert to float}
red = red.read(1).astype(’float64’)
nir = nir.read(1).astype(’float64’)
# {Error handling in the division}
np.seterr(divide=’ignore’, invalid=’ignore’)
# {We calculate NDVI using numpy arrays}
# {Empty cells or cells}
# {no data is reported as zero.}
ndvi = np.where((nir + red) == 0., 0,
(nir - red) / (nir + red))
# {We plot the results with the colors}
#{Red, Yellow and Green}
plt.imshow(ndvi, cmap=’RdYlGn’)
# {We add color palette}
plt.colorbar()
3.2 GNDVI
GNDVI is an index used to estimate photosynthetic
activity estimates and is commonly used to determine
the water and nitrogen consumption of the vegetation
Analysis and Application of Multispectral Image Processing Techniques Applied to Soybean Crops from Drones Vision System
709
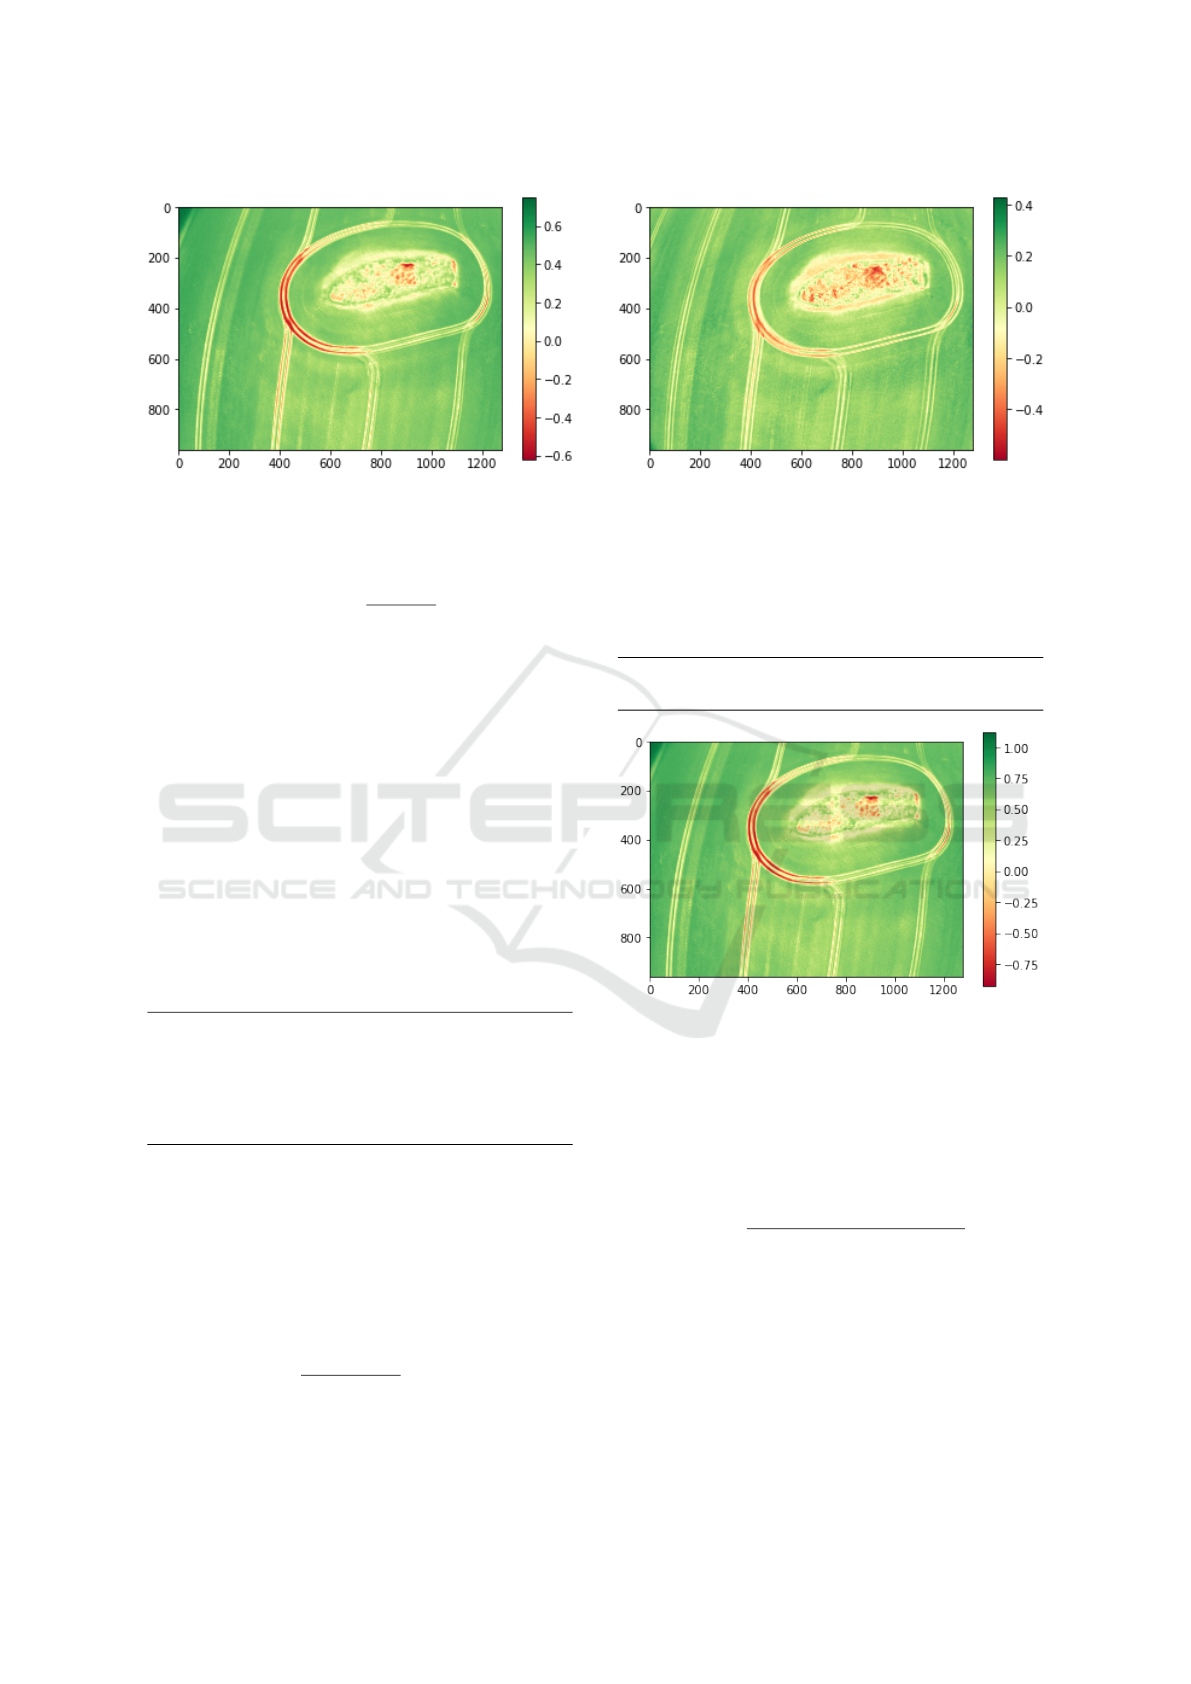
Figure 2: Results obtained when applying the NDVI
technique.
cover (Kross et al., 2015).
GNDV I =
NIR −G
NIR + G
. (2)
It is associated with the green color of the
vegetation (chlorophyll levels). It is one of the
most used to establish water and nitrogen absorption
levels in the foliage of the different crops. Nitrogen
is a primary structural component present in leaves
and is an indicator of plant health, which is why a
deficiency of this nutrient can cause low productivity.
GNDVI is resistant to atmospheric effects since it
has a more excellent range of wavelengths (from 560
nm to 840 nm) than the NDVI (from 650 nm to 840
nm). Moreover, GNDVI is five times more sensitive
to the concentration of chlorophyll-a. This VI avoids
the problem of NDVI saturation at relatively low
chlorophyll concentrations (it saturates, depending
on the species, with amounts as low as 2 µg/cm of
chlorophyll-a).
# Read band G
green = rasterio.open(imgPath+’IMG_0142_GRE.TIF’)
# We compute GNDVI using numpy arrays
gndvi = np.where((nir + green) == 0., 0,
(nir - green) / (nir + green))
3.3 SAVI
Soil Adjusted Vegetation Index (SAVI) is an index
that attempts to minimize the influences of soil
brightness by using a brightness correction factor.
SAVI is regularly using in arid regions where
vegetation cover is low.
SAVI =
NIR −R
NIR + R + L
+ (1 + L). (3)
Equation (3) also contains the parameter L (when
L = 0, SAVI = NDVI). L can take different values
Figure 3: Results obtained when applying the GNDVI
technique.
depending on the amount of vegetation in the area of
interest and vary between -1 and 1. A low value is
used in fields with a high vegetation density; a high
value should be used for fields with little vegetation.
# We coompute SAVI using numpy arrays
savi = ((nir - red) / (nir + red + 0.5)) * (1 + 0.5)
Figure 4: Results obtained when applying the SAVI
technique.
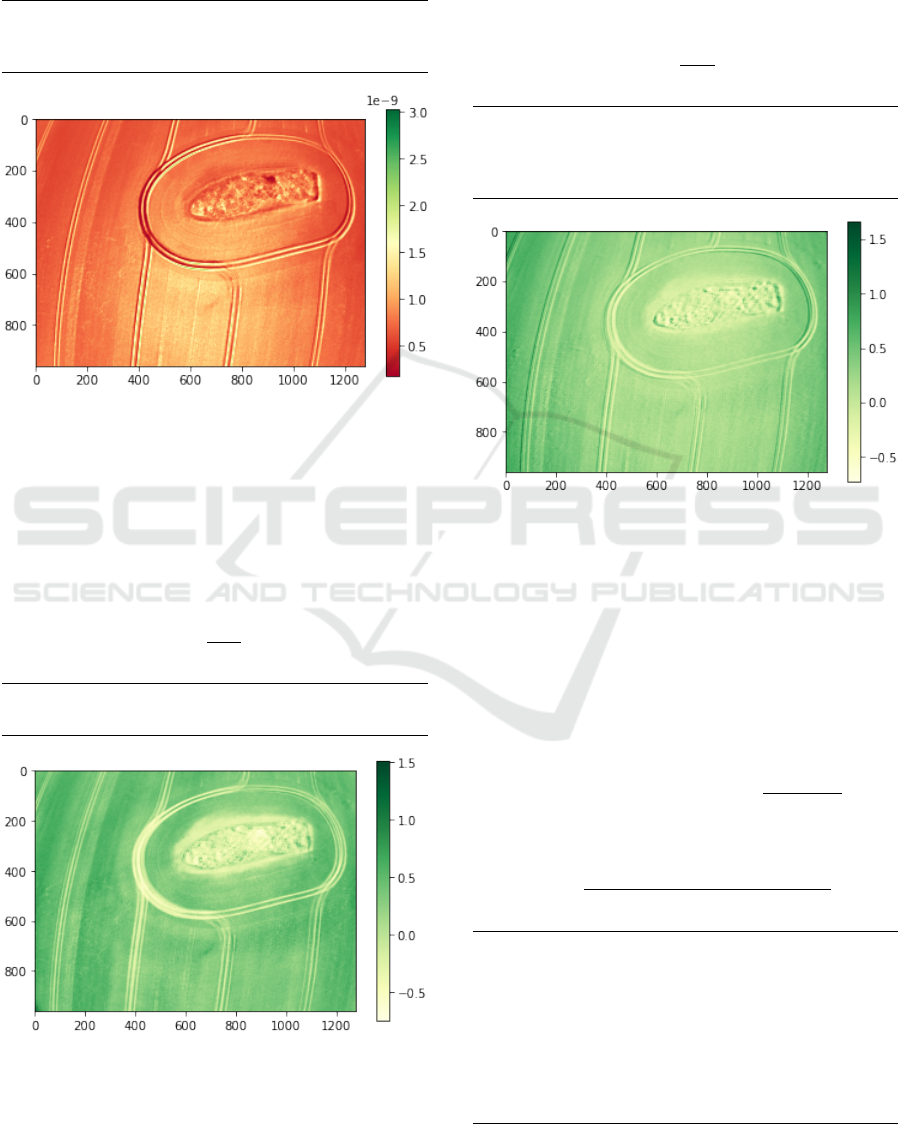
3.4 BAI
Burn Area Index (BAI) uses the reflectance values of
the R and NIR bands of the spectrum to identify the
areas of the ground affected by a fire.
BAI =
1
(0.1 −R)
2
+ (0.06 −NIR)
2
. (4)
BAI constitutes a helpful parameter to
discriminate the area affected by the fire over
other covers. SAVI uses the spectral ranges of
charred materials and ashes produced after a fire,
recognizable by relating the reflectance values of the
R and NIR bands. Then, SAVI is quite helpful for
mapping burned areas, allowing clear discrimination
between burned and unburned, compared to other
ICINCO 2021 - 18th International Conference on Informatics in Control, Automation and Robotics
710
spectral indices such as NDVI, SAVI, and GEMI.
SAVI can be helpful in countries with a dry season
or after the fires that affect agricultural and forestry
crops.
# We compute BAI using numpy arrays
bai = 1 / (np.power((0.1 - red), 2)
+ np.power((0.06 - nir), 2))
Figure 5: Results obtained when applying the BAI
technique.
3.5 CIg
Chlorophyll Index - Green (CIg) is an index that
allows obtaining an estimate of the chlorophyll
content of the leaves from the reflectivity rate in the
NIR and G bands (Broge and Mortensen, 2002).
CIg =
NIR
G
−1. (5)
# We compute CIg using numpy arrays
CIg = (nir / green) - 1
Figure 6:
´
Indice de Clorofila: CIg.
3.6 CIre
Chlorophyll Index - Red-Edge (CIre) is a vegetation
index that makes it possible to estimate the leaves’
chlorophyll content from the reflectivity rate in the
NIR and RE bands.
Clre =
NIR
RE
−1. (6)
# We read RE band
re = rasterio.open(imgPath+’IMG_0142_RE.TIF’)
# We compute CIre using numpy arrays
CIre = ((nir / re) - 1)
Figure 7: Results obtained when applying the CIre
technique.
3.7 GEMI
The Global Environmental Monitoring Index (GEMI)
is a non-linear index for global environmental
monitoring from satellite images. It is similar to
NDVI but is less sensitive to atmospheric effects. It
is affected by the uncultivated land. Therefore, GEMI
is helpful for areas of sparse or moderate vegetation.
GEMI = eta (1 −0.25 eta) −
R −0.125
1 −R
, (7)
being eta:
eta =
2 (NIR
2
–R
2
) + 1.5 NIR + 0.5 R
NIR + R + 0.5
. (8)
nir2 = np.power(nir, 2)
red2 = np.power(red, 2)
# We compute theta
theta = (2 * (nir2 - red2) + 1.5 * nir + 0.5 * red)
/ (nir + red + 0.5)
# We compute GEMI using numpy arrays
gemi = theta * (1 - 0.25 * theta) - ((red - 0.125)
/ (1 - red))
Analysis and Application of Multispectral Image Processing Techniques Applied to Soybean Crops from Drones Vision System
711
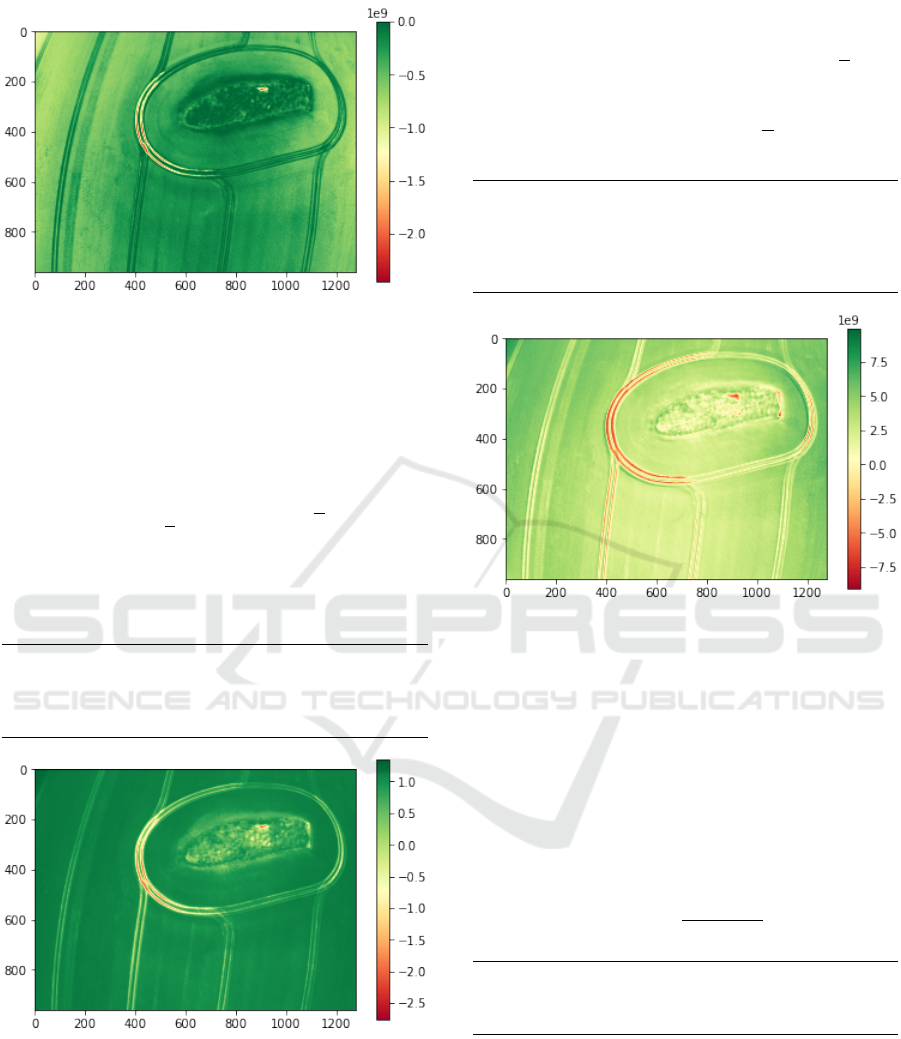
Figure 8: Results obtained when applying the GEMI
technique.
3.8 MSAVI2
Modified Adjusted Soil Vegetation Index 2 (MSAVI2)
is a recursion of the MSAVI index and attempts to
minimize the effect of bare ground on the SAVI.
MSAV I2 =
1
2
[2 (NIR + 1)−
√
θ],
(9)
being θ defined as follows:
θ = (2 NIR + 1)
2
−8 (NIR −R). (10)
# We compute MSAVI2 using numpy arrays
msavi2 = 0.5 * (2 * (nir + 1)
- np.sqrt(np.power((2 * nir + 1), 2)
- 8 * (nir - red)))
Figure 9: Results obtained when applying the MSAVI2
technique.
3.9 MTVI2
Modified Triangular Vegetation Index 2 (MTVI2)
is an index that allows detection of the leaves’
chlorophyll content at the tree canopy scale.
However, it is relatively insensitive to the index of the
area with foliage. It uses reflectance in the G, R, and
NIR bands.
MTV I2 = 1.5[1.2(NIR−G)−2.5(R−G)]
√
θ, (11)
where θ is:
θ = (2NIR +1)
2
−(6 NIR −5
√
R) −0.5. (12)
# We compute MTVI2 using numpy arrays
mtvi2 = (1.5 * (1.2 * (nir - green) - 2.5
* (red - green))
* np.sqrt(np.power((2 * nir + 1), 2)
- (6 * nir - 5 * np.sqrt(red)) - 0.5))
Figure 10: Results obtained when applying the MTVI2
technique.
3.10 NDRE
NDRE is an index used to estimate vegetation health
using the RE band. When evaluating the health of
crops in the middle and late stages of growth, it is
advantageous where the chlorophyll concentration is
relatively higher. Additionally, NDRE can be used to
map nitrogen variability in field leaves to understand
the fertilizer needs of crops better.
NDRE =
NIR −RE
NIR + RE
. (13)
# We compute NDVIre using numpy arrays
ndre = np.where((nir + re) == 0, 0,
(nir - re) / (nir + re))
3.11 NDWI
The Normalized Difference Water Index (NDWI) is
an index that serves to define and monitor changes
in surface water content. It is calculated with the
NIR and G bands. The Normalized Difference Water
Index (NDWI) is an index that defines and monitors
changes in surface water content. Crops suffer from
ICINCO 2021 - 18th International Conference on Informatics in Control, Automation and Robotics
712

Figure 11:
´
Indice de Vegetaci
´
on: NDRE.
severe water stress during times of drought or lack
of irrigation, so this index detects in time the areas
affected by lack of water and prevent negative impacts
on crops. It is also helpful for evaluating the risk
of fire, determining moisture in the vegetation cover.
Higher NDWI values indicate sufficient humidity,
while a low value suggests water stress.
NDW I =
G −NIR
G + NIR
. (14)
# We compute NDWI using numpy arrays
ndwi = np.where((green + nir) == 0, 0,
(green - nir) / (green + nir))
Figure 12: Results obtained when applying the NDWI
technique.
3.12 RTVICore
The Red-Edge Triangulated Vegetation Index - Core
Only (RTVICore) is used to estimate the area index
with foliage and biomass. RTVICore uses NIR, RE,
and G spectral bands.
RTV ICore = [100 (NIR −RE) −10 (NIR −G)].
(15)
# We compute RTVICore using numpy arrays
rtvicore = (100 * (nir - re) - 10 * (nir - green))
Figure 13: Results obtained when applying the RTVICore
technique.
3.13 SRre
Red-Edge Simple Ratio Index (SRre) is a vegetation
index used to estimate healthy and distressed
vegetation. The ratio of light is scattered in the NIR
and RE bands. Then, it reduces the effects of the
atmosphere and topography.
SRre =
NIR
RE
. (16)
# We compute SRre using numpy arrays
srre = nir / re
Figure 14: Results obtained when applying the SRre
technique.
To summarize, Table 1 presents the output of
each technique according to the Calcination Index
(Cal-I), Geological Index (GI), and Chlorophyll Index
(Chl- I). On the other hand, Table 2 shows the
spectral bands used by each index. All the indexes
presented in this paper are the most used in practical
Analysis and Application of Multispectral Image Processing Techniques Applied to Soybean Crops from Drones Vision System
713
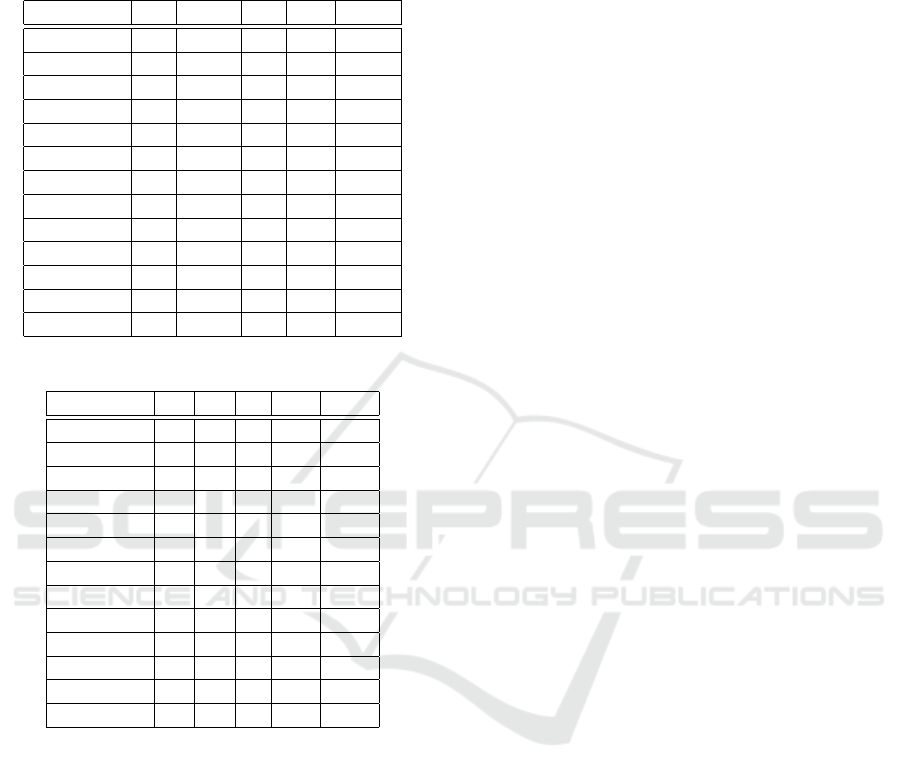
applications. However, the proper VI selection for a
specific crop is beyond the scope of this paper.
Table 1: Result of the algorithms.
Method VI Cal-I GI WI Chl-I
NDVI X x x x x
GNDVI X x x X x
SAVI X x x x x
BAI x X x x x
CIg X x x x X
CIre X x x x X
GEMI X x x x x
MSAVI2 X x x x x
MTVI2 X x x x X
NDRE X x x x x
NDWI x x x X x
RTVICore X x x x x
SRre X x x x x
Table 2: Spectral bands used by each index.
Method R G B RE NIR
NDVI X x x x X
GNDVI x X x x X
SAVI X x x x X
BAI X x x x X
CIg x X x x X
CIre x x x X X
GEMI X x x x X
MSAVI2 X x x x X
MTVI2 X X x x X
NDRE x x x X X
NDWI x X x x X
RTVICore x X x X X
SRre x x x X X
4 CONCLUSIONS
This paper has addressed the use of drones in
agriculture. Different algorithms used by commercial
applications have been analyzed, also incorporating
others. Then we have studied a soybean crop
and applied the different algorithms using an open
programming language. The programming process
for each algorithm has been presented to be applied
directly to readers and the results obtained have
shown their correct operation.
ACKNOWLEDGEMENTS
The authors developed this paper within the
framework of the research project called “Unmanned
aerial vehicles in applications for precision
agriculture for monitoring crops (PINV18-765)”,
co-financed by the Paraguayan National Council of
Science and Technology (CONACYT) with FEEI
resources.
REFERENCES
Broge, N. and Mortensen, J. (2002). Deriving green crop
area index and canopy chlorophyll density of winter
wheat from spectral reflectance data. Remote Sensing
of Environment, 81(1):45–57.
Cervantes-Godoy, D. and Dewbre, J. (2010). Economic
importance of agriculture for poverty reduction.
Drisya, J., D, S. K., and Roshni, T. (2018). Chapter
27 - spatiotemporal variability of soil moisture and
drought estimation using a distributed hydrological
model. In Samui, P., Kim, D., and Ghosh, C., editors,
Integrating Disaster Science and Management, pages
451–460. Elsevier.
Esser A, Ortega R, S. O. Nuevas tecnolog
´
ıas para mejorar
la eficiencia productiva en vi
˜
nas. 1(15):4–9.
Gomez, V., Gomez, N., Rodas, J., Paiva, E., Saad,
M., and Gregor, R. (2020). Pareto optimal PID
tuning for Px4-based unmanned aerial vehicles by
using a multi-objective particle swarm optimization
algorithm. Aerospace, 7(6).
Jurado, J. M., Ortega, L., Cubillas, J. J., and
Feito, F. (2020). Multispectral mapping on 3d
models and multi-temporal monitoring for individual
characterization of olive trees. Remote Sensing,
12(7):1106.
Kali, Y., Rodas, J., Gregor, R., Saad, M., and Benjelloun,
K. (2018). Attitude tracking of a tri-rotor UAV based
on robust sliding mode with time delay estimation. In
2018 International Conference on Unmanned Aircraft
Systems (ICUAS), pages 346–351.
Kali., Y., Rodas., J., Saad., M., Benjelloun., K., Ayala.,
M., and Gregor., R. (2018). Finite-time altitude
and attitude tracking of a tri-rotor UAV using
modified super-twisting second order sliding mode.
In Proceedings of the 15th International Conference
on Informatics in Control, Automation and Robotics
- Volume 1: ICINCO, pages 435–442. INSTICC,
SciTePress.
Kali., Y., Rodas., J., Saad., M., Gregor., R., Alqaisi., W., and
Benjelloun., K. (2019). Robust finite-time position
and attitude tracking of a quadrotor UAV using
super-twisting control algorithm with linear correction
terms. In Proceedings of the 16th International
Conference on Informatics in Control, Automation
and Robotics - Volume 2: ICINCO, pages 221–228.
INSTICC, SciTePress.
ICINCO 2021 - 18th International Conference on Informatics in Control, Automation and Robotics
714

Kross, A., McNairn, H., Lapen, D., Sunohara, M.,
and Champagne, C. (2015). Assessment of
rapideye vegetation indices for estimation of leaf
area index and biomass in corn and soybean crops.
International Journal of Applied Earth Observation
and Geoinformation, 34:235–248.
Mogili, U. R. and Deepak, B. (2018). Review on application
of drone systems in precision agriculture. Procedia
computer science, 133:502–509.
Nguyen, H. T., Quyen, T. V., Nguyen, C. V., Le, A. M.,
Tran, H. T., and Nguyen, M. T. (2020). Control
algorithms for UAVs: a comprehensive survey. EAI
Endorsed Transactions on Industrial Networks and
Intelligent Systems, 7(23).
Paiva, E., Gomez-Redondo, M., Rodas, J., Kali, Y., Saad,
M., Gregor, R., and Fretes, H. (2019a). Cascade
first and second order sliding mode controller of a
quadrotor UAV based on exponential reaching law
and modified super-twisting algorithm. In 2019
Workshop on Research, Education and Development
of Unmanned Aerial Systems (RED UAS), pages
100–105.
Paiva, E., Llano, M., Rodas, J., Gregor, R.,
Rodr
´
ıguez-Pi
˜
neiro, J., and Gomez-Redondo, M.
(2018). Design and implementation of a vtol
flight transition mechanism and development of a
mathematical model for a tilt rotor UAV. In 2018
IEEE International Conference on Automation/XXIII
Congress of the Chilean Association of Automatic
Control (ICA-ACCA), pages 1–6.
Paiva, E., Rodas, J., Kali, Y., Gregor, R., and Saad,
M. (2019b). Robust flight control of a tri-rotor
UAV based on modified super-twisting algorithm. In
2019 International Conference on Unmanned Aircraft
Systems (ICUAS), pages 551–556.
Paiva, E., Rodas, J., Kali, Y., Lesme, F., Lesme,
J. L., and Rodr
´
ıguez-Pi
˜
neiro (2021). A review of
UAVs topologies and control techniques. In 2021
IEEE International Conference on Automation/XXIV
Congress of the Chilean Association of Automatic
Control (ICA-ACCA), pages 1–6.
Patel, P. (2016). Agriculture drones are finally cleared for
takeoff [news]. IEEE Spectrum, 53(11):13–14.
Puri, V., Nayyar, A., and Raja, L. (2017). Agriculture
drones: A modern breakthrough in precision
agriculture. Journal of Statistics and Management
Systems, 20(4):507–518.
Segales, A., Gregor, R., Rodas, J., Gregor, D., and Toledo,
S. (2016). Implementation of a low cost UAV
for photogrammetry measurement applications. In
2016 International Conference on Unmanned Aircraft
Systems (ICUAS), pages 926–932.
Shah, A., Agarwal, R., and Baranidharan, B. (2021).
Crop yield prediction using remote sensing and
meteorological data. In 2021 International
Conference on Artificial Intelligence and Smart
Systems (ICAIS), pages 952–960.
Stehr, N. J. (2015). Drones: The newest technology for
precision agriculture. Natural Sciences Education,
44(1):89–91.
Analysis and Application of Multispectral Image Processing Techniques Applied to Soybean Crops from Drones Vision System
715
