
Changing of Spreading Dynamics for Infectious Diseases in an Aging
Society: A Simulation Case Study on Flu Pandemic
Ting-Yu Lin
1
, Wei Ping Goh
1
, Hung-Jui Chang
2
, Mei-Lien Pan
1
, Shu-Chen Tsai
1
, Da-Wei Wang
1
and
Tsan-Sheng Hsu
1, ∗
1
Institute of Information Science, Academia Sinica, Taiwan
2
Department of Applied Mathematics, Chung Yuan Christian University, Taiwan
{mlpan66, pabeni, wdw, tshsu}@iis.sinica.edu.tw
Keywords:
Agent-based Simulation, Flu Pandemic, Aging Society.
Abstract:
In this paper, we report some initial results obtained from the agent-based simulation system SimTW about the
changing of spreading dynamics, e.g. speed, magnitude and affected people of different ages, when the target
society is aging. A disease model of influenza is built and then is invoked with two different social structures,
e.g., population and household distribution, and working and schooling patterns based on Census 2000 and
Census 2010 of Taiwan. In the 10 years time, the average population age in the country increases from 33.0
to 37.6 while the average household size decreases from 3.19 to 2.94. From the simulation results, we find
that in the more aging year-2010 society, the pandemic, if occurred, is smaller, in terms of the total number of
infected persons and slower in terms of the date of the peak number of daily new cases, but is more serious
both in terms of the numbers of needed hospital beds and death cases. Using this finding, we hope to motivate
further discussions on adapting public health policies to this inevitable global trend of aging.
1 INTRODUCTION
The building of an agent-based simulation on model-
ing the spreading of infectious diseases like influenza
or flu has been reported in order to study their spread-
ing dynamics (Adam, 2020; Tsai et al., 2010). We
observed from the kernel of simulation systems that
vital factors affecting the nature of spreading include
the compositions of people in households, communi-
ties, work groups and schools. In a typical scenario,
virus in an infected person travels through commut-
ing to work places and schools. The virus also has a
better chance of propagating in households of larger
sizes. Motivated by these observations, and the fact
that the world is aging with a growing average popu-
lation age and smaller household size (World Health
Organization, 2020), we want to study and compare
disease spreading patterns between two societies with
different aging populations. We hope to study chang-
ing of spreading patterns and as a result to motivate
better adaptation of public health policies reflecting to
inevitable demographical changes over time. In order
not to deal with parameter aligning across different
∗
Corresponding author.
societies, we choose to carry the study on the same
society, but with a 10-year time-lag. That is, we com-
pare the results between the demography of Taiwan in
the year 2000 and that of the year 2010. We also fo-
cus on flu which one of the most common infectious
diseases (Riley, 2007).
In this paper, we study the spreading patterns be-
tween the two populations in year-2000 and year-
2010 respectively in Taiwan on influenza pandemic
and discuss medical resources requirements if it oc-
curred. We first generate mock populations of year-
2000 and year-2010 based on Taiwan census data in
years 2000 and 2010 (National Statistics, ROC (Tai-
wan), ). Then we use the disease nature history pa-
rameters and system parameters as given in SimTW
(Tsai et al., 2010). We then perform simulations on
the two models and collect the data on daily newly
infected cases. The risk level of people with differ-
ent ages are different for a disease like flu if infected.
Using parameters reported in (Meltzer et al., 1999),
we calculate the total hospital beds needed and the
death toll. From the simulation results, we find that
in the more aging year-2010 society, the pandemic, if
occurred, is smaller, in terms of the total number of
infected persons and slower, in terms of the date of
Lin, T., Goh, W., Chang, H., Pan, M., Tsai, S., Wang, D. and Hsu, T.
Changing of Spreading Dynamics for Infectious Diseases in an Aging Society: A Simulation Case Study on Flu Pandemic.
DOI: 10.5220/0010618204530460
In Proceedings of the 11th International Conference on Simulation and Modeling Methodologies, Technologies and Applications (SIMULTECH 2021), pages 453-460
ISBN: 978-989-758-528-9
Copyright
c
2021 by SCITEPRESS – Science and Technology Publications, Lda. All rights reserved
453
the peak number of daily new cases, but is more seri-
ous both in terms of the numbers of needed hospital
beds and death cases. Using this finding, we hope to
motivate further discussions on adapting public health
policies to this inevitable global trend of aging.
The structure of the rest of this paper is as follows.
In Section 2, we give a survey of related work. In Sec-
tion 3, we describe our data source and the methods
we used. In Section 4, we describe the experimental
results. In Section 5, we give some discussions. Fi-
nally, in Section 6, we give some possible future work
and conclusions.
2 RELATED WORKS
Simulation models has been widely used in many
fields such as epidemiology (Ferguson et al., 2006)
and weather forecast (Furrer and Katz, 2008) as an ef-
fective tool to understanding characteristic of disease
and predicting the future.
The pace of population aging around the world is
increasing dramatically. Taiwan became an aging so-
ciety in 1993, an aged society in 2018 and will be-
come a super aged society in 2025 as projected in
(World Health Organization, 2020; Taiwan, National
Development Council, Executive Yuan, 2020). A dis-
ease has different impacts on different age groups.
For example, the death rate of covid 19 among peo-
ple 70 years older is 100 times more than that of the
age group between 20 and 30 years old (Bialek et al.,
2020; Richardson et al., 2020; Tsay et al., 2020).
There are two main approaches for simulation
work done for epidemiology studies, namely a math-
ematical one and an agent-based one.
Agent-based stochastic simulation is an approach
that widely used for studying infectious diseases
(Germann et al., 2006). This approach can be seen as
a real world environment that has been simplified and
modularized. We can do a lots of experiments that
hard to do in real life and get some useful insights
from the results. For example, (Tsai et al., 2010)
helped government designed intervention methods to
prevent the spread of diseases and (Chang et al., 2015)
study about the impact of household structure on epi-
demiology.
In a mathematical modeling of infectious dis-
ease, the sensitivity analysis is employed to aid in
identifying influential model parameters (Wu et al.,
2013). Many domains which utilize simulation soft-
wares have recognized the importance of validation,
verification, and uncertainty quantification of simula-
tion outcomes to build trust in interpreting generated
results for decision-making processes (Wright et al.,
2020). Relatively few work has been reported on
this regard when agent-based disease simulations are
used(Venkatramanan et al., 2018; Hunter et al., 2018;
Perkins et al., 2019; Hoertel et al., 2020; Ferguson
et al., 2020).
3 MATERIAL AND METHOD
In this section, we first describe our data source. Then
we describe the architecture of the agent-based simu-
lation system called SimTW that we used. Finally, we
give the experimental designs and parameters.
3.1 Data
We briefly describe the difference between the year-
2000 and year-2010 societies. The difference in age
distribution and household size between year-2000
and year-2010 are shown in Table 1 and Figure 1.
The population size of year-2000 is about 22.27 mil-
lion and year-2010 is about 23.16 million. In Fig-
ure 1, the percentage of population below 25 years
old drops about 8.7% from year-2000 to year-2010,
but the above-45-years-old population increases about
10.5%. The average population age of year-2000 is
33.0 years old and year-2010 is 37.6 years old which
means that the whole population in year-2010 is much
older than that of year-2000.
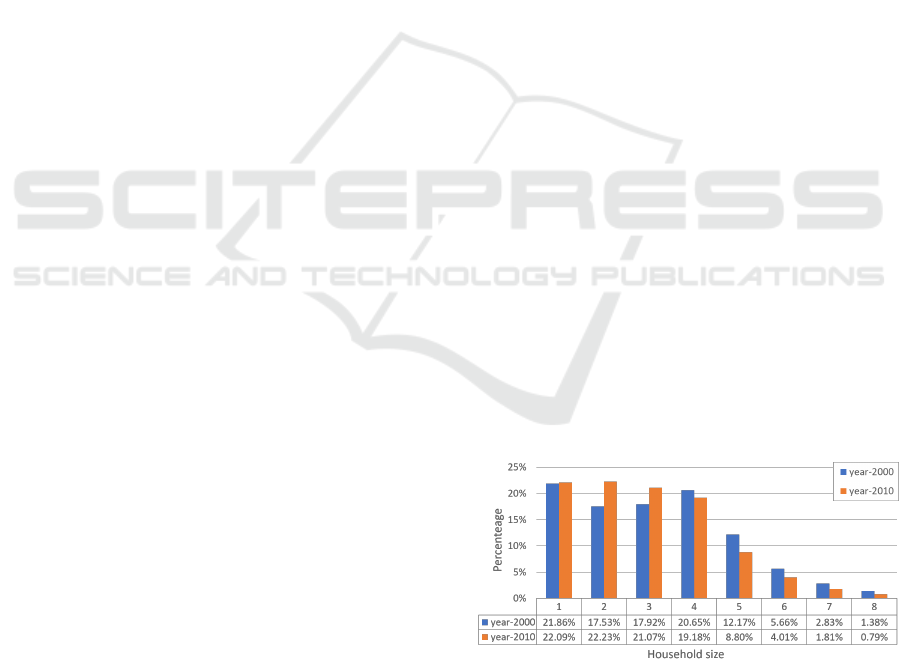
Household structure is one of the important fac-
tors affects the disease transmission network (Chang
et al., 2015). Figure 1 shows the percentages of
household sizes from 1 to 8 member in years 2000 and
2010. The total number of households increases from
6.38 million to 7.85 million and the average drops
from 3.19 to 2.94. The number of households contain-
ing at least 5 members about decreases significantly.
Figure 1: Percentage of household sizes from 1 to 8 member
in year-2000 and year-2010.
3.2 Simulation System
In this paper, we used the simulation software devel-
oped by (Tsai et al., 2010). This software implements
SIMULTECH 2021 - 11th International Conference on Simulation and Modeling Methodologies, Technologies and Applications
454

Table 1: Population distribution of year-2000 and year-2010 in five age groups.
0-4 5-19 20-29 30-64 65+ all
year
2000
number of
people
1,489,242 5,089,214 3,780,665 9,996,243 1,921,308 22,276,672
percentage 6.69% 22.85% 16.97% 44.87% 8.62%
average population
age = 33.03
year
2010
number of
people
964,093 4,268,372 3,473,436 11,968,329 2,487,893 23,162,123
percentage 4.16% 18.43% 15.00% 51.67% 10.74%
average population
age = 37.62
an agent-based stochastic and heterogeneous discrete
time agent-based model.
3.2.1 Mock Population
This software generates a mock population. i.e., the
set of agents, based on the national demographics, and
then build daily commuting pattern, i.e., worker and
student flow, using Taiwan Census Data Year 2000.
Each agent in this system has its own attributes, such
as person ID, age group, gender, routine type, resident
place, work/school place, medical record and so on.
This system uses an approach proposed by (Geard
et al., 2013) to generate a mock population with
household structure. It separates the whole popula-
tion into five age groups, namely preschooler children
(0-4 years old), school-age children (5-18 years old),
young-adults (19-29 years old), adults (30-64 years
old) and elders (65+ years old). People in the same
age group has similar behaviors such as daily activi-
ties and contacts. Routine type is an attribute that de-
scribes an individual’s activities. There are nine types
in the model: household, day-care center, play-group
children, kindergarten student, elementary school stu-
dent, middle school student, high school student, uni-
versity student and workers.
3.2.2 Social Structures
A mixing group is a daily close association of in-
dividuals, where every member is connected to all
other members in the same group. There are twelve
classes of such mixing groups in the model and they
can be divided into three categories: resident areas,
routine areas and surrounding areas. Resident areas
include household, household cluster, day-care cen-
ter and play-group which is the location of the agent’s
home. Routine area is where agents stay for working
and studying which include kindergarten, elementary
school, middle school, high school, university, work
group, dormitory of university and dormitory of work
group. Surrounding area are neighborhood and com-
munity which represented the places providing occa-
sional casual association such as shopping mall and
restaurant around university.
3.2.3 Agent’s Behavior
Each simulation day is set as workday, holiday
or long holiday which is a holiday lasts for more
than 2 days according to the calendar publish by
(Directorate-General of Personnel Administration,
Executive Yuan, ROC (Taiwan), ). Each day is di-
vided into the day time and the night time period
with 12 hours each. Agents go to their routine ar-
eas in the daytime of a workday except non-schooling
preschooler children, dropped out school-age children
and young-adults, adults and elders if unemployed
and non-schooling. During the night time of workday
and the whole day in a holiday, agents who commute
to routine area stay at resident area. Those who stay
in dormitories go to their resident areas only during
long holidays.
3.2.4 Disease Transmission Model
We use the SEIR disease model as described in
(Krumkamp et al., 2011). In this model, each in-
dividual can be in one of the following four states,
susceptible (S), exposed (E), infectious (I), and re-
covered (R). There are two main parameters in the
disease transmission model: contact probability and
transmission probability. Contact probability repre-
sents the chance of an effective contact between two
individuals in the same mixing group. Individuals in
the same age group have the same contact probability
in any given mixing group. The transmission proba-
bility P
trans
is the chance that an effective contact re-
sults in an infection. When a susceptible individual
having an effective contact with an infectious individ-
ual, the susceptible individual becomes exposed with
the probability P
trans
. An exposed individual will later
become infectious and then get recovered according
to the embedded disease natural history.
Changing of Spreading Dynamics for Infectious Diseases in an Aging Society: A Simulation Case Study on Flu Pandemic
455
3.2.5 Disease Natural History Model
The model of flu’s natural history in (Germann et al.,
2006) is used is this system. Latent period refers to
the time between E and I, the individual does not
have any symptoms or signs of infection in this pe-
riod, while the incubation period is the time between
infection and symptom onset (Park and Ryu, 2018).
The time from I to R is called infectious period, in
which the infected individual can infect others. In this
model, the average latent period, incubation period
and infectious period are 1.2 days, 1.9 days and 4.1
days respectively, and there are one-third of asymp-
tomatic infectious individual.
3.3 Experiment Design
In this paper, there are a total of twelve experiments
consisting of six different P
trans
from 0.08 to 0.14
and two different mock populations. All others set-
ting besides P
trans
and mock population are fixed. We
note that P
trans
of a typical seasonal flu is about 0.08
(Fraser et al., 2009; Tsai et al., 2010).
The seeding policy is one index case that ran-
domly picked from the susceptible individuals every
five days (Tsai et al., 2010). The duration of a simula-
tion run is set to be 930 days. No intervention strategy
such as vaccination, school closure or social distanc-
ing policy is involved. We perform 100 runs for each
experiment then we take the average.
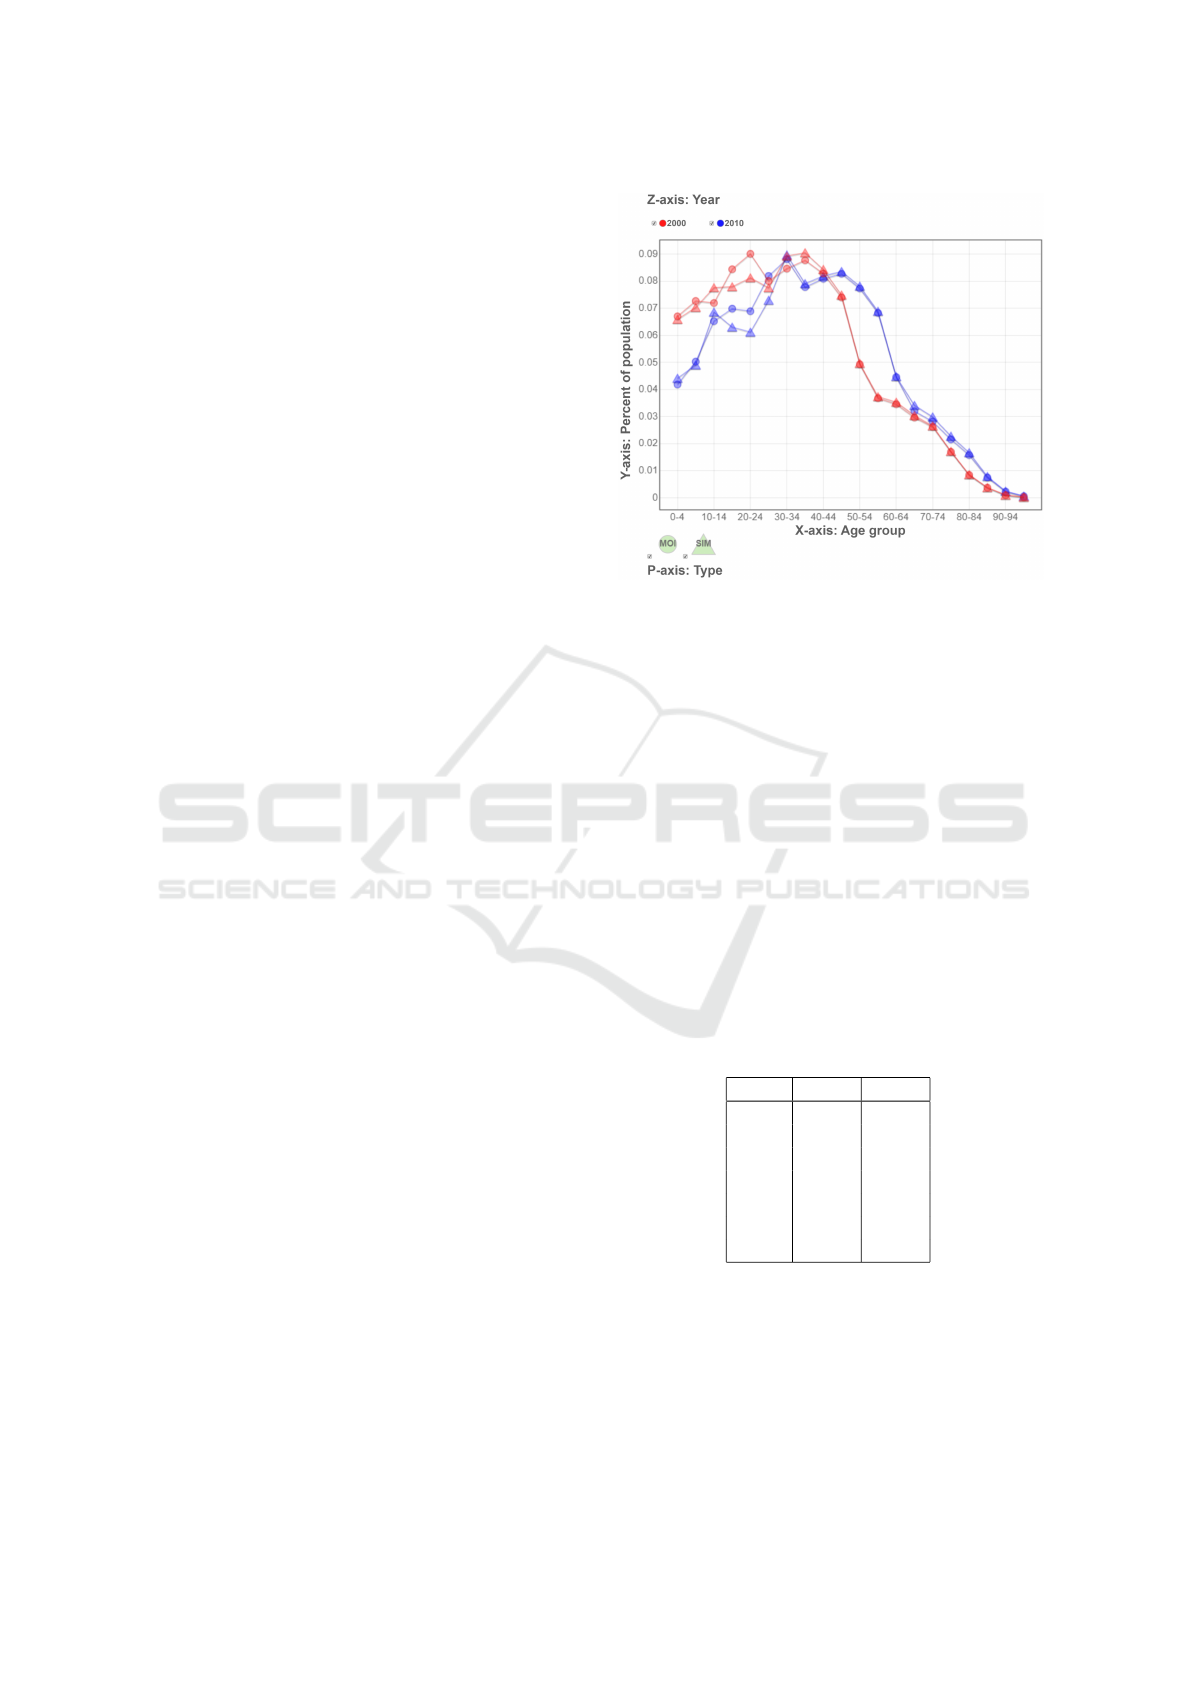
The mock population is then generated randomly
according to the household structure and the popula-
tion of all age groups. We then dump the age distri-
bution of the generated mock population and check
the actual census data from year-2000 and year-2010.
They are highly matched with both correlation coeffi-
cients being greater than 0.99 which is shown in Fig-
ure 2.
The basic reproductive number R
0
is defined as
the expected number of new infections caused by a
typical infected individual in a susceptible population
(Heesterbeek, 2002; Heffernan et al., 2005). We can
determine whether an infectious disease will be a pan-
demic through R
0
. Usually, when R
0
is more than 1,
then it is called a pandemic. R
0
of twelve experiments
mention above are also run by the simulation system
in “R
0
mode”. When running in “R
0
mode”, the sys-
tem generated the same simulation world (included
mock population, mixing groups, flows, agent’s be-
havior and disease transmission model) as “normal
mode”. The only different part is the seeding and the
P
trans
of non-seeded index cases. In “R
0
mode”, the
system will only seed one agent in each run. P
trans
of all non-seeded index cases (cases that infected by
Figure 2: Comparing generated mock population and the
actual census data.
the seeded case) is set become 0 to avoid interference.
When the seeded case recovered from infectious state,
this run of simulation ended and the infected case
number beside the seeded case will be recorded, then
went to the next run. We carry out 10,000 simulation
run and then take the average as the result of R
0
.
The average R
0
of each experiment is calculated
and summarized in Table 2. We chose those P
trans
’s
for experiments because the calculation result of R
0
is similar to the H1N1 pandemic in year 2009 (Fraser
et al., 2009). We note that with the same P
trans
, year-
2000 always have a larger value compared to that
of year-2010. The impact of the household struc-
ture mention in (Chang et al., 2015) may be a reason
because the average household size of year-2010 is
smaller than that of year-2000.
Table 2: Relations between P
trans
and R
0
.
P
trans
2000 2010
0.08 1.121 1.053
0.09 1.251 1.166
0.10 1.374 1.303
0.11 1.504 1.421
0.12 1.647 1.539
0.13 1.771 1.650
0.14 1.902 1.795
4 RESULTS
One of the advantages of using an agent-based simu-
lation is that we can get a finer resolution during the
entire pandemic process, e.g., daily infected cases,
SIMULTECH 2021 - 11th International Conference on Simulation and Modeling Methodologies, Technologies and Applications
456
peak day, peak value and the infected cases in each
age group.
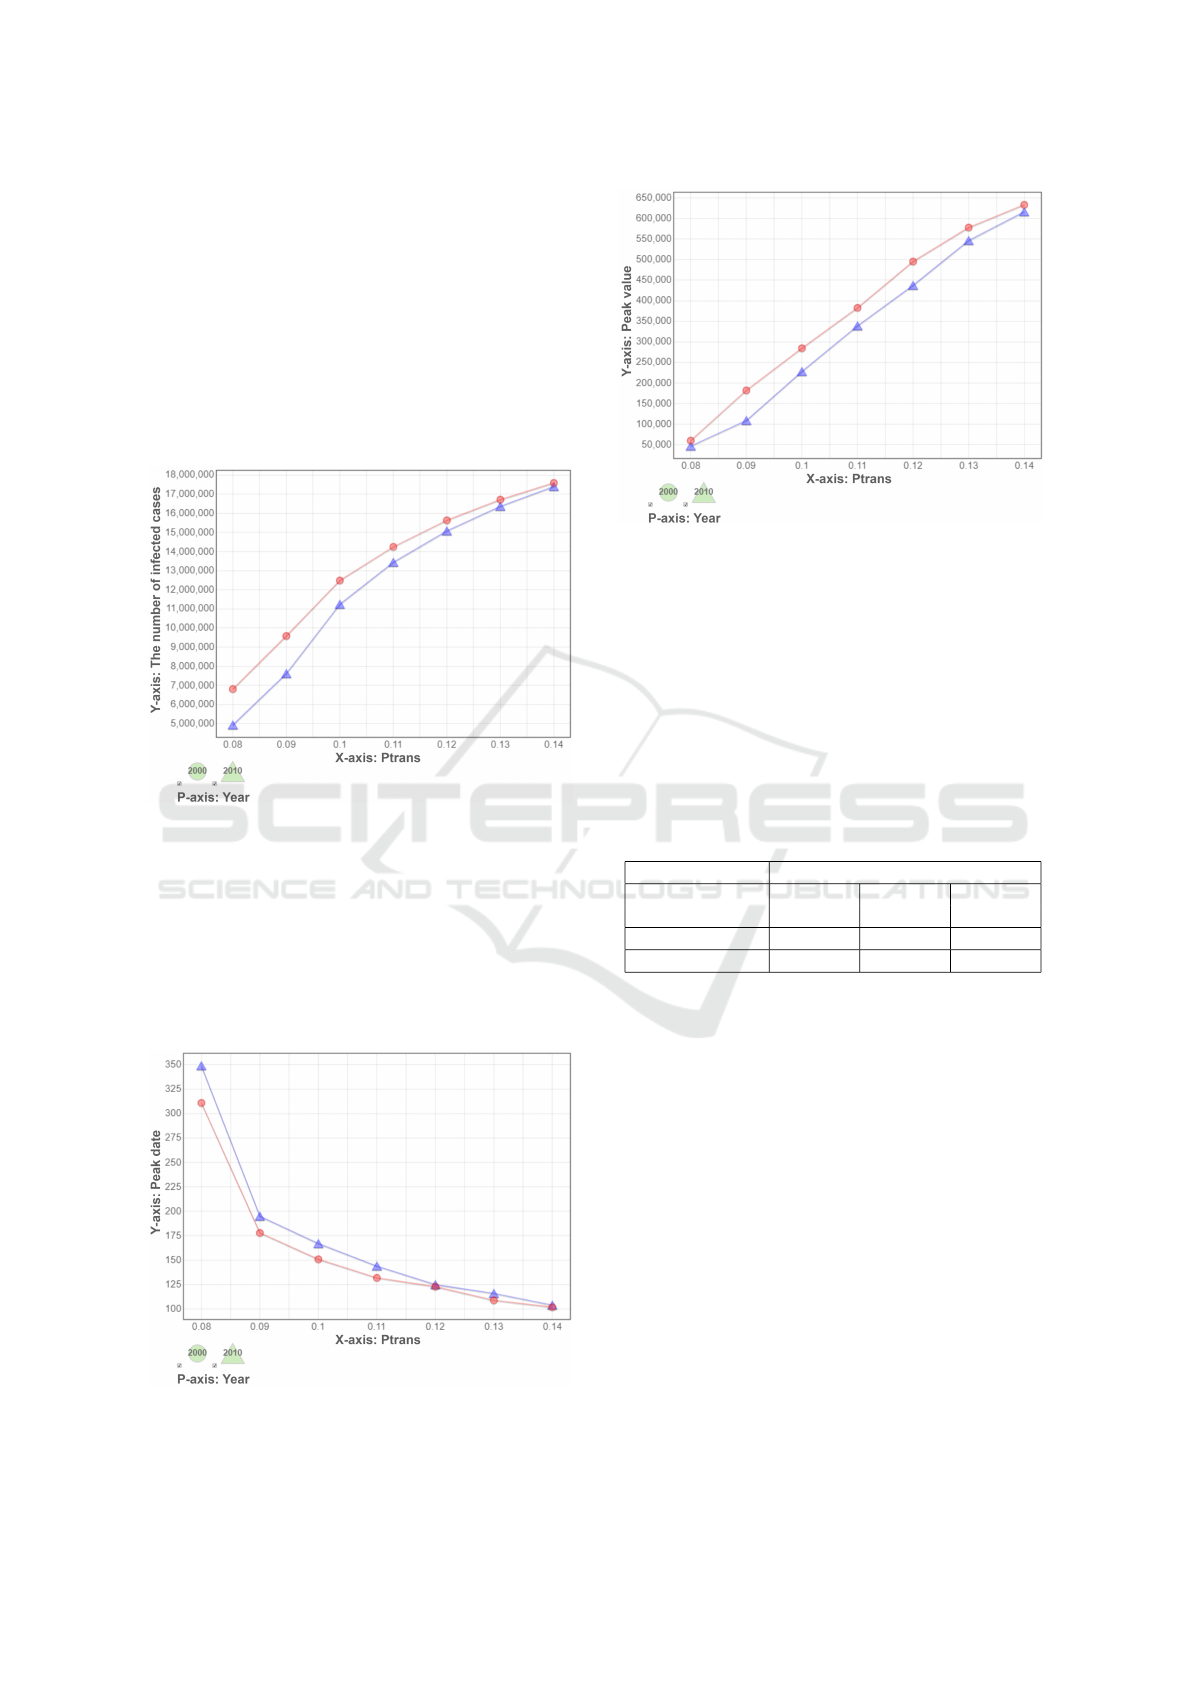
As shown in Figure 3, the number of total in-
fected cases in both years becomes higher as P
trans
goes higher, and year-2000 has a larger number com-
paring to that of year-2010, but the difference gets
smaller when P
trans
increases. This phenomenon is
due to the amount of susceptible individuals is fixed,
it is harder to find a susceptible individual when most
of the population are already in the R state when the
pandemic is almost end.
Figure 3: The total number of infected cases against differ-
ent transmission probabilities (P
trans
).
Figure 4 and Figure 5 show the peak day and peak
value during a pandemic. The peak day of year-2010
is a bit late comparing to year-2000 when P
trans
is
lower than 0.12. There is no significant difference
when P
trans
gets higher. The peak number of daily
new cases of year-2000 society is higher than that of
year-2010.
Figure 4: Peak date of daily newly infected cases.
Figure 5: Peak value of daily newly infected cases.
5 DISCUSSION
We note the following interesting points for discus-
sion. The hospitalization rates of different age groups
are very different. Elders are likely to have a higher
hospitalization rate compared to others. Table 3
shows the hospitalization rates reported by (Meltzer
et al., 1999). We use those data to do a post-process
calculation and find some interesting results.
Table 3: Hospitalization and Death Rates.
Variable Rates per 1,000 cases
0-19 20-64 65+
years old years old years old
Hospitalizations 1.22 7.88 28.83
Deaths 0.87 2.11 12.56
We show the total number of hospitalizations in
Figure 6, and hospitalizations separated by age groups
in Figure 7. In Figure 6, there is an intersection near
the point when P
trans
is 0.10. We can clearly see that
this intersection is mainly caused by the chaning of
the number of infected adults and elders in Figure 7.
Recall that the total infected cases in the year-2000
society is always higher than that of in the year-2010
society using all combinations of parameters. Due
to the differences in hospitalization rates for different
age groups, it causes the number of hospitalizations
of the year-2010 society to overtake the year-2000 so-
ciety.
We further show the number of deaths in Figure 8
and deaths separated by age groups in Figure 9. The
intersection moved a bit forward comparing to the to-
tal hospitalizations.
Figure 10 shows the daily new cases and hospi-
talizations when P
trans
is 0.08. We observe that the
pandemic in year-2000 is faster and the peak is higher
Changing of Spreading Dynamics for Infectious Diseases in an Aging Society: A Simulation Case Study on Flu Pandemic
457
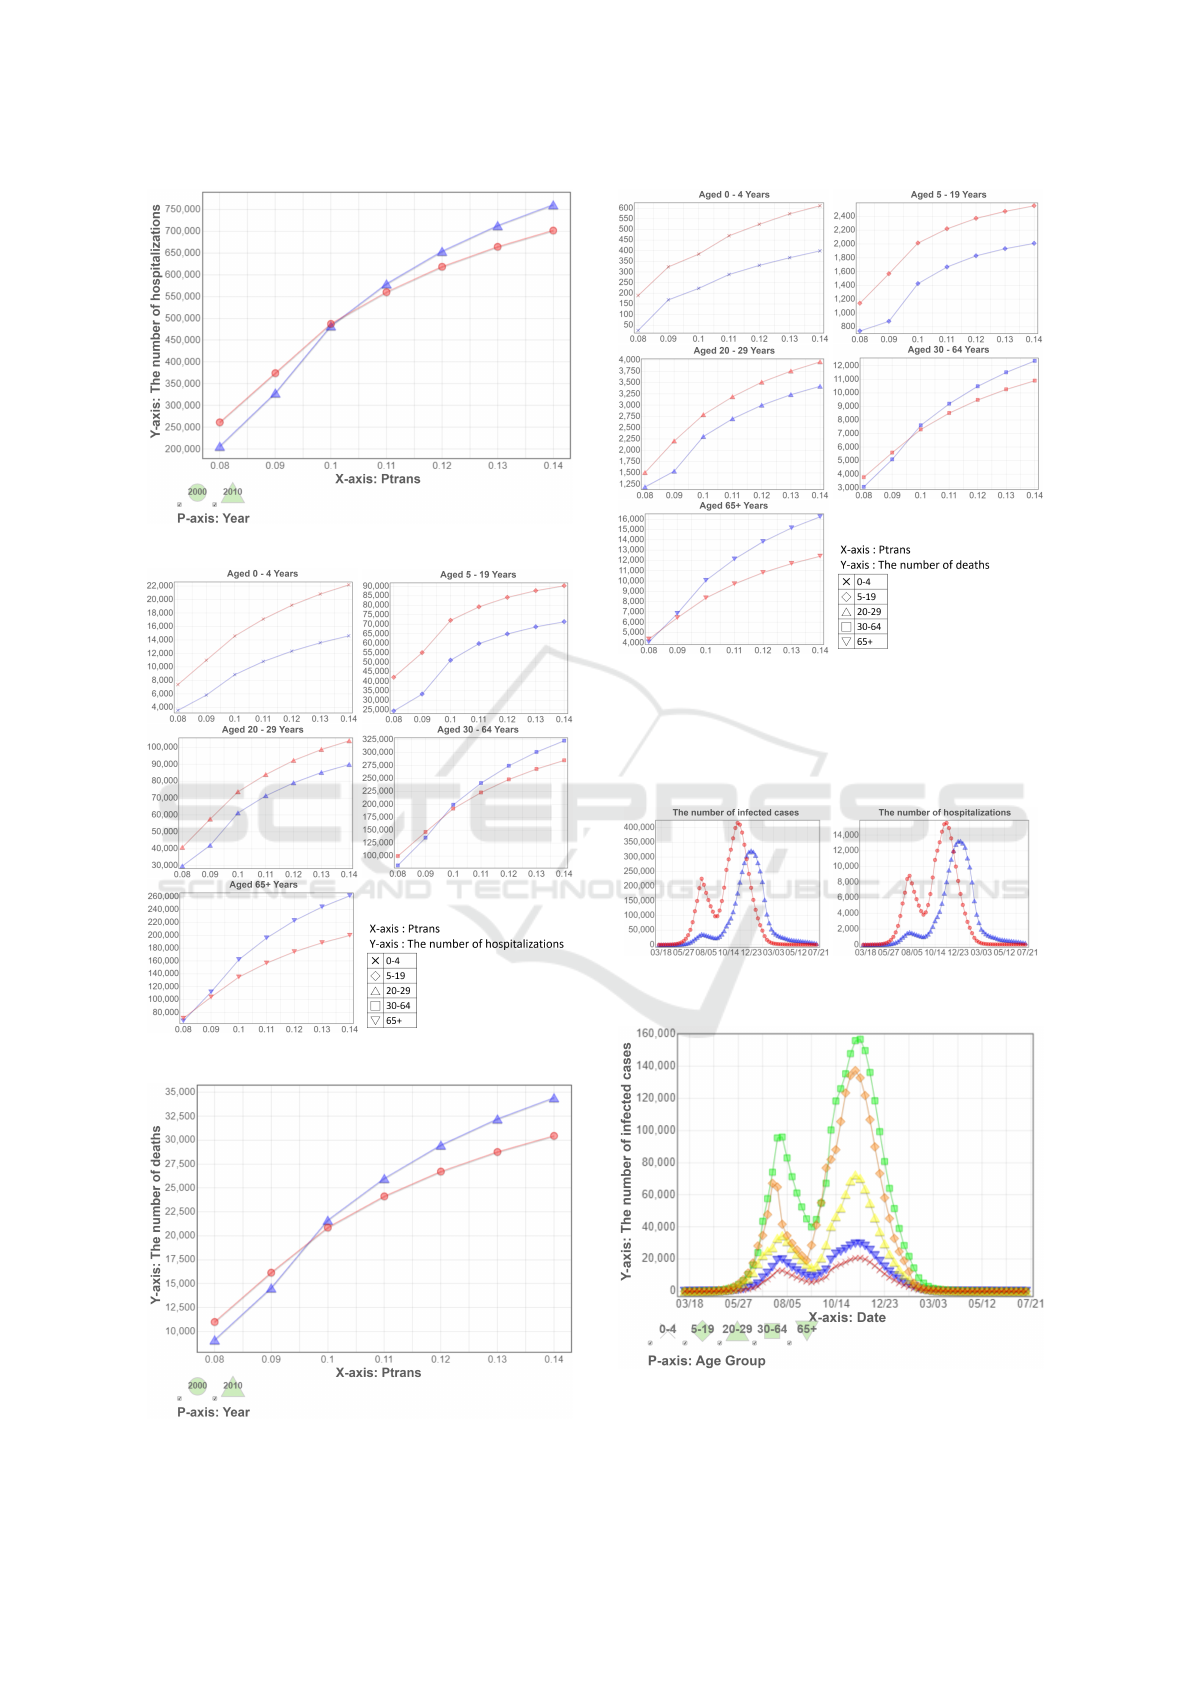
Figure 6: The number of hospitalizations.
Figure 7: The number of hospitalizations by age groups.
Figure 8: The number of deaths.
Figure 9: The number of deaths by age groups.
compare to year-2010 in terms of daily new cases, but
the peak number of hospitalizations is about the same
due to having a higher hospitalization rate for the el-
ders.
Figure 10: The numbers infected cases and hospitalizations
(P
trans
=0.080).
Figure 11: The numbers of infected case by age groups
(P
trans
=0.080, year-2000).
SIMULTECH 2021 - 11th International Conference on Simulation and Modeling Methodologies, Technologies and Applications
458

As observed from Figure 11, there are two peaks
during a pandemic. This phenomenon may be due to
the holiday’s effect during the summer vacation. We
note that the number of infected school-age children
significantly drops during the summer vacation and
rises quickly when the holiday ends.
6 CONCLUSIONS AND FUTURE
WORK
We have reported our simulation results on the chang-
ing of spreading patterns in facing a flu pandemic be-
tween the year 2000 and the year 2010 in Taiwan. In
the 10-year time-lag, Taiwan has shown great signs of
aging. The average population age is up 14% from
33.0 to 37.6 while the average household size is down
8% from 3.19 to 2.94. In facing a flu pandemic, year-
2010 has less total infected cases and later peak date
comparing to year-2000 though the total population
is up 4% from 22.27 million to 23.16 million. How-
ever, due to the fact having more higher risk popula-
tion, e.g., people over the age of 65, higher demands
of hospital beds and a larger death toll are observed
(Meltzer et al., 1999). Though Census 2020 data has
yet to be released, the current preliminary data (Dept.
of Household Registration, Ministry of the Interior,
ROC (Taiwan), ) show the tend of aging to get worse,
namely the average population age is further 11% up
to 41.86 while the household size is plunged another
9% to 2.67. What are seen in this study will get worse.
We hope to motivate some further studies in redesign-
ing public health policies to better taking care of this
trend.
We remark that the approach we used in this pa-
per is useful for studying how disease spreads in Tai-
wan, but it has some limitation. First it is impossible
to simulate every possible spreading ways in the real
world though the validation of this simulation system
on a flu model had done by (Tsai et al., 2010). Sec-
ondly, we only focus on the trend but not the exact
number when we interpret the results.
For future studies, we hope to rerun our experi-
ments when the year 2020 Census data are released.
We also want to study efficacy of different interven-
tion mechanisms, such as mask wearing and vaccine
strategies, in an aging society. Public health policies
designed 20 years ago may not be as effective if used
now.
ACKNOWLEDGEMENTS
We thank Center for Survey Research (SRDA),
RCHSS, Academia Sinica, Taiwan for providing
data of Taiwan Census 2000 and 2010. This
study was supported in part by MOST, Taiwan
Grants 107-2221-E-001-017-MY2, 108-2221-E-001-
011-MY3 and 109-2327-B-010-005, and by Research
Center for Epidemic Prevention - National Yang Ming
Chiao Tung University (RCEP-NYCU).
REFERENCES
Adam, D. (2020). Simulating the pandemic: What covid
forecasters can learn from climate models. Nature,
587(7835):533–534.
Bialek, S., Boundy, E., Bowen, V., Chow, N., Cohn, A.,
Dowling, N., Ellington, S., Gierke, R., Hall, A., Mac-
Neil, J., Patel, P., Peacock, G., Pilishvili, T., Razza-
ghi, H., Reed, N., Ritchey, M., and Sauber-Schatz, E.
(2020). Severe outcomes among patients with coron-
avirus disease 2019 (covid-19) — united states, febru-
ary 12–march 16, 2020. MMWR. Morbidity and Mor-
tality Weekly Report, 69.
Chang, H.-J., Chuang, J.-H., Fu, Y.-C., Hsu, T.-S., Hsueh,
C.-W., Tsai, S.-C., and Wang, D.-W. (2015). The im-
pact of household structures on pandemic influenza
vaccination priority. In SIMULTECH, pages 482–487.
Dept. of Household Registration, Ministry of the Interior,
ROC (Taiwan). https://www.ris.gov.tw/app/en. On-
line; Accessed: 2021 May.
Directorate-General of Personnel Administration, Execu-
tive Yuan, ROC (Taiwan). https://www.dgpa.gov.tw/.
Accessed: 2021-05-21.
Ferguson, N., Laydon, D., Nedjati-Gilani, G., Imai, N.,
Ainslie, K., Baguelin, M., Bhatia, S., Boonyasiri, A.,
Cucunubá, Z. M., Cuomo-Dannenburg, G., Dighe,
A., Dorigatti, I., Fu, H., Gaythorpe, K., Green,
W., Hamlet, A., Hinsley, W., Okell, L., van Els-
land, S., and Ghani, A. (2020). Report 9: Impact
of non-pharmaceutical interventions (npis) to reduce
COVID-19 mortality and healthcare demand. Techni-
cal report, Imperial College London.
Ferguson, N. M., Cummings, D. A., Fraser, C., Cajka,
J. C., Cooley, P. C., and Burke, D. S. (2006). Strate-
gies for mitigating an influenza pandemic. Nature,
442(7101):448–452.
Fraser, C., Donnelly, C. A., Cauchemez, S., Hanage, W. P.,
Van Kerkhove, M. D., Hollingsworth, T. D., Griffin,
J., Baggaley, R. F., Jenkins, H. E., Lyons, E. J., et al.
(2009). Pandemic potential of a strain of influenza
a (h1n1): early findings. science, 324(5934):1557–
1561.
Furrer, E. M. and Katz, R. W. (2008). Improving the sim-
ulation of extreme precipitation events by stochastic
weather generators. Water Resour. Res. 2008, 44.
Geard, N., McCaw, J. M., Dorin, A., Korb, K. B., and
McVernon, J. (2013). Synthetic population dynam-
Changing of Spreading Dynamics for Infectious Diseases in an Aging Society: A Simulation Case Study on Flu Pandemic
459

ics: A model of household demography. Journal of
Artificial Societies and Social Simulation, 16(1):8.
Germann, T. C., Kadau, K., Longini, I. M., and Macken,
C. A. (2006). Mitigation strategies for pandemic in-
fluenza in the united states. Proceedings of the Na-
tional Academy of Sciences, 103(15):5935–5940.
Heesterbeek, J. A. P. (2002). A brief history of r
0
and a recipe for its calculation. Acta biotheoretica,
50(3):189–204.
Heffernan, J. M., Smith, R. J., and Wahl, L. M. (2005). Per-
spectives on the basic reproductive ratio. Journal of
the Royal Society Interface, 2(4):281–293.
Hoertel, N., Blachier, M., Blanco, C., Olfson, M., Massetti,
M., Rico, M., Limosin, F., and Leleu, H. (2020). A
stochastic agent-based model of the sars-cov-2 epi-
demic in france. Nature Medicine, 26:1–5.
Hunter, E., Mac Namee, B., and Kelleher, J. (2018). An
open-data-driven agent-based model to simulate in-
fectious disease outbreaks. PLOS ONE, 13(12):1–35.
Krumkamp, R., Kretzschmar, M., Rudge, J., Ahmad, A.,
Hanvoravongchai, P., Westenhöfer, J., Stein, M., Put-
thasri, W., and Coker, R. (2011). Health service re-
source needs for pandemic influenza in developing
countries: a linked transmission dynamics, interven-
tions and resource demand model. Epidemiology &
Infection, 139(1):59–67.
Meltzer, M. I., Cox, N. J., and Fukuda, K. (1999). The
economic impact of pandemic influenza in the united
states: priorities for intervention. Emerging infectious
diseases, 5(5):659.
National Statistics, ROC (Taiwan). Directorate General of
Budget, Accounting and Statistics (DGBAS) of Exec-
utive Yuan. https://eng.stat.gov.tw/. Online; Accessed:
2021 May.
Park, J.-E. and Ryu, Y. (2018). Transmissibility and severity
of influenza virus by subtype. Infection, Genetics and
Evolution, 65:288–292.
Perkins, T. A., Reiner, Jr., R. C., España, G., ten Bosch,
Q. A., Verma, A., Liebman, K. A., Paz-Soldan,
V. A., Elder, J. P., Morrison, A. C., Stoddard, S. T.,
Kitron, U., Vazquez-Prokopec, G. M., Scott, T. W.,
and Smith, D. L. (2019). An agent-based model
of dengue virus transmission shows how uncertainty
about breakthrough infections influences vaccination
impact projections. PLOS Computational Biology,
15(3):1–32.
Richardson, S., Hirsch, J. S., Narasimhan, M., Crawford,
J. M., McGinn, T., Davidson, K. W., , and the North-
well COVID-19 Research Consortium (2020). Pre-
senting characteristics, comorbidities, and outcomes
among 5700 patients hospitalized with covid-19 in the
new york city area. JAMA, 323(20):2052–2059.
Riley, S. (2007). Large-scale spatial-transmission models
of infectious disease. Science, 316(5829):1298–1301.
Taiwan, National Development Council, Executive Yuan
(2020). Population Projections for ROC (Tai-
wan): 2020 2070. https://pop-proj.ndc.gov.tw/
main_en/dataSearch.aspx?uid=78&pid=78&upn=
8D038F3F06D3982D. Accessed: 2021-05-21.
Tsai, M.-T., Chern, T.-C., Chuang, J.-H., Hsueh, C.-W.,
Kuo, H.-S., Liau, C.-J., Riley, S., Shen, B.-J., Shen,
C.-H., Wang, D.-W., and Hsu, T.-s. (2010). Efficient
simulation of the spatial transmission dynamics of in-
fluenza. PloS one, 5(11):e13292.
Tsay, C., Lejarza, F., Stadtherr, M., and Baldea, M. (2020).
Modeling, state estimation, and optimal control for the
us covid-19 outbreak. Scientific Reports, 10:10711.
Venkatramanan, S., Lewis, B., Chen, J., Higdon, D., Vul-
likanti, A., and Marathe, M. (2018). Using data-driven
agent-based models for forecasting emerging infec-
tious diseases. Epidemics, 22:43–49. The RAPIDD
Ebola Forecasting Challenge.
World Health Organization (2020). Decade of healthy
ageing (2021-2030). https://www.who.int/initiatives/
decade-of-healthy-ageing. Accessed: 2021-05-21.
Wright, D. W., Richardson, R. A., Edeling, W., Lakhlili,
J., Sinclair, R. C., Jancauskas, V., Suleimenova, D.,
Bosak, B., Kulczewski, M., Piontek, T., Kopta, P.,
Chirca, I., Arabnejad, H., Luk, O. O., Hoenen, O.,
Weglarz, J., Crommelin, D., Groen, D., and Coveney,
P. V. (2020). Building confidence in simulation: Ap-
plications of easyvvuq. Advanced Theory and Simu-
lations, 3(8):1900246.
Wu, J., Dhingra, R., Gambhir, M., and Remais, J. V.
(2013). Sensitivity analysis of infectious disease mod-
els: methods, advances and their application. Journal
of The Royal Society Interface, 10(86):20121018.
SIMULTECH 2021 - 11th International Conference on Simulation and Modeling Methodologies, Technologies and Applications
460
