
A Graph-based Approach at Passage Level to Investigate the
Cohesiveness of Documents
Ghulam Sarwar and Colm O’Riordan
Department of Information Technology, National University of Ireland, Galway, Ireland
Keywords:
Passage-based Document Retrieval, Passage Similarity Graph, Document Cohesion, Inter-passage Similarity,
Weighted Graph, Query Difficulty, Re-ranking.
Abstract:
Approaches involving the representation of documents as a series of passages have been used in the past
to improve the performance of ad-hoc retrieval systems. In this paper, we represent the top returned passages
as a graph with each passage corresponding to a vertex. We connected the vertices (passages) that belongs to
the same document to form a graph. The underlying intuition behind this approach is to identify some measure
of the cohesiveness of the documents. We introduce a graph-based approach at the passage level to calculate
the cohesion score of each document. The scores for both relevant and non-relevant documents are compared,
and we illustrate that the cohesion score differs for relevant and non-relevant. Moreover, we also re-ranked
the documents by applying the cohesion score with a document similarity score to inspect its impact on the
system’s performance.
1 INTRODUCTION
In Information Retrieval (IR), the bag-of-words
model is a commonly adopted approach to model
text documents. Although it considers word occur-
rences and their frequency, it often neglects the se-
mantic and structural aspects of the document. Find-
ing the relevant information for a user’s query is a
difficult task due to the fact that contextual informa-
tion may be spread across the document. Researchers
have suggested approaches that utilize passage-based
evidence to improve the document ranking (Callan,
1994; Sarwar et al., 2017; Liu and Croft, 2002;
Bendersky and Kurland, 2008a; Kaszkiel and Zobel,
2001). The intuition behind these approaches is to
present a document to the user that might contain
passages that answer the user’s query. One prob-
lem with these approaches is that since the amount
of text is small and mostly comes from long docu-
ments, it is common to lose the context and the re-
lationship between passages (of documents), which
could potentially be used as evidence for re-ranking.
In this case, a graph is a useful construct that can
be used to model the relationship between the text
and help us understand the structural and seman-
tic information more effectively. Graphs have been
used in the past for both ad hoc retrieval as well
as for passage-based retrieval (Blanco and Lioma,
2012; Rousseau and Vazirgiannis, 2013; Li and Chen,
2010). In IR, different inter-document similarity mea-
sures (Kurland and Lee, 2010; Benedetti et al., 2019;
Krikon et al., 2010; Aryal et al., 2019) were pre-
sented which are fundamentally based on the con-
cept of cluster hypothesis(Kurland, 2014)(Voorhees,
1985). In the cluster hypothesis: “documents in the
same cluster behave similarly with respect to rele-
vance to information needs”(Blair, 1979). Though
inter-document similarities are useful, due to the oc-
currences of irrelevant snippets (passages) in a rele-
vant document, it could affect the evaluation of simi-
larity measure(Sheetrit et al., 2018). Therefore, rather
than using the relevant document with irrelevant snip-
pets, passages can be utilized (Callan, 1994; Keikha
et al., 2014). We present a novel graph-based ap-
proach that employs cohesion as a graph measure to
understand how passages are linked to each other by
using the inter-passage similarities. Our approach
correlates with the cluster hypothesis as we aim to
check whether the relevant documents and passages
are connected closely to each other (hence more co-
hesive) than the non-relevant documents. One way
to measure cohesion is to look at the term distribu-
tion (Renoust et al., 2013; Vechtomova and Karamuf-
tuoglu, 2008) or different clusters they form at doc-
ument level or passage level (Kandylas et al., 2008;
P
´
erez and Pagola, 2010). In our approach, we repre-
sent each document as a set of passages or pseudo-
Sarwar, G. and O’Riordan, C.
A Graph-based Approach at Passage Level to Investigate the Cohesiveness of Documents.
DOI: 10.5220/0010619101150123
In Proceedings of the 10th International Conference on Data Science, Technology and Applications (DATA 2021), pages 115-123
ISBN: 978-989-758-521-0
Copyright
c
2021 by SCITEPRESS – Science and Technology Publications, Lda. All rights reserved
115

documents i.e., d
0
= {p
1
, p
2
,. .. p
n
} and use this rep-
resentation to generate a weighted graph. We adopt
this approach due to its flexibility in terms of defining
the strength of edges within the graph. In this way,
we can use the same graph but define the relationship
between the nodes in several ways.
Consider a graph G(V,E) where each vertex v
i
∈
V represents a passage p
i
. An edge e
i, j
∈ E represents
a similarity (or several measures of similarity) be-
tween vertices i and j. The strength of an edge is rep-
resented by a weight w between the p
i
and p
j
. In this
paper, we denote this edge weight w as: sim(p
i
, p
j
),
which is the score of the default weighting scheme
in Lucene
1
(a combination of Vector Space Model
with extra boost and Boolean Model (Lashkari et al.,
2009)). We define cohesion as a property of a doc-
ument that captures the topic shift within the differ-
ent sections of it. In other words, if a document has
several parts (i.e., passages) and the topic discussed
in them is similar, then this document is more cohe-
sive. We hypothesize that for a given query q, the
inter-connectivity (vertices connected to each other
that belongs to the same document) of passages as-
sociated with d
i
∈ R should be different to those as-
sociated with d
i
/∈ R, where R is the set of relevant
documents against q in the relevance judgment file.
Similarly, NR is the set of documents not relevant to
the query.
We aim to check if there is a noticeable difference
between R and NR for each query by utilizing the
graph properties at passage level. We speculate that
the cohesiveness of a document is an effective mea-
sure to improve document ranking by boosting the
relevant documents that might end up further down in
the ranking but that are more cohesive than other non-
relevant ones which are higher in ranking (Bendersky
and Kurland, 2008b). Moreover, the cohesiveness of
the document may also be a useful measure to capture
and represent for the users.
The primary focus of our work is to measure if
there is a noticeable difference between the cohesion
scores of documents in the set R and in the set NR.
Moreover, if this is true, can the cohesion score be uti-
lized to improve the performance in ad hoc retrieval?
In this paper, we employed a graph-based approach at
passage level and introduced a way to measure the co-
hesion (score) of each document. This cohesion score
is used as a unit to measure document relevance and
perform re-ranking.
The paper is structured as follows: Section 2
presents a short overview of previous work in passage
extraction and the passage level retrieval by using
graphs. Section 3 gives an overview of the method-
1
https://lucene.apache.org/core/3 5 0/scoring.html
ology employed, outlining the details on graph build-
ing, cohesion score generation, approaches utilized to
divide passages from the documents, and the assump-
tions taken for the experimental setup on different test
collections. Section 4 reports the experimental results
obtained. Finally, in Section 5, we provide a summary
of the main conclusions and outline future work.
2 RELATED WORK
In this Section, we will highlight the key work that has
been done in the past concerning passage extraction
and its application to the graph-based models.
2.1 Passage Extraction
Passage level retrieval has been used in the past for
many purposes. Callan et al. and Sarwar et al.
(Callan, 1994; Sarwar et al., 2017) have used passage
level evidence to improve the document level rank-
ing. Similarly, Jong and Buckley (Jong et al., 2015)
followed the same concept and considered other al-
ternative passage evidence, such as passage score, the
summation of passage score, and evaluation functions
score etc. to retrieve the documents more effectively.
Yulianti et al. (Yulianti et al., 2018) presented a pas-
sage based re-ranking approach for ad hoc retrieval.
They exploited an external specialised source and
combined it with the conventional passage retrieval
model(Bendersky and Kurland, 2008b) to enhance the
relevance estimate between the document and pas-
sage. Recently, Qingyao et al. (Ai et al., 2018) intro-
duced neural-net based models that use the evidence
given from the passages for the document retrieval
and QA tasks. Similarly, Approaches like learning
to rank(Liu, 2009; Sheetrit et al., 2020) and contex-
tual embeddings (Dai and Callan, 2020; Nogueira and
Cho, 2019; Mitra and Craswell, 2019) are also be-
coming popular to re-rank the documents by using
passage retrieval. To identify the passage boundaries,
several techniques are used like structure-based (via
some textual identifier e.g., < p >, /n etc), window-
based (using word count) or topic-based approaches,
etc. Callan (Callan, 1994) proposed the bounded pas-
sages and overlapping window-based approach. Sim-
ilarly, in text-titling, usage of arbitrary passages and
the language modelling approach was also considered
(Hearst, 1997)(Liu and Croft, 2002). Overlapped and
non-overlapped window-based approaches are most
commonly used to extract passages (Callan, 1994;
Zobel et al., 1995).
DATA 2021 - 10th International Conference on Data Science, Technology and Applications
116

2.2 Graph based Passage Retrieval
Previously, graphs have been used to represent text
for ad-hoc information retrieval tasks (Blanco and Li-
oma, 2012; Thammasut and Sornil, 2006). The for-
mulation of the weighting schemes to rank documents
and summarize text by using graphs has also been
studied in recent years (Blanco and Lioma, 2012;
Rousseau and Vazirgiannis, 2013; Erkan and Radev,
2004; Tan et al., 2017). Graph-based approaches like
PageRank (Page et al., 1999) and HIT S (Kleinberg,
1999) have been widely employed for ranking the
top web pages, analysis of social networks, as well
as for ad-hoc document retrieval (Kurland and Lee,
2010; Kurland and Lee, 2006) purposes. For pas-
sage retrieval, Li et al. (Li and Chen, 2010) pro-
posed a graph-based ranking model that measures the
relationship between passages and uses it to re-rank
the passage results in Question Answering (QA) task
(Dang et al., 2007). They constructed the graph after
the initial standard retrieval against a query, and then
re-ranked the returned passages based on a similar-
ity of different passages/vertices. Furthermore, Otter-
bacher et al. (Otterbacher et al., 2009) used a varia-
tion of a graph-based ranking model called LexRank
(Erkan and Radev, 2004) to rank a set of sentences
for the generation of a document summary. They
applied this approach in the context of passage re-
trieval for the QA task. They calculated the tf-idf
score of all the sentences in the documents and used
it as an edge score to build a graph. Similarly, Dkaki
(Dkaki et al., 2007) presented a model based on graph
comparison for passage retrieval task. Their graph
model considered the sentence dependencies by fol-
lowing the Hyperlink-Induced Topic Search (HITS)
algorithm (Kleinberg, 1999) or PageRank (Blondel
et al., 2004). However, they did not consider the ex-
plicit links between the documents by using hyper-
links or citations, etc. Instead of using the implicit
inter-document relationship based on the cosine sim-
ilarity, they have utilized the approach the identify
the linkage between units/sentences based on related
terms that are shared among themselves. Although
their model helped in improving the precision of the
system, they highlighted some drawbacks in terms of
the computational complexity of generating their re-
cursive graph.
Recently, Sheetrit et al. tested the cluster hypoth-
esis by using the documents as well as inter-passage
similarities(Sheetrit et al., 2018). They used the near-
est neighbour (k) similar to the approach we used in
this paper to find the most similar passage and doc-
uments. They have shown that the cluster hypoth-
esis not only holds for documents but also for pas-
sage, which supports our motivation to utilize the
inter-passage similarity in a graph space. Later on,
Eilon et al. introduced a clustering-based approach
that also uses inter-passage similarity for focused re-
trieval(Sheetrit and Kurland, 2019). Unlike using the
passages to improve the document ranking (which we
are proposing in this paper), they used Learning to
Rank(Sheetrit et al., 2020) approach to rank the pas-
sages from each document based on their relevance to
the query for passage retrieval task.
Another passage-graph approach was employed
by Bendersky et al. (Bendersky and Kurland, 2008a)
to improve the document ranking. While most work
on passage-based document retrieval ranks a docu-
ment based on the query similarity of its constituent
passages, their approach leveraged information about
the centrality of the document passages concerning
the initial document list. They generated the initial
document list by identifying the top 50 relevant doc-
uments to each query based on the similarity score
sim(q,d). They hypothesized that the passages sim-
ilar to many documents in the initial list contain in-
formation that pertains to the query due to the virtue
by which the list was created. They introduced a one-
way bipartite graph G in which an edge with a non-
zero weight connects document d in the initial list
with the passages that are most similar to d. Once
the graph is generated, they measured the centrality
of a passage by simply adding the edge weights of
all documents that are connected to a respective pas-
sage, or they used the HITS score for each passage.
Their approach outperformed the baseline and other
commonly passage-based approaches like Max pas-
sage and interpolation technique (Callan, 1994; Liu
and Croft, 2002).
Similarly, Krikon et al. (Krikon et al., 2010)
adopted the Bendersky’s graph approach (Bendersky
and Kurland, 2008a) and presented a language-model
that can be used to re-rank the answer set. Their
model considers the inter-passage similarity (central
passage) based on the initial document list and also
evaluates inter-document (central document) for a
given query. By taking only the passages from the ini-
tial list of documents and using it as a bipartite graph,
a relevant passage could be penalized more if an off-
topic document is in a list that could have a relevant
passage pertains to the query. However, by consider-
ing the inter-passage similarity graph (same as used in
this paper), that passage will still be related to other
related passages from the graph and will get a higher
boost and can go up in ranking compared to the bipar-
tite document passage graph approach.
A Graph-based Approach at Passage Level to Investigate the Cohesiveness of Documents
117
3 METHODOLOGY
In this document, we divide the methodology in three
different phases: the graph approach at passage level
and the definition of cohesion, cohesion based simi-
larity functions and the passage level division used to
generate the graphs.
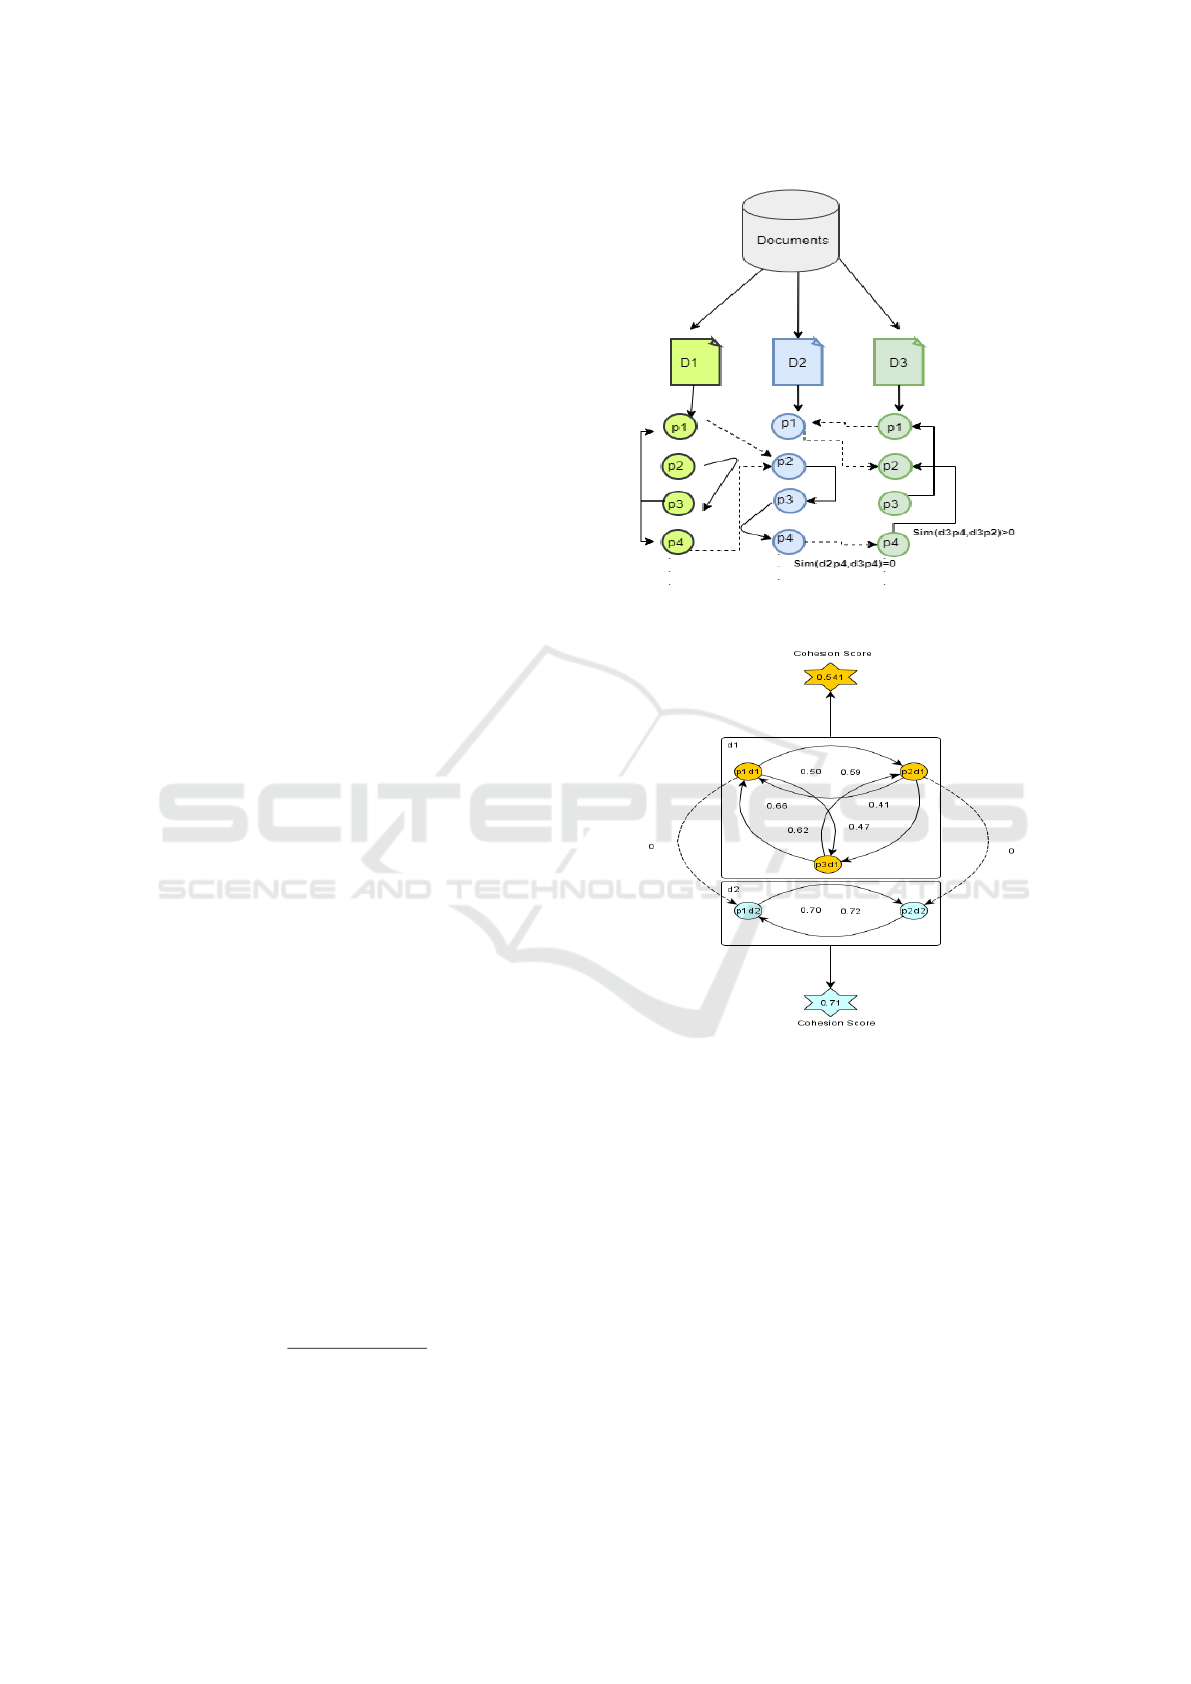
3.1 Graph Approach
In this work, we represent every document as a
set of passages or ‘pseudo-documents’ i.e., d
0
=
{p
1
, p
2
,. .. p
n
}. We use that representation to gener-
ate a weighted directed graph G = (V,E) where each
vertex p
i
represents a passage and E is an edge-weight
function that is based on the similarity between pas-
sage nodes p
i
, p
j
. Figure 1 illustrates a high-level
structure in which different passages from each docu-
ment are connected to other passages. Below we de-
scribe our approach to use that graph model for cal-
culating the cohesion score.
3.1.1 Cohesion Score
To measure the cohesion score of each document, we
consider the following two parameters.
• Inter-connectivity of each passage i.e., passages
connected to each other from the same docu-
ment. For example, as shown in Figure 1, p1
from the document D1 is linked to p3 (denoted
with plain arrow), and p2 from the document
D2 (denoted with dotted arrow). To measure the
inter-connectivity for p1 we only consider its con-
nection to the passages that belong to D1 i.e.,
p2, p3, p4.
• Strength of edges between them i.e., the similarity
score between each passage to the other which is
denoted as sim(p
i
, p
j
) in Figure 1. In Section 3.D,
we will explain how the similarity is computed for
the passages in the graph.
Let’s assume that every vertex is connected to k neigh-
bouring vertices, N is the total number of passages
(from the same document), p
j
i
corresponds to the pas-
sage j from the document i and n
j
i
is a neighbouring
node (inter-connected passages) for passage j in the
graph from the same document d
i
. C(d
i
) denotes the
value of the cohesiveness of document i. We use the
following equation to calculate the cohesion score.
C(d
i
) =
∑
∀p
ji
sim(p
ji
,n
ji
)
N(N − 1)
| n
ji
∈ d
i
(1)
In this formula, we not only consider the inter-
connectivity of passages but also take their posi-
tions/rank into account by adding the similarity score
Figure 1: High Level Graph of Passages Nodes at Docu-
ment Level.
Figure 2: Cohesion Graph of two documents.
of the neighbour’s nodes that belong to the same doc-
ument. Therefore, the higher the rank, the higher the
similarity score. Furthermore, by taking the similar-
ity score into account, we consider the strength of the
vertex/passage with its neighbours. Hence, the pas-
sages in a highly cohesive document will be strongly
connected with each other. If a relevant document is
more cohesive, then the relevant (and cohesive) doc-
uments will be closer to each other as per the clus-
ter hypothesis. Therefore, by boosting the document
score with cohesion could affect the overall document
ranking. Figure 2 illustrate the cohesion score of two
documents d1 and d2. It is to note that the dotted edge
between the nodes of d1 and d2 has a weight of zero,
as in the cohesion graph because to calculate cohe-
DATA 2021 - 10th International Conference on Data Science, Technology and Applications
118

sion, only the nodes from the same documents were
considered.
3.2 Similarity Functions
To boost the ranking of documents, we created
similarity functions based on the cohesion score.
The motivation behind this is to investigate whether
boosting the relevant documents that are more
cohesive could improve performance. The following
is a brief description of cohesion based similarity
functions.
•
{
SF1
}
One way to compute the overall similarity,
osim(d
i
,q) is consider both the similarity score
and the cohesion score of the same document.
osim(d
i
,q) = sim(d
i
,q) ×C(d
i
) (2)
•
{
SF2
}
Instead of using the multiplication, we can
simply add the two values: the cohesion score
with the normal similarity score
osim(d
i
,q) = sim(d
i
,q) +C(d
i
) (3)
•
{
SF3
}
One limitation of SF2 and SF1 is that sim-
ple addition or multiplication may downgrade the
overall similarity score. Because for a given query
q, a highly cohesive document with a low similar-
ity score with q could be from the NR set. As a
result, a boost in rank for this document will re-
duce the performance. Therefore, a better way is
to add only a ratio X (e.g., 10%, 20%, etc.) of co-
hesion score with the document similarity score.
We used X=0.1 to report results as the best results
were produced with this value.
osim(d
i
,q) = sim(d
i
,q) + (C(d
i
) ∗ X) | X = 0.1
(4)
•
{
SF4
}
To compare the performance, we also con-
sidered a Max passage approach (Callan, 1994;
Bendersky and Kurland, 2008b; Sarwar et al.,
2017) that has been commonly used to re-rank the
document based on passage base evidence.
osim(d
i
,q) = Max
p
j
∈d
i
sim(p
j
,q) (5)
3.3 Passage Level Division
In order to subdivide the documents into passages, we
adopted the half overlapping, fixed-length window-
size to index the documents, because in the literature
these passages are found to be more suitable computa-
tionally, easier to use, and have been shown to be very
effective for document retrieval(Callan, 1994; Liu and
Croft, 2002). In this paper, a passage/vertex/node is
defined as a section of a document obtained by ap-
plying the half overlapping fixed-length window size
approach.
The characteristics of the employed test collec-
tions (Webap, Cranfield, and Ohsumed) in our work
is specified in Table 1. Furthermore, only queries that
have relevant documents associated with them were
used to measure the performance.
Table 1: Document Collections.
#Docs #Passages #Queries window
size
WebAp 6399 146000 150 250
words
Cranfield 1400 7722 225 30
words
Ohsumed 233,445 1404440 97 30
words
3.4 Assumptions and Experimental
Parameters
To measure the similarity between passages
sim(p
i
, p
j
) in our graph, we sent each passage
p
i
as a query to SOLR index for their respective
test collection and retrieved the top k results. For
documents that have only one passage, the cohesion
score is not computed and therefore, the score of that
document was not boosted by the cohesion based
similarity functions. Furthermore, to generate graphs,
we choose a different neighbour size k as the average
length of documents varies in all the collections. We
choose k = 30 for the WebAp and k = 10 for the
Ohsumed and the Cranfield collection. On average,
a document contains only 6-7 passages in the small
collections; therefore, we have chosen a smaller
number for the graph neighbour size. Similarly, for
WebAp each document contained between 25-30
passages and therefore we choose a higher number
for WebAp.
4 EXPERIMENTS AND RESULTS
We have two major hypotheses for the experiments:
1. We hypothesized that there is a significant differ-
ence in the cohesiveness scores of R and NR sets
for any given query. Here we wanted to inves-
tigate whether or not the relevant documents are
more cohesive.
A Graph-based Approach at Passage Level to Investigate the Cohesiveness of Documents
119

Table 2: Cohesion Score Statistics for R and NR.
Avg Co-
hesion
for R
Avg Co-
hesion
for NR
T-Val P-Val
WebAp 0.19 0.14 8.74 < 0.05
Cranfield 0.27 0.24 4.23 < 0.05
Ohsumed 0.230 0.242 -2.3 < 0.05
2. If the relevant documents are more cohesive, we
suspect that the cohesion score can be an effective
measure to improve the performance of the sys-
tem.
We divide our discussion of experiments by ex-
plaining the results pertaining to these hypotheses in
the following subsections.
4.1 Cohesion Score for Relevant and
Non-relevant Documents
In this Section, we present the experimental results to
illustrate the difference between R and NR documents
based on their cohesion score. We use (1) to calculate
the cohesion score for each document. Against each
query q, we retrieved all the documents of a given
collection and then calculated the average cohesion
score for R and NR set separately to check if there
is a significant difference between both sets’ cohe-
sion scores for the given test collections. This gives
us a better indication of cohesion for the answer set
against a given query and helps to differentiate the
R and NR set. Figures 3(a), 3(b), and 3(c) illustrate
the average cohesion score of both relevant and non-
relevant sets of each query in the form of a line plot.
As seen in Figures 3(a),3(b), the relevant documents
have shown higher cohesion on average for most of
the queries. For the Ohsumed collection (Figure 3(c)),
NR has slightly better cohesion on average. We posit
this is due to the small size of the documents in this
collection.
As shown in Table 2, at the query level for all test
collections, there was a significant difference between
R and NR documents, which support our first hypoth-
esis that there is a significant difference between both
sets. For the WebAp, and the Cranfield, relevant doc-
uments were found to be more cohesive and vice versa
for the Ohsumed. As the length of each document in
Ohsumed is small and the corpus size is larger, the co-
hesion graph doesn’t provide much evidence to differ-
entiate the R and NR set and gave better cohesion in-
dication for the collections that were bigger in length
(webAP, etc.). We used two-tailed Student t-test at
a confidence level of 95% to determine the statistical
significance.
(a) Cranfield Collection
(b) WebAp Collection
(c) Ohsumed Collection
Figure 3: Cohesion Score at Query Level for Relevant and
Non Relevant Documents.
DATA 2021 - 10th International Conference on Data Science, Technology and Applications
120

Table 3: Comparison of Similarity Functions and Baseline.
Cranfield WebAP Ohsumed
MRR P@5 p@10 MRR P@5 p@10 MRR P@5 p@10
BaseLine 0.75 40.0 27.8 0.97 95.0 93.8 0.49 30.7 28.3
SF1 0.46 22.2 16.7 0.72 73.2 77.6 0.30 18.5 16.4
SF2 0.74 34.0 23.4 0.93 89.5 87.5 0.40 24.9 21.7
SF3 0.77 40.2 28.0 0.97 95.3 93.8 0.48 30.9 27.4
SF4 0.70 36.2 25.5 0.96 94.9 92.0 0.48 31.5 29.5
Figure 4: MAP@100 of Similarity Functions for all Test
Collections.
4.2 Effects of Cohesion Score on the
Document Ranking
In the previous section, we explored how the average
cohesion for each query differs in different test collec-
tions. Taking our hypothesis further, in this Section,
we will discuss the impact of the cohesion score in the
ranking function on the performance of the system.
Figure 4 illustrates the comparison of Mean Average
Precision of different similarity functions (SF1, SF2,
SF3, and SF4) against the baseline (Vector Space
Model). For the WebAP and the Cranfield collec-
tion, the MAP for the SF3 is slightly better than the
baseline. This supports our hypothesis that if relevant
documents are more cohesive, a certain boost based
on the cohesion score can improve the performance.
Moreover, as the NR documents have slightly higher
cohesion for the Ohsumed collection; therefore, the
SF3 and all other similarity functions reduced the per-
formance of the system, which is expected. We also
used precision at the top 5 and 10 documents (p@5
and p@10), as well as the Mean Reciprocal Rank
of the first relevant document (MRR) assess the dif-
ferent re-ranking methods for the top results (Shah
and Croft, 2004). Table 3 shows that for the WebAP,
and Cranfield, SF3 outperforms the baseline as well
as the Max passage approach (SF4). For Ohsumed,
the baseline gives overall better results. However, for
p@5, SF3 performed better, reflecting that for some
queries, the relevant documents had a higher cohesion
(spikes shows in Figure 3(c)). Consequently, it helped
in improving the top rank documents. The best per-
forming results were highlighted in bold in Table 3.
Moreover, we performed a comparison of the Av-
erage Precision on a query by query basis for the
baseline and the SF3 for the top 100 results to check
whether the increase or decrease in performance is
distributed across all queries or the boosting penal-
ized some queries significantly. We took the 20 worst
performing queries (difficult queries), and the top 20
best performing queries (easy queries) to compare the
performance. For the Cranfield and WebAP, we see
a stronger correlation between the cohesion score and
the average precision. For nearly all the difficult the
AP was improved and for easy queries, where the co-
hesion of R was higher than the NR set, the perfor-
mance surpassed the baseline, which supports our in-
tuition of boosting the difficult queries with the cohe-
sion score. Though the average number of passages
per document is similar in Cranfield and Ohsumed (6-
7 passages), the variation in size of both collections is
huge. Therefore, for a large size collection with the
small graph size k = 10 it is hard to get the correct
contextual notion of the document, which can be one
the reason for the low MAP for SF3 for the Ohsumed
collection. Increasing the graph size for Ohsumed
may cover more contextual notion in the graph, but
it would require extra computation.
5 CONCLUSION AND FUTURE
WORK
In this paper, the main emphasis of the work was to
explore the difference between R and NR documents
concerning their cohesion scores. The results show
that the cohesion score we introduced in this paper
can be a useful measure. Moreover, we calculated the
average cohesion scores of R and NR sets at a query
level. The experiment showed there is a statistically
significant difference between both sets, and that the
A Graph-based Approach at Passage Level to Investigate the Cohesiveness of Documents
121

relevant documents are more cohesive for all test col-
lections except the Ohsumed. Moreover, we also ex-
plored the use of the cohesion score to re-rank docu-
ments. For two collections (WebAp, Cranfield), there
was a slight increase in MAP when SF3 was applied,
and the same behaviour was seen for MRR, P@5, and
P@10. Lastly, we also investigated the behaviour of
easy and difficult queries against all test collections
and noticed that the cohesion score helped in improv-
ing the performance for the worst functioning queries
more than the easy queries. Only for the Ohsumed
collection, the difficult queries were damaged more,
which was because the NR set had a higher cohesion
score than the R set.
For future work, we would like to use differ-
ent similarity measures (entity-based, semantic rela-
tion, topic modelling etc.) other than just weighting
schemes based on term occurrence to calculate the
edge score between passage nodes and see how the
results change. As we have seen from our study that
relevant documents are tend to be more cohesive, we
plan to extend our graph approach for Query Perfor-
mance Prediction (QPP) task. By examining a graph
created from passages in the answer set, we can use
features of this graph to help improve the answer set
of the user and identify query difficulty. Moreover,
we intend to further investigate the usage of cohesive
documents for the pseudo-feedback and query expan-
sion area. Due to the computational constraints of
graph generation, we used reasonably medium size
collections to test our hypothesis and approach. As
we noticed that our hypothesis proved better for test
collections that were larger in document length (We-
bAp) compared to small length collections (Cranfield,
Ohsumed). We also aim to employ larger collections,
such as GOV2, ROBUST04, and ACQUAINT etc. to
see if there are any deviations with the outcome.
REFERENCES
Ai, Q., O’Connor, B., and Croft, W. B. (2018). A neu-
ral passage model for ad-hoc document retrieval. In
European Conference on Information Retrieval, pages
537–543. Springer.
Aryal, S., Ting, K. M., Washio, T., and Haffari, G. (2019).
A new simple and effective measure for bag-of-
word inter-document similarity measurement. CoRR,
abs/1902.03402.
Bendersky, M. and Kurland, O. (2008a). Re-ranking search
results using document-passage graphs. In Proceed-
ings of the 31st annual international ACM SIGIR con-
ference on Research and development in information
retrieval, pages 853–854. ACM.
Bendersky, M. and Kurland, O. (2008b). Utilizing passage-
based language models for document retrieval. In Eu-
ropean Conference on Information Retrieval, pages
162–174. Springer.
Benedetti, F., Beneventano, D., Bergamaschi, S., and Si-
monini, G. (2019). Computing inter-document simi-
larity with context semantic analysis. Information Sys-
tems, 80:136–147.
Blair, D. C. (1979). Information retrieval, 2nd ed. c.j. van ri-
jsbergen. london: Butterworths. Journal of the Amer-
ican Society for Information Science.
Blanco, R. and Lioma, C. (2012). Graph-based term
weighting for information retrieval. Information re-
trieval, 15(1):54–92.
Blondel, V. D., Gajardo, A., Heymans, M., Senellart, P.,
and Van Dooren, P. (2004). A measure of similarity
between graph vertices: Applications to synonym ex-
traction and web searching. SIAM review, 46(4):647–
666.
Callan, J. P. (1994). Passage-level evidence in document
retrieval. In Proceedings of the 17th annual interna-
tional ACM SIGIR conference on Research and de-
velopment in information retrieval, pages 302–310.
Springer-Verlag New York, Inc.
Dai, Z. and Callan, J. (2020). Context-aware passage term
weighting for first stage retrieval. In Proceedings of
the 43rd international ACM SIGIR conference on Re-
search and development in information retrieval, Vir-
tual Event, China, July 25-30, 2020.
Dang, H. T., Kelly, D., and Lin, J. J. (2007). Overview of the
trec 2007 question answering track. In Trec, volume 7,
page 63.
Dkaki, T., Mothe, J., and Truong, Q. D. (2007). Pas-
sage retrieval using graph vertices comparison. In
2007 Third International IEEE Conference on Signal-
Image Technologies and Internet-Based System, pages
71–76. IEEE.
Erkan, G. and Radev, D. R. (2004). Lexrank: Graph-based
lexical centrality as salience in text summarization.
Journal of Artificial Intelligence Research, 22:457–
479.
Hearst, M. A. (1997). Texttiling: Segmenting text into
multi-paragraph subtopic passages. Computational
linguistics, 23(1):33–64.
Jong, M., Ri, C., Choe, H., and Hwang, C. (2015). A
method of passage-based document retrieval in ques-
tion answering system. CoRR, abs/1512.05437.
Kandylas, V., Upham, S. P., and Ungar, L. H. (2008).
Finding cohesive clusters for analyzing knowledge
communities. Knowledge and Information Systems,
17(3):335–354.
Kaszkiel, M. and Zobel, J. (2001). Effective ranking with
arbitrary passages. Journal of the American Society
for Information Science and Technology, 52(4):344–
364.
Keikha, M., Park, J. H., Croft, W. B., and Sanderson, M.
(2014). Retrieving passages and finding answers.
In Proceedings of the 2014 Australasian Document
Computing Symposium, page 81. ACM.
Kleinberg, J. M. (1999). Authoritative sources in a hy-
DATA 2021 - 10th International Conference on Data Science, Technology and Applications
122

perlinked environment. Journal of the ACM (JACM),
46(5):604–632.
Krikon, E., Kurland, O., and Bendersky, M. (2010). Utiliz-
ing inter-passage and inter-document similarities for
reranking search results. ACM Transactions on Infor-
mation Systems (TOIS), 29(1):3.
Kurland, O. (2014). The cluster hypothesis in information
retrieval. In European Conference on Information Re-
trieval, pages 823–826. Springer.
Kurland, O. and Lee, L. (2006). Respect my authority! hits
without hyperlinks, utilizing cluster-based language
models. In Proceedings of the 29th annual interna-
tional ACM SIGIR conference on Research and devel-
opment in information retrieval, pages 83–90.
Kurland, O. and Lee, L. (2010). Pagerank without hyper-
links: Structural reranking using links induced by lan-
guage models. ACM Transactions on Information Sys-
tems (TOIS), 28(4):1–38.
Lashkari, A. H., Mahdavi, F., and Ghomi, V. (2009). A
boolean model in information retrieval for search en-
gines. In Information Management and Engineering,
2009. ICIME’09. International Conference on, pages
385–389. IEEE.
Li, X. and Chen, E. (2010). Graph-based answer passage
ranking for question answering. In Computational In-
telligence and Security (CIS), 2010 International Con-
ference on, pages 634–638. IEEE.
Liu, T.-Y. (2009). Learning to rank for information retrieval.
Found. Trends Inf. Retr., 3(3):225–331.
Liu, X. and Croft, W. B. (2002). Passage retrieval based on
language models. In Proceedings of the eleventh in-
ternational conference on Information and knowledge
management, pages 375–382. ACM.
Mitra, B. and Craswell, N. (2019). An updated duet model
for passage re-ranking. CoRR, abs/1903.07666.
Nogueira, R. and Cho, K. (2019). Passage re-ranking with
BERT. CoRR, abs/1901.04085.
Otterbacher, J., Erkan, G., and Radev, D. R. (2009). Bi-
ased lexrank: Passage retrieval using random walks
with question-based priors. Information Processing &
Management, 45(1):42–54.
Page, L., Brin, S., Motwani, R., and Winograd, T. (1999).
The pagerank citation ranking: Bringing order to the
web. Technical report, Stanford InfoLab.
P
´
erez, R. A. and Pagola, J. E. M. (2010). An incremental
text segmentation by clustering cohesion. HaCDAIS
2010, page 65.
Renoust, B., Melanc¸on, G., and Viaud, M.-L. (2013). Mea-
suring group cohesion in document collections. In
Proceedings of the 2013 IEEE/WIC/ACM Interna-
tional Joint Conferences on Web Intelligence (WI)
and Intelligent Agent Technologies (IAT)-Volume 01,
pages 373–380. IEEE Computer Society.
Rousseau, F. and Vazirgiannis, M. (2013). Graph-of-word
and tw-idf: new approach to ad hoc ir. In Proceed-
ings of the 22nd ACM international conference on In-
formation & Knowledge Management, pages 59–68.
ACM.
Sarwar, G., O’Riordan, C., and Newell, J. (2017). Passage
level evidence for effective document level retrieval.
In Proceedings of the 9th International Joint Confer-
ence on Knowledge Discovery, Knowledge Engineer-
ing and Knowledge Management, pages 83–90.
Shah, C. and Croft, W. B. (2004). Evaluating high ac-
curacy retrieval techniques. In Proceedings of the
27th annual international ACM SIGIR conference on
Research and development in information retrieval,
pages 2–9.
Sheetrit, E. and Kurland, O. (2019). Cluster-based fo-
cused retrieval. In Proceedings of the 28th ACM Inter-
national Conference on Information and Knowledge
Management, pages 2305–2308.
Sheetrit, E., Shtok, A., and Kurland, O. (2020). A passage-
based approach to learning to rank documents. Infor-
mation Retrieval Journal, 23(2):159–186.
Sheetrit, E., Shtok, A., Kurland, O., and Shprincis, I.
(2018). Testing the cluster hypothesis with focused
and graded relevance judgments. In The 41st Interna-
tional ACM SIGIR Conference on Research & Devel-
opment in Information Retrieval, pages 1173–1176.
Tan, J., Wan, X., and Xiao, J. (2017). Abstractive document
summarization with a graph-based attentional neural
model. In Proceedings of the 55th Annual Meeting
of the Association for Computational Linguistics (Vol-
ume 1: Long Papers), pages 1171–1181.
Thammasut, D. and Sornil, O. (2006). A graph-based infor-
mation retrieval system. In 2006 International Sympo-
sium on Communications and Information Technolo-
gies, pages 743–748. IEEE.
Vechtomova, O. and Karamuftuoglu, M. (2008). Lexical
cohesion and term proximity in document ranking.
Information Processing & Management, 44(4):1485–
1502.
Voorhees, E. M. (1985). The cluster hypothesis revisited.
In Proceedings of the 8th annual international ACM
SIGIR conference on Research and development in in-
formation retrieval, pages 188–196.
Yulianti, E., Chen, R.-C., Scholer, F., Croft, W. B.,
and Sanderson, M. (2018). Ranking documents by
answer-passage quality. In The 41st International
ACM SIGIR Conference on Research & Development
in Information Retrieval, pages 335–344.
Zobel, J., Moffat, A., Wilkinson, R., and Sacks-Davis, R.
(1995). Efficient retrieval of partial documents. Infor-
mation Processing & Management, 31(3):361–377.
A Graph-based Approach at Passage Level to Investigate the Cohesiveness of Documents
123
