
Exploring Dashboards as Socio-technical Artifacts:
Literature Review-based Insights
Aleksandra Revina
1,2 a
1
Faculty of Economics, Brandenburg University of Applied Sciences, Brandenburg an der Havel, Germany
2
Faculty of Economics and Management, Technical University of Berlin, 10623, Berlin, Germany
Keywords: Dashboards, Socio-technical Systems, Organizations, Literature Review.
Abstract: In times of Big Data and rapid changes, managers become increasingly reliant on dashboards to make fast
and informed decisions. The advantages of dashboards are evident even at the beginning of Business
Intelligence deployment in organizations. To address the inability of humans to deal with large amounts of
data, dashboards are a typical instrument to represent business-critical information in a comprehensible
manner. However, there are many difficulties in managing the needs of individuals, teams, and organizations
together with the technology in the context of socio-technical systems. While a broad range of technologies
for dashboards’ creation exists, the question remains in how far dashboard solutions consider the needs and
preferences of their primary addressee – human worker. This paper addresses this question by offering a
systematic review of recent literature on dashboards. The study focuses on the end-user perspective and
includes domains, goals, design process and dashboard characteristics, technologies, and impacts of
dashboards’ application in organizations. In conclusion, research gaps and potential directions are
summarized.
1 INTRODUCTION
With the exponential growth of data, organizations
progressively take measures to valorize the enormous
data volumes, using various tools and selecting the
data for particular purposes. Dashboards are widely
implemented to visualize, analyze, interact with, and
present data in various forms. Their application
domains are also limitless (Schöffel, Weibell, &
Schwank, 2018). Thus, dashboards can serve as city
information desks, Business Intelligence tools, and
shop floor boards or provide real-time information on
emergencies.
Organizations either develop dashboards
themselves or use existing software solutions (Aksu,
del-Río-Ortega, Resinas, & Reijers, 2019), the latter
gaining more and more popularity due to their
advanced functionalities and adaptability. The
recognized solutions are Microsoft Power BI,
Tableau, Qlik, and SAP BI, to name a few (Gartner,
2021). As a rule, dashboards serve to support
decision-making, presenting the information in the
form of a graph or table. The goal is to make sense of
a
https://orcid.org/0000-0002-8405-0018
large amounts of data and attract attention to the
essential information, enabling informed decision-
making on different handling options.
A row of studies evidences that dashboards
frequently fail to provide information accurately and
efficiently, focusing on the decoration rather than
user and content (Aksu et al., 2019). The ultimate role
of a dashboard can be described as establishing a kind
of “communication bridge” between vast amounts of
digital data and human workers who are able to
process only a limited amount of it. The user and the
ability to make efficient decisions should be at the
center of any dashboard design. As fairly stated in
(Franklin et al., 2017), in socio-technical systems,
there are many difficulties in managing the needs of
individuals, teams, and organizations along with the
applied technology. Therefore, it is critical to put the
end-user in the focus of the dashboard design for
value creation. This study aims to analyze recent
publications on dashboard design and use in the
organizational context of different industrial domains
(i) to identify to which extent the design considers the
end-user and his/her environment so that (ii) the
Revina, A.
Exploring Dashboards as Socio-technical Artifacts: Literature Review-based Insights.
DOI: 10.5220/0010639702070218
In Proceedings of the 18th International Conference on e-Business (ICE-B 2021), pages 207-218
ISBN: 978-989-758-527-2
Copyright
c
2021 by SCITEPRESS – Science and Technology Publications, Lda. All rights reserved
207

dashboard can provide the necessary support. The
focus lies on the usage of dashboards in the context of
various organizational processes’ support. Hence,
industrial domains, goals, end-users, design process
and dashboard characteristics, technologies used for
dashboard development, and envisioned impacts are
studied in detail.
The remainder of the paper is organized as
follows. The next Section 2 provides the background,
followed by the research methodology in Section 3.
Section 4 and Section 5 present the analysis and
results, which are discussed in Section 6. The
conclusion in Section 7 summarizes the study
findings.
2 BACKGROUND
2.1 Socio-technical Systems and Design
Challenges
Nowadays, people use technology to accomplish
various tasks and be efficient and productive. A socio-
technical approach aims to consider people and
technology from an integrated perspective. Originally,
socio-technical systems (STS) were used in the
organizational redesign. Accordingly, social and
technical factors are equally important in the new
work system design (Mumford, 1994). At present,
STS go far beyond organizational redesign and
include technology, social interactions, environmental
dynamics, and people’s practices (Goggins et al.,
2017). However, STS preserve this fundamental logic
of joint optimization of social and technical elements
in conformity with the organizational goals (Baxter &
Sommerville, 2011).
A considerable volume of Information Systems
(IS) research is based on the STS paradigm and
directly or indirectly draws on its core principles
(Hirschheim & Klein, 2012). STS is believed to have
the potential to bring together diverse IS dimensions
in the future (Sarker, Chatterjee, Xiao, & Elbanna,
2019).
Due to the close interweaving of social and
technical elements, the IS design process, while
focusing on technical artifacts, cannot be separated
from soft, social, cultural, and even psychological
components (Nissen, Bednar, & Welch, 2007).
Accordingly, the IS design can be naturally considered
socio-technical and challenging.
As a rule, these challenges come from different
sources. In the context of STS, according to (Bossen,
2018), one can name two major challenges. One is
caused by the need to choose between various
priorities, desires, and motivations for developing a
new technology solution, i.e., various design
rationales. Another challenge is how one perceives,
identifies, and reflects the environment, including
work activities and procedures, into which new
technology solutions are to be integrated (Bossen,
2018).
In the first challenge, many questions emerge
when considering the variety of organizational
domains, multiple stakeholders, and goals. For
example: Are there domain specificities in the STS
design? What are the goals? Who will be the primary
beneficiary? It becomes evident that often it has to be
decided between one or more competing design
rationales (Goggins et al., 2017). As a rule, IS
designers have difficulty determining the rationale
and need to conduct a stakeholder analysis to identify
who has what stakes in the new technology solution
and their potential to help or impede its progress
(Eskerod, Huemann, & Savage, 2015). Furthermore,
the design goals might be influenced by the funders
(Goggins et al., 2017).
The successful adoption of technology is directly
dependent on its appropriateness and specific
rearrangements in the users’ work. Thus, apart from
the funders and their goals, the end-users have to be
the first to consider in the design process (Bossen,
2018). This point paved the way for the STS studies
being one of the key outcome of Tavistock’s socio-
technical approach in the 1950s (Trist & Bamforth,
1951), followed by the participatory design at the end
of the 1980s (Simonsen & Robertson, 2013)
remaining crucial for modern STS studies (Baxter &
Sommerville, 2011). To sum up, the design,
development, and implementation of new technology
solutions are an intrusion into the existing
environment and, hence, shaped by the stakeholders,
end-users, and their needs and preferences.
Regarding the second challenge, it is important to
understand the current state of the environment, i.e.,
answering the questions: What are current work
procedures? What needs to be changed? Hereby,
another difficulty is a high context dependency and
the possibility of multiple interpretations of how the
work procedures are perceived. Following (Bossen,
2018), first, STS design strongly advocates for
involving the stakeholders and end-users in the design
process. Second, STS design entails deciding
between various design rationales reflecting different
work preferences. Third, STS design demands an
adequate representation of current work processes
(Bossen, 2018).
E-DaM 2021 - Special Session on Empowering the digital me through trustworthy and user-centric information systems
208

2.2 Dashboards and Socio-technical
Systems Design
The study (Sarikaya et al., 2019) reveals that the term
dashboard denotes an extensive range of entities,
defying a typical dashboard definition used in the
visualization community, i.e., “a visual display of
data used to monitor conditions and/or facilitate
understanding”
(Wexler, Shaffer, & Cotgreave,
2017).
At present, dashboards are used almost in every
domain. As a result, the dashboard definition has
developed beyond single-view reporting screens to
incorporate interactive interfaces with many
objectives, such as communication, learning,
motivation, and traditional monitoring and decision
support (Sarikaya et al., 2019).
Dashboards address the problem of large amounts
of data, making it “accessible” for humans and
enabling informed decision-making. STS design
perspective of a dashboard requires at least applying
those design principles and practices aligned with the
way people see and think (Sarcevic, Marsic, & Burd,
2018). Users should be provided with dashboards that
meet their needs and facilitate insight delivery,
improving their decisions. Hence, it is critical to
include the end-users in the design process and
enhance the user experience (Vazquez-Ingelmo,
Garcia-Penalvo, & Theron, 2019).
The customization approach addresses this
demand by assisting developers and users in
configuring customized solutions. For example, the
already mentioned Tableau software enables the
creation of dashboards without any programming
skills. However, in many cases, users have difficulty
determining which configuration fits their goals
(Padilla, 2018). Whereas many solutions exist, recent
studies demonstrate the importance of user goals and
context for designing meaningful, engaging
dashboards (Aksu et al., 2019; Sarikaya et al., 2019).
Focusing on the STS perspective, the following
four categories of dashboard design survey proposed
in (Sarikaya et al., 2019), which partially overlay the
STS design challenges outlined in Section 2.1, are
used: (1) purpose or the intended use of a dashboard
which is supposed to determine the visual and
functional characteristics; (2) audience which is also
known to reflect these characteristics; (3) visual
features and interactivity that are critical for users’
engagement; (4) additional data semantics, such as
alerting about anomalies, breaking of the defined
thresholds, and automatic updates based on the new
data.
As can be concluded, the design principles of STS
and dashboards are congruent in many points and
complement each other with specific design
characteristics. These points, i.e., user-centricity and
goals, current and future work procedures, and design
process and dashboard characteristics, serve as a
guideline to address the first goal stated in the
introduction section, i.e., identify to which extent the
design process considers the user and his/her
environment. To address the second goal of the
present study, i.e., identify if the dashboard can
provide the necessary support, another important point
of the impacts or results of the dashboard application,
which can be addressed in terms of user feedback or
potential propositions of the dashboard designers, is
outlined.
3 RESEARCH METHODOLOGY
3.1 Research Objectives and Questions
In the light of existing advanced software solutions
on the one hand and reported failures in the dashboard
design on the other, this study aims to perform a
systematic review of the most recent literature and
identify to which extent the dashboard design
considers the user and his/her environment and is able
to provide the necessary support. Accordingly, the
following research questions were posed:
RQ1: In which domains has the dashboard research
been recently performed?
RQ2: What are the goals of organizations researching
and applying dashboards?
RQ3: Who are the end-users, and to what extent are
their needs and preferences considered in the
dashboard design?
RQ4: What technologies are used in dashboard
design?
RQ5: What are the (envisioned) impacts of dashboard
research and application in organizations?
3.2 Selection Criteria and Research
Method
The review process is based on the guidelines
indicated in (Kitchenham, 2004). The data collection
process outlined in the PRISMA diagram (Moher et
al., 2009) was used to specify the actions (see Figure
1). In the first identification step, the keyword
“Dashboard” was used to search for relevant
documents in the Scopus database in the title and
abstract of the documents. The search was limited to
English language and journal and conference
proceedings publication type. To review the most
Exploring Dashboards as Socio-technical Artifacts: Literature Review-based Insights
209

recent literature on the topic, the publication period
was set to 2017 – 2021. As the study focus is the
design of dashboards in the organizational context
across different domains, the search was limited to the
Engineering, i.e., design, subject area and not to a
particular domain. The selection of particular
domains would result in a thematically narrow set of
studies. In the second screening step, the search
results were refined by the exclusion of the
documents containing keywords that (i) have a strong
focus on and are too specific in terms of the
technology, for example, “Virtual Reality”, “Internet
of Things”, “Smartphones”, “Embedded Systems”,
“Advanced Driver Assistance Systems”, “Computer
Vision”, “Mobile Applications”, “Data Mining”,
“Application Programs”, “Cloud Computing”,
“Network Security”, “Learning Algorithms”,
“Raspberry Pi” and (ii) are irrelevant for the
organizational context, such as “Roads and Streets”,
“Vehicles”, “Cameras”, “Smart City”, “Accidents”,
“Intelligent Vehicle Highway Systems”. This allowed
to balance between width and depth of the study and
obtain the results grasping various cases in the
organizational context and not explicitly focused on
particular technology outside the mentioned context.
Figure 1: Review process phases and outcomes using the
PRISMA flow diagram.
Afterward, the title and abstract of the identified
documents were screened, and the documents were
excluded due to their irrelevance, insufficient quality,
or unavailability of full texts. The relevance was
determined based on the research questions,
considering the following criteria: (1) the articles
should include a case study from a particular domain,
(2) report on the goals of organizations developing
dashboards, (3) report on the end-users, (4) report on
the design process, (5) report on the dashboard
characteristics such as visualization, interactivity,
and data semantics (alerts, automatic updates)
ideally supported by a screenshot, figure, or link to a
dashboard and the description of technologies used
to develop a dashboard, (6) report on the envisioned
impacts of the dashboard research and application.
In the third eligibility step, the check of full texts
was performed, and the documents were excluded
due to the lack of the elements necessary for the
analysis and insufficient description of the obtained
results. Hence, the final sample for the review
included 31 articles covering 31 unique cases
correspondingly (see Figure 1 for details).
4 ANALYSIS
Based on the STS and dashboard related design
challenges specified in the background section, each
article was checked and coded according to the
following aspects: (1) domain and country of
organizations developing dashboards (Are there
domain specificities in the STS design?), (2) goals and
motivations of organizations to develop and apply
dashboards (What are the goals?), (3) if there is an
evaluation performed with end-users, (4) who are the
end-users (Who will be the primary beneficiary?), (5)
how the needs and preferences of end-users are
considered in terms of the design process (What are
current work procedures? What needs to be
changed?), (6) visual, interaction, or data semantics
characteristics of a dashboard, (7) technologies used
to develop a dashboard, (8) envisioned impacts of
dashboard research and application.
The coding procedure included four main steps.
First, a simple annotation framework and coding rules
were created regarding the goals of dashboard design,
dashboard users, design process, dashboard
characteristics, technologies, and impacts. Second,
the framework and rules were discussed following the
collegial advice of another independent researcher.
Third, each paper was carefully studied and coded
using the annotation framework. During this process,
the annotation framework was adjusted three times.
Fourth, the results were double-checked, involving
the advice of the independent researcher. Important to
note that one article could contain several code values
E-DaM 2021 - Special Session on Empowering the digital me through trustworthy and user-centric information systems
210

in the same category, i.e., several goals, end-user
groups, domains, and business areas.
In particular, to answer the RQ1, the specific
application cases were extracted what resulted in 15
industrial domains and two business areas. To answer
the RQ2, the same bottom-up procedure was followed.
For each article, specific goals were identified and
generalized into 26 goals in the form of verbs and
verbal expressions. While extracting the information
regarding end-users, the specific 16 cases were
identified. To address the question to what extent the
end-user needs and preferences are considered in the
dashboard design, the following four points were
considered: (1) evaluation (if conducted or not), (2) as-
is and to-be analysis (if conducted or not), (3)
visualization (multiview, suitable logical, simple
basic, complex) and interactivity (little / no
interactivity, simple basic interactivity in the form of
embedded buttons, drop-down menus, advanced in
the form of filters, resort, drill-down, hovers)
characteristics, (4) data semantics (alerts, automatic
updates, no data semantics). Concerning the RQ4, the
case study implementation section of the articles was
examined and identified 17 different technologies and
two proprietary solutions used for dashboard
development. Finally, to answer the RQ5, the design
and discussion sections of the articles were considered
to analyze the (envisioned) impacts of dashboard
research and application in organizations.
5 RESULTS
This section describes the study findings in relation to
the research questions obtained using the approaches
presented in Section 4
2
. Section 5.1 introduces the
domains where recent research on dashboards has
been conducted. Section 5.2 summarizes the goals of
dashboard research and application in organizations.
Section 5.3 describes the end-users, whereas Section
5.4 addresses the points related to the design process,
dashboard characteristics, and technologies used for
dashboard development. Finally, Section 5.5 presents
the (envisioned) impacts of dashboard research and
application in organizations, i.e., the envisioned
support.
5.1 Domains of Dashboard Research
Dashboards serve to enhance human cognitive and
perceptual abilities. As a result, dashboards have
2
Check the complete Excel file with the study results
https://github.com/revina825/Dashboards
become a standard tool to support decision-making in
different domains and business areas, the trend
proven by the abundance of advanced solutions on the
market.
Recent applied research on dashboards evidences
a considerable number of studies aimed at solving
particular practical challenges. The study sample
reveals a high variety of dashboard research domains,
with the majority in the Information Systems (five
cases (Brandt, Striewe, Beck, & Goedicke, 2017;
Cardoso, Vieira Teixeira, & Sousa Pinto, 2018; Fleig,
Augenstein, & Maedche, 2018; López et al., 2021; Pa,
Karim, & Hassan, 2017)), Manufacturing (four
cases (Raudberget, Ström, & Elgh, 2018; Steenkamp,
Hagedorn-Hansen, & Oosthuizen, 2017; Vilarinho,
Lopes, & Sousa, 2017; Yusof, Othman, & Yusof,
2018)), Construction and Real Estate (four cases
(Ho, Mo, Wong, & Leung, 2019; Mahadzir, Omar, &
Nawi, 2018; Montaser & Montaser, 2017; Utrilla,
Górecki, & Maqueira, 2020)), Healthcare (three
cases (Christen et al., 2020; Franklin et al., 2017;
McGlothlin, Srinivasan, & Stojic, 2019)), and Supply
Chain (three cases (Ho et al., 2019; Lanotte, Ferreira,
& Brisset, 2020; Martins, Alves, & Leão, 2018)).
However, Sales (Noonpakdee, Khunkornsiri,
Phothichai, & Danaisawat, 2018; Telaga, Librianti, &
Umairoh, 2019) and HR (Chattopadhyay et al., 2020;
Zajec, Mrsic, & Kopal, 2021) company areas, i.e.,
primary sources of company performance indicators,
are underrepresented along with Automotive and
Airspace domains with only two cases. Machinery
(Longo et al., 2018), Banking (Massardi, Suharjito, &
Utama, 2018), Academia (Wibowo, Andreswari, &
Hasibuan, 2018), Disaster Management (Saha,
Shekhar, Sadhukhan, & Das, 2018), Government
(Conejero et al., 2021), Telecom (Fraihat, Almomani,
Fraihat, & Awad, 2020), and Tourism (Balletto,
Milesi, Ladu, & Borruso, 2020) are unique cases in
the sample. See Figure 2 for the relative distribution
numbers.
The identified domains and cases differ in the
research artifact, at which a dashboard is targeted,
end-user group, and application area. For example,
the cases in IS domain aim at supporting IS managers,
designers, or software developers in monitoring the
health status of the IS (Cardoso et al., 2018),
measuring green IS design (Pa et al., 2017),
discovering important processes in IS (Fleig, 2017),
supporting software engineering and development
(Brandt et al., 2017; López et al., 2021).
Exploring Dashboards as Socio-technical Artifacts: Literature Review-based Insights
211
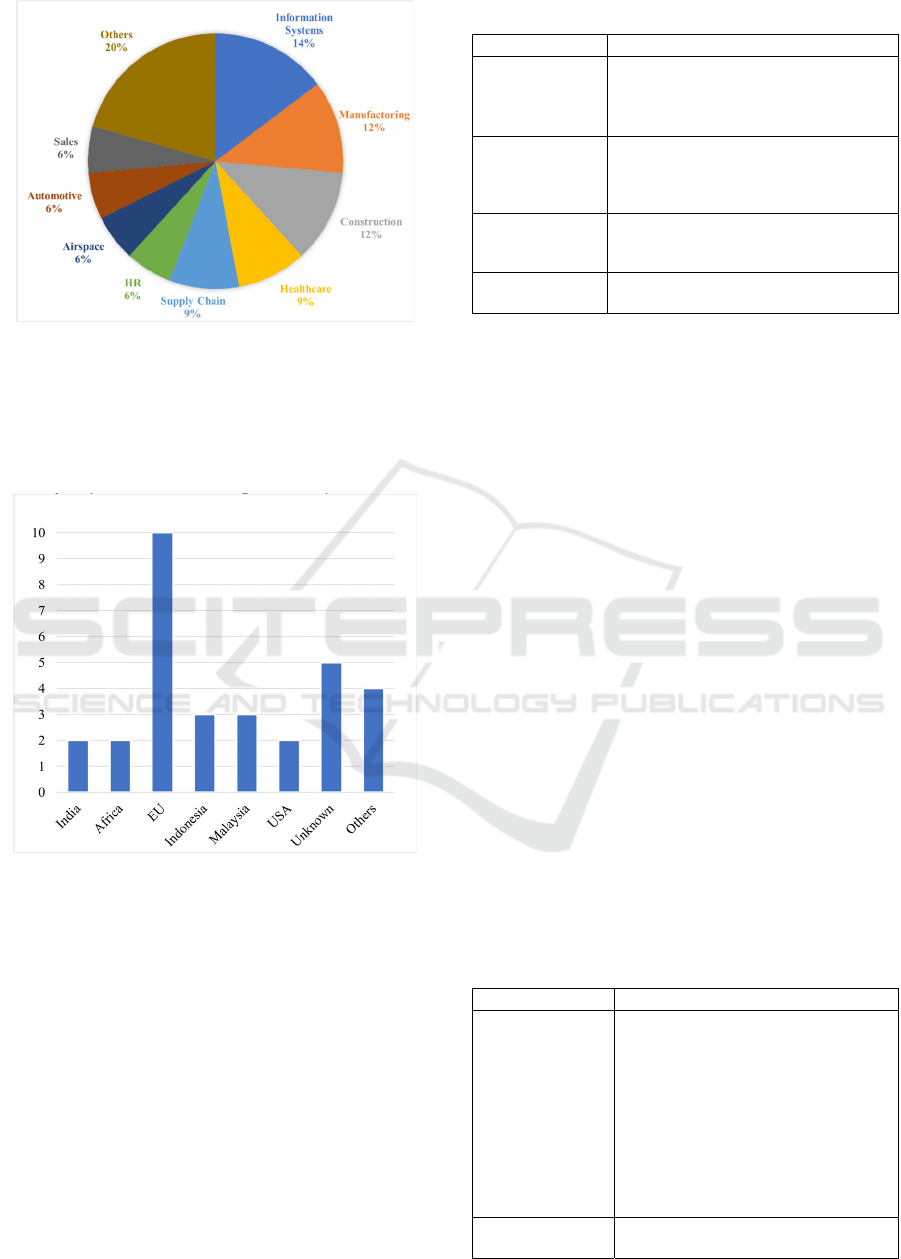
Figure 2: Domain distribution in dashboard research.
The absolute distribution of countries is presented
in Figure 3. The majority of cases were conducted in
the EU (ten cases). However, considering each EU
country separately, Malaysia and Indonesia make up
the majority, with three cases per country.
Figure 3: Country distribution in dashboard research.
5.2 Goals of Dashboard Research and
Application
Similar to the domains, the analysis shows a broad
range of goals in the dashboard research and
application. To provide a structured outcome, the
identified 26 unique goals were grouped into four
categories based on their function (see Table 1). In the
Information & Knowledge Management category,
along with the typical dashboard goals such as
visualize, summarize, inform, two studies highlight
specific motivations for dashboard design, i.e.,
simplify and standardize the information collection
(Raudberget et al., 2018) and storing and retrieving
(Cepeda & Lopes, 2019).
Table 1: Four categories of goals.
Category Unique goals
Information &
Knowledge
Management
(31% of cases)
visualize, summarize, inform, simplify
and standardize, store and retrieve
Project
Management
(20% of cases)
monitor, alert, organize and coordinate,
measure, report, communicate, improve
communication, support in project
planning, manage
Decision-making
(33% of cases)
support decision-making, predict,
identify, provide data insights, discover,
simulate, explore
Secondary goals
(16% of cases)
improve, promote, valorize, evaluate,
analyze, reduce
In the Project Management category, both typical
characteristic goals (monitor, measure, report,
communicate) and more comprehensive goals
organize, coordinate (Christen et al., 2020), and
manage (Lanotte et al., 2020) are named.
Noteworthy, the majority of studies on dashboards set
the goals related to the decision-making support.
Behind such advanced motivations as discover (Fleig
et al., 2018) or simulate and explore (López et al.,
2021) are complex technology solutions. Finally, in
the row of studies, secondary, often even more
important goals are mentioned, for example, reducing
negative influences (Pa et al., 2017) and valorizing
certain objects (Balletto et al., 2020).
5.3 End-users of Dashboards
In total, 16 unique end-users are identified in the
sample. Afterward, the end-users were grouped into
five meaningful categories (see Table 2). The
category “Others” contains domain- and case study-
specific users such as process owners, product
developers, software developers, tourists, and real
estate players. It is observed that the end-users are
defined and considered in accordance with the
domain and case study specificity and goals.
Table 2: End-users of dashboards.
End-users Source
Managers
(51% of cases)
(Brandt et al., 2017; Cepeda & Lopes,
2019; Chattopadhyay et al., 2020; Fleig et
al., 2018; Fraihat et al., 2020; Ho et al.,
2019; Kapp, Lefebvre, & Monnier, 2019;
Lanotte et al., 2020; López et al., 2021;
Martins et al., 2018; Massardi et al., 2018;
McGlothlin et al., 2019; Montaser &
Montaser, 2017; Noonpakdee et al., 2018;
Steenkamp et al., 2017; Telaga et al., 2019;
Utrilla et al., 2020; Vilarinho et al., 2017;
Yusof et al., 2018; Zajec et al., 2021)
Employees (10% of
cases)
(Cepeda & Lopes, 2019; Ho et al., 2019;
Vilarinho et al., 2017; Yusof et al., 2018)
E-DaM 2021 - Special Session on Empowering the digital me through trustworthy and user-centric information systems
212
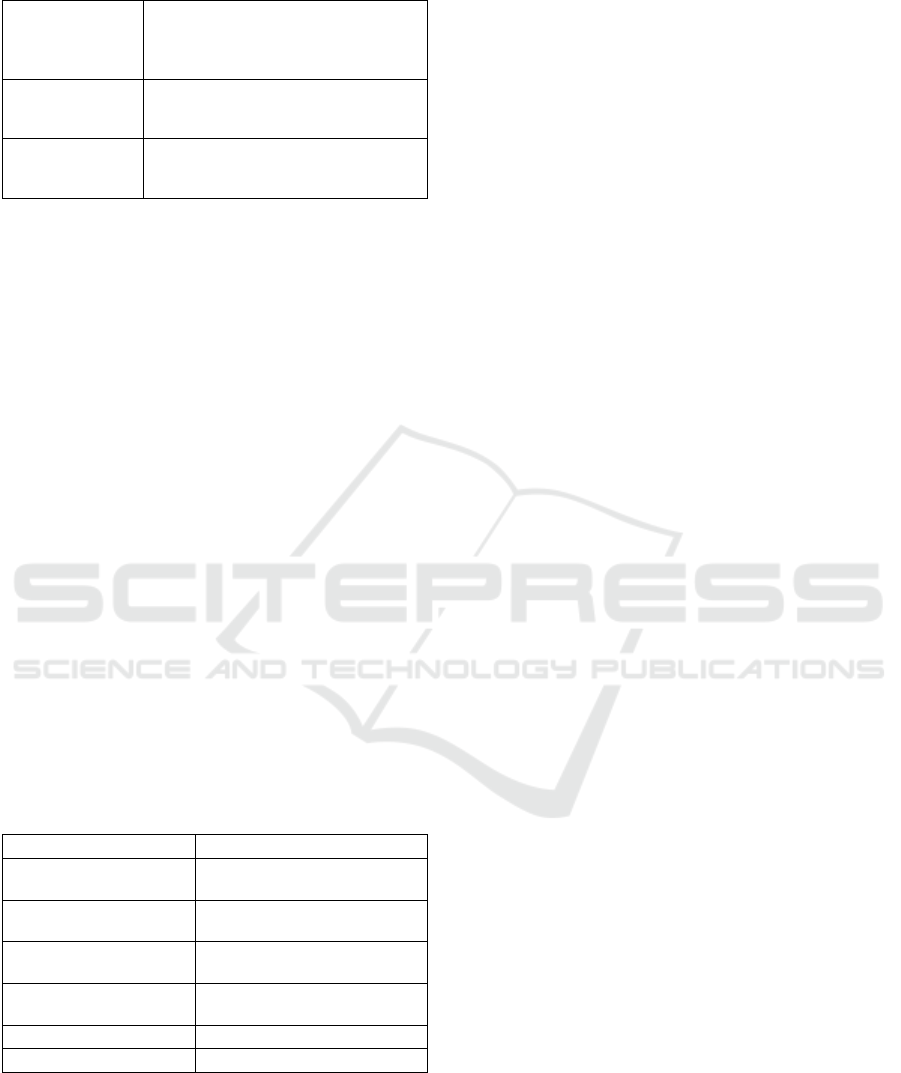
Table 2: End-users of dashboards (cont.).
Public institutions,
healthcare,
government
(18% of cases)
(Balletto et al., 2020; Christen et al., 2020;
Conejero et al., 2021; Franklin et al., 2017;
McGlothlin et al., 2019; Saha et al., 2018;
Wibowo et al., 2018)
IS administrators,
designers, technical
staff (8% of cases)
(Cardoso et al., 2018; Longo et al., 2018;
Pa et al., 2017)
Others (13% of
cases)
(Balletto et al., 2020; Fleig et al., 2018;
López et al., 2021; Mahadzir et al., 2018;
Raudberget et al., 2018)
5.4 Dashboard Design, Characteristics,
and Technologies
In the dashboard design context, the question
regarding the as-is and to-be analysis, i.e., current
work procedures and what needs to be improved, was
addressed in the study. In most cases (65%), both
analyses were performed what is in line with the STS
design approach. In the dashboard characteristics,
visualization, interactivity, and data semantics were
considered. According to the developed coding
scheme, visualization reveals the following
distribution: multiview 40%, suitable logical 28%,
simple basic 26%, complex 7%. The study results
show 29% of dashboards with simple basic
interactivity, 26% advanced, and 45% of dashboards
with little or no interactivity. Regarding data
semantics, only 16% of cases evidence alert function
and 25% - automatic updates.
In order to develop dashboards with mentioned
characteristics, a diverse set of technologies was used.
19 technologies were grouped into six categories. As
follows from Table 3, Microsoft solutions are in a
clear majority.
Table 3: Six categories of technologies.
Category Technologies
Programming languages
(22% of cases)
Java, PHP, Python, R
Microsoft (34% of cases)
MS Access, MS Share Point,
MS Excel, VBA, MS Power BI
Other well-known
solutions (19% of cases)
Qlick, Tableau, Oracle
Less known solutions
(13% of cases)
Pureshare, Freeboard, Axure RP
9, Pajek
Google (6% of cases) Google sites, Google sheets
Proprietary (6% of cases) n.a.
5.5 Impacts of Dashboard Research
and Application
In this subsection, the envisioned impacts of
dashboard research and application in organizations
are presented. First, this information was extracted
from each of the articles in the sample. Afterward, 16
categories were developed.
The majority of cases (25%) name performance
improvement as one of the impacts of dashboard
application, for example (Ho et al., 2019; Massardi et
al., 2018; Telaga et al., 2019). It is followed by
closely related efficiency improvement (15%), for
example (Cardoso et al., 2018; Franklin et al., 2017;
Longo et al., 2018), and better data monitoring
(13%), like in (Steenkamp et al., 2017). Time
improvements (10%) (Yusof et al., 2018), better
(service) quality (9%) (Wibowo et al., 2018), and
better organization and coordination (6%) (Lanotte
et al., 2020) are less frequently encountered impacts.
Better planning (Saha et al., 2018), sustainability
contribution (Utrilla et al., 2020), better
understanding (Chattopadhyay et al., 2020), better
awareness (Fleig et al., 2018), and cost reduction
(McGlothlin et al., 2019) have been mentioned only
in 3% of cases. Finally, only 1% of cases reveal better
valorization (Balletto et al., 2020), better policies and
strategies, employment improvement (Conejero et al.,
2021), better documentation (Raudberget et al.,
2018), and better communication (Montaser &
Montaser, 2017).
6 DISCUSSION
6.1 Dashboard Research and
Application Considerations
Although dashboards take their origin in automobiles
and other vehicles, they have become increasingly
popular in business, government, and nonprofit
organizations. At present, dashboards are widely
known to provide business executives and managers
with company performance-related information, for
example, sales, HR, or profit (Eckerson, 2010). On
the one hand, it is confirmed by the study results
revealing managers (51%) as a major end-user group.
On the other, sales (6%) and HR (6%) business areas
are underrepresented in the sample.
Noteworthy, with the high domain variety, i.e.,
Automotive, Healthcare, Construction, Government,
Academia, Banking, to name a few, the study results
demonstrate a high interest in dashboards in the IS
discipline itself. The IS researchers set specific goals,
such as monitoring IS health status (Cardoso et al.,
2018), reducing the environmental impact of ICT
products and services (Pa et al., 2017), discovering
important business processes (Fleig et al., 2018),
extracting and visualizing high-level strategic
Exploring Dashboards as Socio-technical Artifacts: Literature Review-based Insights
213

indicators related to software quality (López et al.,
2021), and supporting Software Engineering projects
(Brandt et al., 2017). In their majority, these studies
make use of programming languages such as Java to
develop dashboard solutions.
The larger part of the studies has been performed
in the EU countries whereby (i) consistent approaches
of user involvement in terms of evaluation, as-is and
to-be analyses have been followed, and (ii) existing
software, such as Microsoft, Qlick, Axure, was used.
In general, the analysis reveals a strong trend of
leveraging vendor solutions rather than building the
dashboards from scratch. In contrast, one decade ago,
45% of companies that participated in the survey
declared developing proprietary solutions (Eckerson,
2010). This observation evidences the high
customization and usability of commercial software.
As also noted in (Eckerson, 2010), at present,
dashboards can be considered Business Information
Systems comprising data collection, integration, and
processing technologies. In the sample, the studies
focus on both (i) dashboards as mere visual
interfaces (Christen et al., 2020; Franklin et al., 2017;
Wibowo et al., 2018) and (ii) dashboards as part of
comprehensive solutions. Thus, (Conejero et al.,
2021) propose a multi-aspect support system using
Data Engineering and advanced visualization
techniques as well as association rules. (Fleig et al.,
2018) develop a decision support system for
identifying the most critical business processes in IS
comprising the IS layer, data management layer, and
visualization layer. Introducing an analytic dashboard
visualization for flood management, (Saha et al.,
2018) describe an architecture of the decision support
system. At the same time, (Wibowo et al., 2018),
while evaluating the proposed dashboard, highlight
its suitable and logical visualization but declare the
need for decision support. Hence, a dashboard should
not be considered as an isolated visual interface but
rather a part of a comprehensive decision-making
support solution to facilitate value creation and
proactively assist the end-user.
In the context of the design process, STS research
highlights the importance of performing both as-is
and to-be analyses (Bossen, 2018; Goggins et al.,
2017). In the sample, most of the studies (65%)
follow this approach. Moreover, (Franklin et al.,
2017) refer to STS while analyzing the challenges in
the implementation and lessons learned. (Martins et
al., 2018) use participatory design, which is a key
issue in the STS design (Scacchi, 2004), to develop
and implement operational monitoring dashboards in
a lean context.
Evaluation, an essential step in any design
process, has been mentioned in 52% of cases. In 32%
of papers, case studies were used to develop a
dashboard, however, without any evaluation. In 16%,
the whole approach (and not a dashboard in
particular) was evaluated. In a few studies, the
researchers worked with open-source data (Balletto et
al., 2020; Fraihat et al., 2020). In some cases,
evaluation is planned as a part of future work
(Christen et al., 2020). It is to note that for successful
design and implementation of dashboards as socio-
technical artifacts, the evaluation with end-users
plays a key role. The evaluation results should be
reported straightforwardly and comprehensively,
which was not the case in any of the articles in the
sample.
6.2 End-user Support Implied in
Dashboards
As stated in the previous subsection, there is
insufficient end-user involvement in the design
process of dashboards and related solutions.
Nonetheless, the end-user support is implicitly
contained in the dashboard goals, characteristics, and
envisioned impacts.
The analysis of the goals of researching and
applying dashboards in organizations shows that the
goals are prevailingly concerned with decision-
making support (33%), i.e., predicting, identifying,
discovering, simulating, exploring, and providing
data insights. This observation is in line with the
declared end-user demands (Wibowo et al., 2018).
Along with the decision-making support, such typical
dashboard goals as Information & Knowledge
Management (31%) and Project Management (20%),
and several secondary goals (16%) are mentioned.
Whereas all these goals are directed towards assisting
and empowering the end-user, he/she is not explicitly
discussed in the sense of usability and satisfaction
while introducing these goals. It should be
emphasized that in the STS context, the end-user
needs to be explicitly addressed while setting the
design goals.
The underrepresented end-user perspective in the
goal-setting is also reflected in the dashboard
impacts. Hereby, a clear focus is set on performance
(25%) and efficiency (15%), followed by data
monitoring (13%), time improvement (10%), and
better (service) quality (9%). Hence, end-user
satisfaction and other benefits related to the workload
reduction are STS-related critical missing points in
the literature, demanding thorough consideration.
E-DaM 2021 - Special Session on Empowering the digital me through trustworthy and user-centric information systems
214

Many dashboard projects fail as they mainly aim
at making a “glitzy” interface (Aksu et al., 2019;
Eckerson, 2010). The study results evidence the
prevalence of multiview (40%), suitable logical
(28%), and simple basic (26%) visualizations. Few
studies (7%) introduce dashboards with complex
information presentation (Conejero et al., 2021; Zajec
et al., 2021). In contrast, the interactivity and data
semantics characteristics need to be improved due to
the prevailingly no / little interactivity (45%) and
missing data semantics (50%). While high
interactivity and data semantics can potentially
increase end-user satisfaction, it is to argue that
dashboard characteristics, including data, data
semantics, visualization, and interactivity types,
should be selected in line with end-user needs, tasks,
and preferences. Such an aligned dashboard design
would lead to end-user satisfaction and acceptance,
as also noted in (Bossen, 2018). It follows that closely
studying the interaction between the end-user and the
dashboard is an essential factor requiring more focus
from the research community and practitioners.
It is to highlight that, similarly to (Isazad
Mashinchi, Ojo, & Sullivan, 2020), the analysis did
not clearly state if there is a relationship between
dashboard characteristics mentioned above (also
described in Section 5.4) and envisioned impacts of
dashboard application (Section 5.5). I.e., the question
remains if one can improve or influence the impacts
by modifying the dashboard characteristics. It is
essential to respond to this question since it
demonstrates the role of various characteristics in
dashboard design.
6.3 Limitations
A literature review can be considered an excellent
methodological instrument for addressing a wide
range of research issues (Snyder, 2019). Nonetheless,
it has several limitations. In this regard, the study
evidences the aspects listed below.
The term dashboard is constantly penetrating
different areas and taking on new meanings.
Generally denoting visual displays used for showing
important information at a glance (Few, 2017),
dashboards are applied and researched in diverse
domains ranging from the cities and buildings, cars
and highways to organizations aiming to support
managers in making informed decisions or
monitoring various organizational processes. The
latter is the focus of the study and, due to its
seemingly broad coverage, makes up the significant
limitation of the study.
To address this limitation and filter out the
unrelated works, the exclusion of irrelevant keywords
was used. However, keywords are limited and cannot
embrace all the aspects of the work. Moreover,
keywords are usually adjusted to fit the scope of the
target journal or conference. Hence, while filtering
the keywords, relevant studies could be missed.
Authors’ bias is another common limitation of
(systematic) literature reviews (Denyer & Tranfield,
2006). Although the transparent procedure attempts
to reduce the subjective effect, the authors are never
entirely neutral while reviewing the literature (Kraus,
Breier, & Dasí-Rodríguez, 2020).
A further challenge is addressing various study
contexts, especially in the broad and highly
fragmented research fields, like organizational
studies and management (Denyer & Tranfield, 2006).
Even in comparable studies, in complex social
contexts, there are always likely to be minor
differences. Synthesizing the studies to achieve a
structured outcome can remove critical contextual
information (Hammersley, 2001).
7 CONCLUSION
In this study, the analysis of dashboards’ research and
application in organizations was performed with a
socio-technical emphasis. Based on a systematic
literature review, a sample of 31 articles was selected.
Various aspects such as domains, goals, design
process and dashboard characteristics, technologies,
and impacts of dashboards’ application in
organizations were considered. It was identified that
in the majority of cases, users are involved in the
evaluation process. This way, helpful improvement
suggestions can be gathered. For example, the users
place a special value on the decision-making support
functionalities and not visual characteristics.
Further, several gaps have been identified: (i) the
evaluation process was lacking thorough and
comprehensive documentation and reporting; (ii) the
user-centricity, for example, end-user satisfaction,
workload and stress reduction, is insufficiently
expressed in the dashboards’ goals and envisioned
impacts (the focus lies on business performance and
efficiency increase); (iii) dashboard characteristics
should be selected in line with end-user needs, tasks,
and preferences; (iv) missing evidence on the relation
between dashboard characteristics and envisioned
impacts of the dashboard application. Future studies
addressing these gaps and putting more emphasis on
(i) dashboards as part of comprehensive decision-
making support solutions and (ii) end-user
Exploring Dashboards as Socio-technical Artifacts: Literature Review-based Insights
215

involvement in all stages of the dashboard design and
implementation have a high potential to improve
value creation and user satisfaction in this field.
REFERENCES
Aksu, Ü., del-Río-Ortega, A., Resinas, M., & Reijers, H. A.
(2019). An approach for the automated generation of
engaging dashboards. Lecture Notes in Computer
Science (Including Subseries Lecture Notes in Artificial
Intelligence and Lecture Notes in Bioinformatics),
11877 LNCS, 363–384. https://doi.org/10.1007/978-3-
030-33246-4_24
Balletto, G., Milesi, A., Ladu, M., & Borruso, G. (2020). A
dashboard for supporting slow tourism in green
infrastructures. A methodological proposal in Sardinia
(Italy). Sustainability (Switzerland), 12(9), 3579.
https://doi.org/10.3390/SU12093579
Baxter, G., & Sommerville, I. (2011). Socio-technical
systems: From design methods to systems engineering.
Interacting with Computers, 23(1), 4–17.
https://doi.org/10.1016/j.intcom.2010.07.003
Bossen, C. (2018). Socio-technical Betwixtness: Design
Rationales for Health Care IT. In Designing Healthcare
That Works: A Sociotechnical Approach (pp. 77–94).
https://doi.org/10.1016/B978-0-12-812583-0.00005-5
Brandt, S., Striewe, M., Beck, F., & Goedicke, M. (2017).
A Dashboard for Visualizing Software Engineering
Processes Based on ESSENCE. Proceedings - 2017
IEEE Working Conference on Software Visualization,
VISSOFT 2017, 2017-October, 134–138.
https://doi.org/10.1109/VISSOFT.2017.14
Cardoso, A., Vieira Teixeira, C. J., & Sousa Pinto, J.
(2018). Architecture for highly configurable
dashboards for operations monitoring and support.
Studies in Informatics and Control, 27(3), 319–330.
https://doi.org/10.24846/v27i3y201807
Cepeda, T. A., & Lopes, I. S. (2019). Support methodology
for product quality assurance: A case study in a
company of the automotive industry. Procedia
Manufacturing, 38, 957–964. https://doi.org/10.1016/
j.promfg.2020.01.179
Chattopadhyay, S., Ghosh, R., Banerjee, A., Gupta, A., &
Jain, A. (2020). FINESSE: Fair Incentives for
Enterprise Employees. Lecture Notes in Business
Information Processing, 385 LNBIP, 191–211.
https://doi.org/10.1007/978-3-030-50316-1_12
Christen, O. M., Mösching, Y., Müller, P., Denecke, K., &
Nüssli, S. (2020). Dashboard visualization of
information for emergency medical services. Studies in
Health Technology and Informatics, 275, 27–31.
https://doi.org/10.3233/SHTI200688
Conejero, J. M., Preciado, J. C., Fernández-García, A. J.,
Prieto, A. E., & Rodríguez-Echeverría, R. (2021).
Towards the use of Data Engineering, Advanced
Visualization techniques and Association Rules to
support knowledge discovery for public policies.
Expert Systems with Applications, 170, 114509.
https://doi.org/10.1016/j.eswa.2020.114509
Denyer, D., & Tranfield, D. (2006). Using qualitative
research synthesis to build an actionable knowledge
base. Management Decision, 44(2), 213–227.
https://doi.org/10.1108/00251740610650201
Eckerson, W. W. (2010). Performance Dashboards:
Measuring, Monitoring, and Managing Your Business
(2nd ed.). Wiley.
Eskerod, P., Huemann, M., & Savage, G. (2015). Project
stakeholder management-past and present. Project
Management Journal, 46(6), 6–14. https://doi.org/
10.1002/pmj.21555
Few, S. (2017). Visual Business Intelligence – There’s
Nothing Mere About Semantics. Retrieved May 30,
2021, from https://www.perceptualedge.com/blog/
?p=2793
Fleig, C. (2017). Towards the Design of a Process Mining-
Enabled Decision Support System for Business Process
Transformation. Proceedings of the Forum and
Doctoral Consortium Papers Presented at the 29th
International Conference on Advanced Information
Systems Engineering, 170–178. Essen: CEUR.
Fleig, C., Augenstein, D., & Maedche, A. (2018). KeyPro -
A decision support system for discovering important
business processes in information systems. Lecture
Notes in Business Information Processing, 317, 90–
104. https://doi.org/10.1007/978-3-319-92901-9_9
Fraihat, S., Almomani, M., Fraihat, M., & Awad, M.
(2020). Telecom big data: Social media sentiment
analysis. International Journal of Advanced Trends in
Computer Science and Engineering, 9(4), 4322–4327.
https://doi.org/10.30534/ijatcse/2020/22942020
Franklin, A., Gantela, S., Shifarraw, S., Johnson, T. R.,
Robinson, D. J., King, B. R., Okafor, N. G. (2017).
Dashboard visualizations: Supporting real-time
throughput decision-making. Journal of Biomedical
Informatics, 71, 211–221. https://doi.org/10.1016/
j.jbi.2017.05.024
Gartner. (2021). Business Intelligence (BI) Tools Reviews
2021. Retrieved May 2, 2021, from
https://www.gartner.com/reviews/market/analytics-bus
iness-intelligence-platforms
Goggins, S., Herrmann, T., Prilla, M., Stary, C., &
Ackerman, M. (2017). Designing Healthcare That
Works: A Sociotechnical Approach. https://doi.org/
10.1016/c2016-0-01753-9
Hammersley, M. (2001). On “systematic” reviews of
research literatures: A “narrative” response to Evans &
Benefield. British Educational Research Journal, Vol.
27, pp. 543–554. https://doi.org/10.1080/
01411920120095726
Hirschheim, R., & Klein, H. K. (2012). A glorious and Not-
So-Short history of the information systems field.
Journal of the Association for Information Systems,
13(4), 188–235. https://doi.org/10.17705/1jais.00294
Ho, D. C. K., Mo, D. Y. W., Wong, E. Y. C., & Leung, S.
M. K. (2019). Business intelligence for order
fulfillment management in small and medium
enterprises. International Journal of Internet
E-DaM 2021 - Special Session on Empowering the digital me through trustworthy and user-centric information systems
216

Manufacturing and Services, 6(2), 169–184.
https://doi.org/10.1504/IJIMS.2019.098231
Isazad Mashinchi, M., Ojo, A., & Sullivan, F. J. (2020).
Investigating Analytics Dashboards’ Support for the
Value-based Healthcare Delivery Model. Proceedings
of the 53rd Hawaii International Conference on System
Sciences. https://doi.org/10.24251/hicss.2020.448
Kapp, V., Lefebvre, F., & Monnier, D. (2019). Adaptation
of an innovative prototype to flow management tasks in
an operational context. AIAA/IEEE Digital Avionics
Systems Conference - Proceedings, 2019-Septe.
https://doi.org/10.1109/DASC43569.2019.9081729
Kitchenham, B. (2004). Procedures for Performing
Systematic Reviews. Staffs.
Kraus, S., Breier, M., & Dasí-Rodríguez, S. (2020). The art
of crafting a systematic literature review in
entrepreneurship research. International Entrepre-
neurship and Management Journal, 16(3), 1023–1042.
https://doi.org/10.1007/s11365-020-00635-4
Lanotte, H., Ferreira, A., & Brisset, P. (2020). Lean supply
chain and designing a customer-oriented dashboard:
The case of an aerospace company. 2020 13th
International Colloquium of Logistics and Supply
Chain Management, LOGISTIQUA 2020.
https://doi.org/10.1109/LOGISTIQUA49782.2020.935
3919
Longo, C. S., Fantuzzi, C., Monica, F., Manfredotti, L., &
Sorge, M. (2018). Big Data for advanced monitoring
system: An approach to manage system complexity.
IEEE International Conference on Automation Science
and Engineering, 2018-August, 341–346.
https://doi.org/10.1109/COASE.2018.8560552
López, L., Manzano, M., Gómez, C., Oriol, M., Farré, C.,
Franch, X., Vollmer, A. M. (2021). QaSD: A Quality-
aware Strategic Dashboard for supporting decision
makers in Agile Software Development. Science of
Computer Programming, 202. https://doi.org/
10.1016/j.scico.2020.102568
Mahadzir, N. H., Omar, M. F., & Nawi, M. N. M. (2018).
A sentiment analysis visualization system for the
property industry. International Journal of Technology,
9(8), 1609–1617. https://doi.org/10.14716/
ijtech.v9i8.2753
Martins, A. F., Alves, A. C., & Leão, C. P. (2018).
Development and implementation of dashboards for
operational monitoring using participatory design in a
lean context. Advances in Intelligent Systems and
Computing, 621, 237–249. https://doi.org/10.1007/978-
3-319-61121-1_21
Massardi, A. E., Suharjito, & Utama, D. N. (2018).
Business Intelligence Design of Rural Bank
Performance Assessment Using Financial Ratio
Analysis. Proceedings of 2018 International
Conference on Information Management and
Technology, ICIMTech 2018, 143–148. https://doi.org/
10.1109/ICIMTech.2018.8528107
McGlothlin, J. P., Srinivasan, H., & Stojic, I. (2019).
Developing enterprise-wide provider analytics.
HEALTHINF 2019 - 12th International Conference on
Health Informatics, Proceedings; Part of 12th
International Joint Conference on Biomedical
Engineering Systems and Technologies, BIOSTEC
2019, 135–146. https://doi.org/10.5220/000756860
1350146
Moher, D., Liberati, A., Tetzlaff, J., Altman, D. G., Altman,
D., Antes, G., Tugwell, P. (2009, July). Preferred
reporting items for systematic reviews and meta-
analyses: The PRISMA statement. PLoS Medicine,
Vol. 6. https://doi.org/10.1371/journal.pmed.1000097
Montaser, A., & Montaser, A. (2017). Web-based
integrated project controls system. ISARC 2017 -
Proceedings of the 34th International Symposium on
Automation and Robotics in Construction, 1061–1068.
https://doi.org/10.22260/isarc2017/0146
Mumford, E. (1994). New treatments or old remedies: is
business process reengineering really socio-technical
design? Journal of Strategic Information Systems, 3(4),
313–326. https://doi.org/10.1016/0963-8687(94)
90036-1
Nissen, H. E., Bednar, P., & Welch, C. (2007). Double helix
relationships in use and design of informing systems:
Lessons to learn from phenomenology and
hermeneutics. Informing Science, 10, 1–19.
https://doi.org/10.28945/460
Noonpakdee, W., Khunkornsiri, T., Phothichai, A., &
Danaisawat, K. (2018). A framework for analyzing and
developing dashboard templates for small and medium
enterprises. 2018 5th International Conference on
Industrial Engineering and Applications, ICIEA 2018,
479–483. https://doi.org/10.1109/IEA.2018.8387148
Pa, N. C., Karim, F., & Hassan, S. (2017). Dashboard
system for measuring green software design.
Proceeding - 2017 3rd International Conference on
Science in Information Technology: Theory and
Application of IT for Education, Industry and Society in
Big Data Era, ICSITech 2017, 2018-January, 325–329.
https://doi.org/10.1109/ICSITech.2017.8257133
Padilla, L. (2018). How do we know when a visualization
is good? Perspectives from a cognitive scientist.
Retrieved May 6, 2021, from https://medium.com/
multiple-views-visualization-research-explained/how-
do-we-know-when-a-visualization-is-good-c894b5194
b62
Raudberget, D., Ström, M., & Elgh, F. (2018). Supporting
innovation and knowledge transfer from individual to
corporate level. International Conference on
Transdisciplinary Engineering (TE2018), 7, 576–
585.https://doi.org/10.3233/978-1-61499-898-3-576
Saha, S., Shekhar, S., Sadhukhan, S., & Das, P. (2018). An
analytics dashboard visualization for flood decision
support system. Journal of Visualization, 21(2), 295–
307. https://doi.org/10.1007/s12650-017-0453-3
Sarcevic, A., Marsic, I., & Burd, R. S. (2018). Dashboard
design for improved team situation awareness in time-
critical medical work: Challenges and lessons learned.
In Designing Healthcare That Works: A Sociotechnical
Approach (pp. 113–131). https://doi.org/10.1016/
B978-0-12-812583-0.00007-9
Sarikaya, A., Correll, M., Bartram, L., Tory, M., & Fisher,
D. (2019). What do we talk about when we talk about
Exploring Dashboards as Socio-technical Artifacts: Literature Review-based Insights
217

dashboards? IEEE Transactions on Visualization and
Computer Graphics, 25(1), 682–692. https://doi.org/
10.1109/TVCG.2018.2864903
Sarker, S., Chatterjee, S., Xiao, X., & Elbanna, A. (2019).
The sociotechnical axis of cohesion for the IS
discipline: Its historical legacy and its continued
relevance. MIS Quarterly: Management Information
Systems, 43(3), 695–719. https://doi.org/10.25300/
MISQ/2019/13747
Scacchi, W. (2004). Socio-Technical Design. In W. S.
Bainbridge (Ed.), The Encyclopedia of Human-
Computer Interaction. Berkshire Publishing Group.
Schöffel, S., Weibell, G., & Schwank, J. (2018). A Novel
Concept for a Collaborative Dashboarding Framework.
Advances in Intelligent Systems and Computing, 592,
20–31. https://doi.org/10.1007/978-3-319-60366-7_3
Simonsen, J., & Robertson, T. (Eds.). (2013). International
Handbook of Participatory Design (1st ed.). Routledge.
Snyder, H. (2019). Literature review as a research
methodology: An overview and guidelines. Journal of
Business Research, 104, 333–339. https://doi.org/10.
1016/j.jbusres.2019.07.039
Steenkamp, L. P., Hagedorn-Hansen, D., & Oosthuizen, G.
A. (2017). Visual Management System to Manage
Manufacturing Resources. Procedia Manufacturing, 8,
455–462. https://doi.org/10.1016/j.promfg.2017.02.
058
Telaga, A., Librianti, A. F., & Umairoh, U. (2019). Sales
prediction of Four Wheelers Unit (4W) with seasonal
algorithm Trend Decomposition with Loess (STL) in
PT. Astra International, Tbk. IOP Conference Series:
Materials Science and Engineering, 620(1), 012112.
https://doi.org/10.1088/1757-899X/620/1/012112
Trist, E., & Bamforth, K. (1951). Some social and
psychological consequences of the longwall method of
coal getting. Human Relations, 4(1), 3–38.
https://doi.org/10.1177/001872675100400101
Utrilla, P. N. C., Górecki, J., & Maqueira, J. M. (2020).
Simulation-based management of construction
companies under the circular economy concept-Case
study. Buildings, 10(5), 94. https://doi.org/10.3390/
BUILDINGS10050094
Vazquez-Ingelmo, A., Garcia-Penalvo, F. J., & Theron, R.
(2019). Information Dashboards and Tailoring
Capabilities-A Systematic Literature Review. IEEE
Access, Vol. 7, pp. 109673–109688.
https://doi.org/10.1109/ACCESS.2019.2933472
Vilarinho, S., Lopes, I., & Sousa, S. (2017). Design
Procedure to Develop Dashboards Aimed at Improving
the Performance of Productive Equipment and
Processes. Procedia Manufacturing, 11, 1634–1641.
https://doi.org/10.1016/j.promfg.2017.07.314
Wexler, S., Shaffer, J., & Cotgreave, A. (2017). The Big
Book of Dashboards: Visualizing Your Data Using
Real-World Business Scenarios. Wiley.
Wibowo, S., Andreswari, R., & Hasibuan, M. A. (2018).
Analysis and design of decision support system
dashboard for predicting student graduation time.
International Conference on Electrical Engineering,
Computer Science and Informatics (EECSI), 2018-
October, 684–689. https://doi.org/10.1109/EECSI.
2018.8752876
Yusof, E. M. M., Othman, M. S., & Yusof, A. R. M. (2018).
Operational dashboard: Accelerator for shop floor
workers. International Journal of Engineering and
Technology (UAE), 7(2), 4–6. https://doi.org/10.14419/
ijet.v7i2.29.13115
Zajec, S., Mrsic, L., & Kopal, R. (2021). Managing human
(social) capital in medium to large companies using
organizational network analysis: Monoplex network
approach with the application of highly interactive
visual dashboards. Advances in Intelligent Systems and
Computing, 1166, 937–945. https://doi.org/10.1007/
978-981-15-5148-2_81
E-DaM 2021 - Special Session on Empowering the digital me through trustworthy and user-centric information systems
218
