
Feasibility Study of an Image-based Supporting System for Sprint
Training
Shiho Hanashiro
1
, Motoki Takematsu
1
and Ryusuke Miyamoto
2
1
Department of Computer Science, Graduate School of Science and Technology, Japan
2
Department of Computer Science, School of Science and Technology,
Meiji University, 1-1-1 Higashimita, Tama-ku, Kawasaki-shi, Japan
Keywords:
Stride Length, Stride Frequency, Velocity, Color Processing, Location Estimation.
Abstract:
This study focuses on developing a novel system to improve the performance of short-distance races, where
stride length, stride frequency, and maximum velocity are important factors. To estimate stride length and
stride frequency, color-based image processing is adopted to extract the feet of a runner, based on cosine
similarity in the RGB color space. The experimental results indicate that the stride length and stride frequency
could be estimated with negligible errors. To estimate the running velocity; visual object detection, and pose
estimation based on state-of-the-art deep learning schemes were applied: RetinaNet for visual object detection,
and OpenPose for pose estimation. The experimental results using the real image dataset, indicated that the
estimation error of the velocity by the proposed scheme was quite negligible.
1 INTRODUCTION
Recently, video-based analysis has become popu-
lar in several kinds of sports: tactical analysis for
team sports, and form analysis for personal sports.
These analyses enable not only player performance
improvement, but also novel presentations to audi-
ences who are not experts. The significant merit of the
video-based analysis can be summarized as follows:
lower prices of sensing systems and more sources for
analysis. Video-based analysis only requires visible
cameras as sensors whose prices are quite lower than
other sensing devices and enables analysis using even
visual information used for TV broadcasting.
This study focuses on performance improvement
for short-distance races, where stride length, stride
frequency, and maximum velocity are important fac-
tors using only visual information obtained by RGB
cameras. Specifically, maximum velocity has a pow-
erful effect on the time of short-distance races (Mat-
suo et al., 2016). The aim of this study is to actualize
a supporting system, which can be utilized in daily
training to improve the performance of short-distance
races.
To measure the running velocity of a human, two
types of sensors are widely used: photoelectric sen-
sors and Doppler radar. When using photoelectric
sensors to measure the running velocity, several sen-
sors should be set along a running course. A Doppler
radar can measure the running velocity using only a
device, but it is expensive. Accordingly, the most sig-
nificant problem with existing devices for measuring
the running velocity is the price of the system. For ex-
ample, the OptJump(MICROGATE, 2011) can mea-
sure stride frequency and stride length, but its price is
too expensive for general uses by amateur players.
The authors are trying to construct a more cost-
effective system to measure stride frequency, stride
length, and running velocity, to make computer as-
sisted training popular for several people. In our ap-
proach, only visible imaging sensors were utilized to
obtain information about the target humans. Using
this approach, the system cost is expected to become
much cheaper than existing systems that use expen-
sive sensors.
In the proposed scheme, after acquisition of an im-
age sequence including a target human, visual object
detection and pose estimation based on a deep neural
network are applied to estimate the running velocity.
RetinaNet(Lin et al., 2017) and Open Pose(Cao et al.,
2017) were adapted for detection and pose estimation,
respectively. To measure stride frequency and stride
length, the feasibility of color-based image process-
ing was evaluated using actual images.
Hanashiro, S., Takematsu, M. and Miyamoto, R.
Feasibility Study of an Image-based Supporting System for Sprint Training.
DOI: 10.5220/0010713500003059
In Proceedings of the 9th Inter national Conference on Sport Sciences Research and Technology Support (icSPORTS 2021), pages 151-156
ISBN: 978-989-758-539-5; ISSN: 2184-3201
Copyright
c
2021 by SCITEPRESS – Science and Technology Publications, Lda. All rights reserved
151

2 RELATED WORK
This section explains Open Pose(Cao et al., 2021) and
RetinaNet(Lin et al., 2017) adopted in our research.
2.1 Open Pose
The bottom-up approach that extracts body parts of
a human from input image and makes most possible
connections among the extracted parts shows good
performance for human pose estimation. However
sometimes global connections of local parts are not
used and the computationalamount becomes too large
owing to the largest number of combinations of body
parts to be connected(Pishchulin et al., 2016; Insafut-
dinov et al., 2016).
To solve the global connection problem, Cao et
al.(Cao et al., 2017) proposed a novel convolutional
neural network (CNN) architecture. The architec-
ture adopts detection of body parts using confidence
maps, and part affinity fields (PAFs) that estimates the
connection between two body parts. The computa-
tional problem is solved by transforming a complete
graph into several bipartite graphs, and applying the
greedy algorithm to compute. The greedy algorithm
may worsen the accuracy, but the global context from
confidence maps and PAFs helps to maintain it. Ac-
cordingly, real-time processing with high accuracy is
achieved: the Open Pose shows good performance for
the MPII multi-person dataset(Andriluka et al., 2014)
and the COCO key points challenge(Lin et al., 2014).
2.2 RetinaNet
RetinaNet(Lin et al., 2017) comprises a backbone net-
work that extracts features from an input image, and
two subnetworks that localize target objects and es-
timate their classes. This method attempts to solve
the class imbalance problem between foreground and
background pixels using a novel loss function called
Focal Loss, which reduces the influence of easy nega-
tives in the training process. Consequently, the detec-
tion accuracy of RetinaNet outperforms that of two-
stage detectors. The following equations represent the
focal loss adopted in RetinaNet, and the widely used
cross-entropy loss:
FocalLoss(p
t
) = −(1− p
t
)
γ
log(p
t
),
CrossEntropyLoss(p
t
) = log(p
t
).
3 ESTIMATION OF STRIDE
FREQUENCY AND STRIDE
LENGTH BASED ON COLOR
IMAGE PROCESSING
In this section, we explain the estimation of the stride
frequency and stride length. The stride frequency
is defined as the number of steps taken in a given
amount of time. Strictly, stride length refers to the
moving distance of the mass center during one run-
ning stride. In this study, stride length is approxi-
mated by the length between the landing points of the
foot. Fig. 1 illustrates an example of the landing point
of the foot.
The proposed scheme implemented and tested in
this article comprises the following processes:
1. Detection of the landing point,
2. Determining the landing moment,
3. Computation of stride frequency, and
4. computation of stride length.
The rest of this section details these processes.
3.1 Detection of the Landing Point
First, the foot of the target human was extracted by
the color of their shoes. In this process, the similar-
ity of color is measured by cosine similarity in the
RGB color space. After similarity computation, sim-
ple thresholding was applied to extract the pixels cor-
responding to the shoes. To determine a frame when
the foot just lands, a frame where the foot is located
becomes the lowest in several frames. In the real im-
age of the sprint, the location of the foot increases and
decreases, as illustrated in Fig. 2. The movement of
the foot can be plotted on a graph, as illustrated in
Fig. 3.
3.2 Determining the Landing Moment
As described in the previous subsection, Fig. 3 illus-
trates the movementof the foot, where the vertical and
horizontal axes represent the vertical coordinate of the
foot and the frame number, respectively. In Fig. 3, the
flat frames during the two peaks indicate that the foot
makes contact with the ground plane. It starts when
the foot has just landed on the ground, and ends when
the foot has just left the ground.
The proposed scheme determines the beginning
point of contact between the foot and the ground, ac-
cording to the vertical coordinate of the foot; the pre-
vious frame when the vertical coordinate becomes ap-
proximately constant. Similarly, the end point of the
icSPORTS 2021 - 9th International Conference on Sport Sciences Research and Technology Support
152
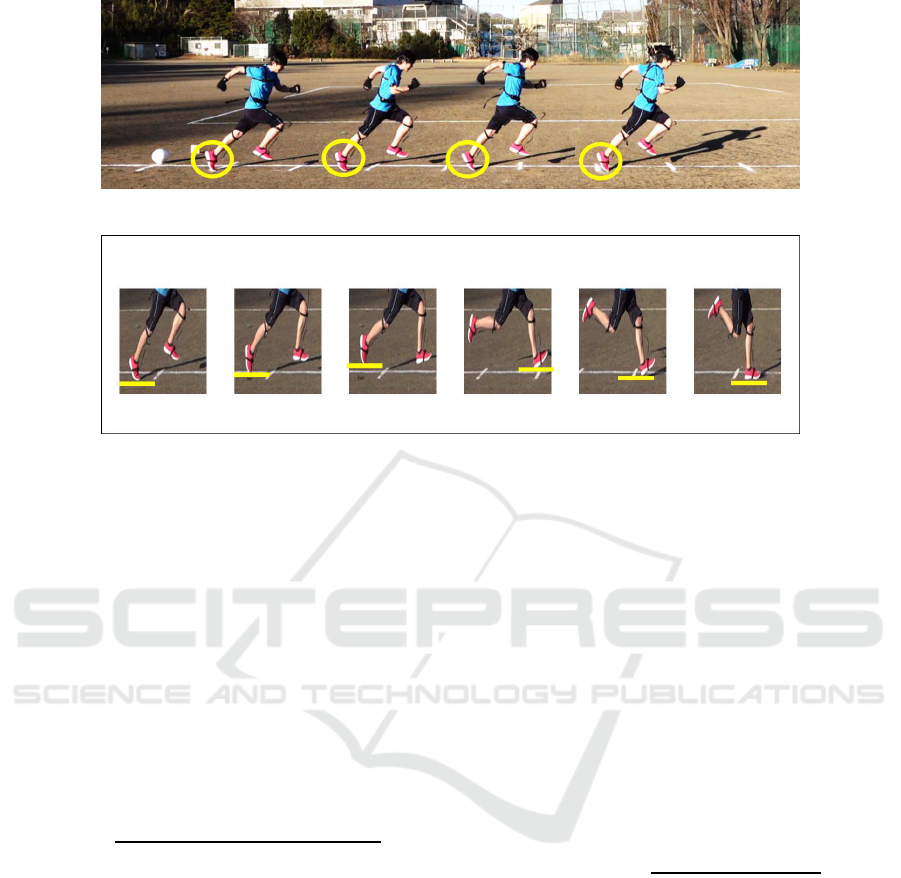
Figure 1: Landing points of the foot.
Figure 2: Movement of the foot location in the real image.
contact can be obtained as the frame, when the verti-
cal coordinate is different from that of the beginning
point. In these processes, the landing moment of the
foot can be determined.
3.3 Computation of Stride Frequency
The stride frequency (SF) can be calculated by count-
ing the number of frames between the landing mo-
ment determined by the previous operation. Fig. 4
illustrates examples of the computation of the stride
frequency.
SF(step/s) =
FPS(frame/s)
no of frames per step(frame/step)
(1)
3.4 Computation of Stride Length
In the proposed scheme, the stride length (SL) was
computed using two end points of foot landing. To es-
timate the length of the actual space, white lines were
drawn at one-meter intervals, as illustrated in Fig. 1.
These white lines provide a relation between the pix-
els and the actual length between them. Finally, we
can compute SL based on the number of pixels be-
tween the two end points of foot landing.
SL(cm) = Coordinate(pixel) × Length(cm/pixel) (2)
4 VELOCITY ESTIMATION BY
OBJECT DETECTION AND
POSE ESTIMATION
The proposed scheme estimates velocity of a target
human, using object detection by RetinaNet(Lin et al.,
2017) and pose estimation by OpenPose(Cao et al.,
2021). The RetinaNet-based object detector extracts
a boundingbox surroundinga target runner and Open-
Pose estimates the location of the waist in the ex-
tracted bounding box.
Once the locations of the waist are in two arbi-
trary frames, the velocity of the target runner can be
computed using the following equation:
v
pred
[
cm/s
] =
l
pred
[
pixel
] · α[
cm/pixel
]
t[
frame
]/120[
f ps
]
, (3)
where l, α, and t represent the moving length of
the waist, the distance per pixel, and the number of
frames adopted in the velocity computation.
Fig. 5 illustrates the parameters adopted in the ve-
locity estimation, the red line represents the motion
of the waist, the numerical value with “cm” at the bot-
tom right represents moving distance, and the numeri-
cal value with “frame” indicates the number of frames
used in the estimation.
5 EVALUATION
This section describes the dataset utilized in the eval-
uation, and how to evaluate the performance of esti-
Feasibility Study of an Image-based Supporting System for Sprint Training
153
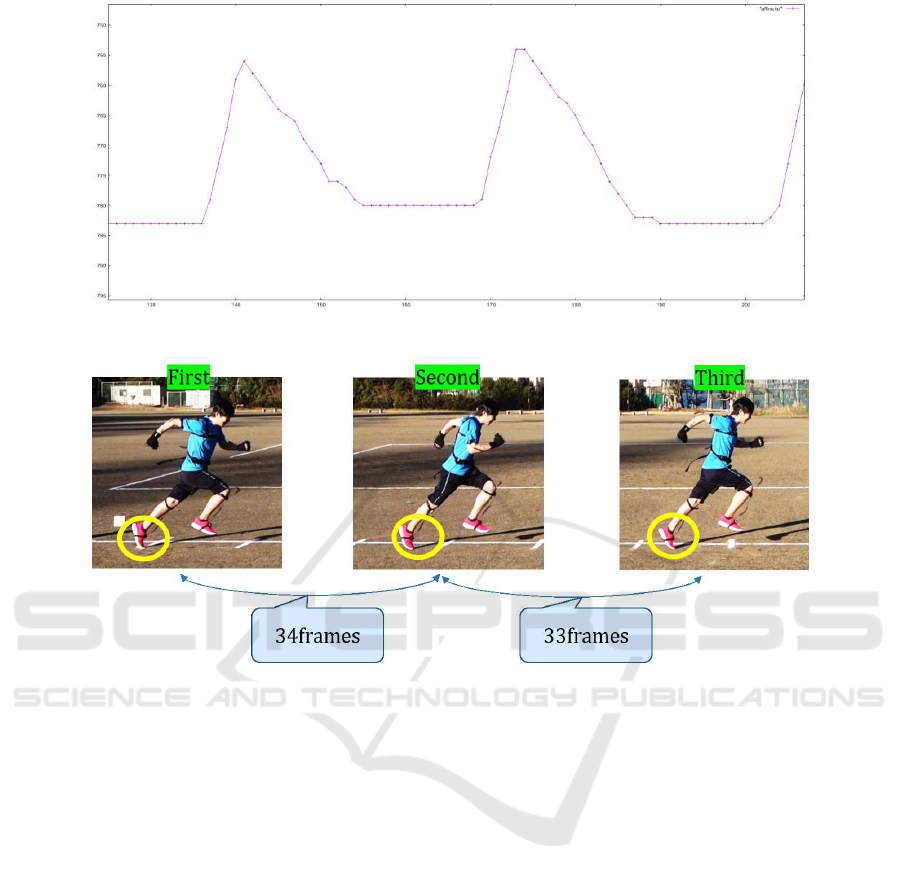
Figure 3: Movement of the location plotted as a graph.
Figure 4: How to compute stride frequency. The number of frames corresponding to the same pose is counted. In this example,
34 and 33 frames are spent for the first and the second cycle, respectively.
mating the stride frequency (SF), stride length (SL),
and velocity.
5.1 Dataset
A dataset was created using an actual video sequence,
to evaluate the performance of the proposed scheme.
In the video, the runner wore pink shoes for color
processing. It is difficult to make a correspondence
between the actual length, and pixels in the captured
images, white lines were drawn at one-meter inter-
vals on the ground. A camera to record a video was
located at approximately ten meters from the running
course. The height of the camera was 1.5 m. The res-
olution and frame rates were 1920 × 1080 pixels and
60 frames per second, respectively. Fig 6 illustrates an
example shot of the dataset using actual images. For
the evaluation of only SF and SL, a dataset based on
synthetic images was created, a CG-based dataset was
generated using Unreal Engine 4 (UE4) as illustrated
in Fig. 7.
5.2 Image Calibration before
Evaluation
When measuring the moving length in an actual space
using a captured image, image calibration is per-
formed to obtain the relationship between the length
in the actual three-dimensional space and the image
plane. Accordingly, a white line at one-meter inter-
vals was used; hence pixels between two adjacent
lines were measured manually. Once the number of
pixels corresponding to 1 m in the actual space was
obtained, calibration could be easily performed.
5.3 Estimation of SF and SL
Tables 1 and 2 presents the errors in SF for the CG-
based and real datasets, respectively. For the CG-
based dataset, the actual ground truth was obtained
from the locations of the human model utilized in data
generation. For the real dataset, the ground truth was
created manually. Evidently, the error values some-
times became larger in the CG-based dataset, but they
icSPORTS 2021 - 9th International Conference on Sport Sciences Research and Technology Support
154
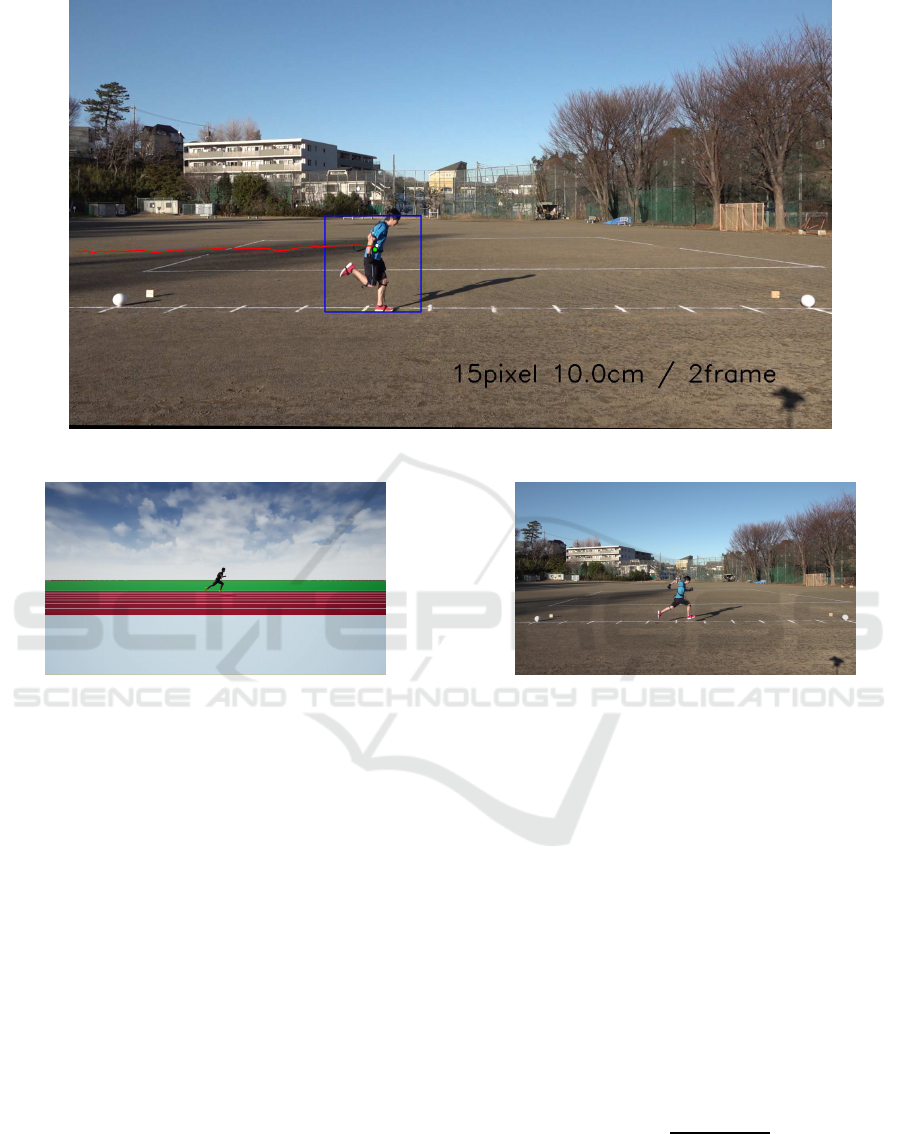
Figure 5: Example of output in velocity estimation.
Figure 6: CG-based dataset generated using UE4.
were not as large in the real dataset. Table 3 presents
the estimation errors of SL in the real dataset. This
seems good because the largest error was 1.25 cm.
5.4 Velocity Estimation
To evaluate the estimation performance of velocity,
the following two criteria were evaluated.
5.4.1 Estimation Error of Distance
Before evaluating the velocity estimation, the estima-
tion error of the distance is based on two key frames
for velocity evaluation. The estimation error is com-
puted using the following equation:
error
l
= |l
true
− l
pred
|, (4)
where l
true
and l
pred
represent distance between key
frames in the ground truth, and is computed by the
estimated locations of the waist, respectively.
Ground truth should have been created using
highly accurate sensors, but they were created man-
Figure 7: Dataset comprising actual images.
ually. We have attempted to use Perception Neu-
ron(NOITOM,2018), which is one of the most widely
used motion capture systems, but it did not work effi-
ciently.
Table 4 presents the distance error while changing
the number of frames adopted to compute this error.
The results show that the proposed scheme can esti-
mate the distance between two key frames with small
error values.
5.4.2 Estimation Error of Velocity
To evaluate the estimation error of velocity, the er-
rors in the distance obtained, as presented in Table 4
were divided by the number of frames between two
key frames, as indicated in the following equation:
error
v
=
|l
true
− l
pred
|
t/120
. (5)
Table 5 presents the estimation errors for velocity
when the number of frames between two key frames
is adopted for measuring the velocity. The estima-
tion error seemed good because the error value was
Feasibility Study of an Image-based Supporting System for Sprint Training
155

Table 1: Stride frequency(UE4).
steps 1 2 3 4 5 6 7 8 9 10 11
error(step/s) 0.21 0.01 0.16 0.01 0.21 0.01 0.01 0.01 0.43 0.32 0.21
Table 2: Stride frequency(Real image).
steps 1 2 3 4 5 6
error(step/s) 0.1478 0.1961 0.1137 0.1009 0.1209 0.0000
Table 3: Stride length(Real image).
steps(cm) 1 2 3 4 5 6
error(cm) 1.25 0.62 0.55 0.08 0.62 0.55
Table 4: Estimation errors of distance.
frame 2 10 30 60 120
error[cm] 1.14 1.85 2.50 2.10 1.90
approximately 1.9 cm/s. However, the smaller the
number of frames, the larger the error. If we want
to estimate the velocity at short sections, the estima-
tion error of the distance must become negligible, to
obtain practical values for velocity estimation.
Table 5: Speed error.
frame 2 10 30 60 120
error[cm/s] 68.5 22.2 10.0 4.2 1.9
6 CONCLUSION
This paper proposes a novel scheme for support-
ing sprint training using image processing alone.
The proposed scheme estimates the stride frequency
(SF) and stride length (SL) using color processing,
based on the cosine similarity between shoes and the
ground. Experimental results indicated that SF and
SL could be estimated with negligible errors. To esti-
mate the running velocity, visual object detection and
pose estimation based on state-of-the-art deep learn-
ing schemes were applied, RetinaNet for visual object
detection, and OpenPose for pose estimation. The ex-
perimental results using the real image dataset indi-
cated that the distance error of the proposed scheme
was negligible. However, it may be insufficient for
measuring velocity in very short sections. To improve
the estimation accuracy furthermore, the accuracy of
image-based localization should be improved.
REFERENCES
Andriluka, M., Pishchulin, L., Gehler, P., and Schiele, B.
(2014). 2D human pose estimation: New benchmark
and state of the art analysis. In Proc. IEEE Conf. Com-
put. Vis. Pattern Recognit.
Cao, Z., Hidalgo, G., Simon, T., Wei, S.-E., and Sheikh, Y.
(2021). Openpose: Realtime multi-person 2D pose es-
timation using part affinity fields. IEEE Trans. Pattern
Anal. Mach. Intell., 43(1):172–186.
Cao, Z., Simon, T., Wei, S., and Sheikh, Y. (2017). Real-
time multi-person 2d pose estimation using part affin-
ity fields. In Proc. IEEE Conf. Comput. Vis. Pattern
Recognit., pages 1302–1310.
Insafutdinov, E., Pishchulin, L., Andres, B., Andriluka, M.,
and Schiele, B. (2016). Deepercut: A deeper, stronger,
and faster multi-person pose estimation model. In
Proc. European Conference on Computer Vision,
pages 34–50.
Lin, T.-Y., Goyal, P., Girshick, R., He, K., and Doll´ar, P.
(2017). Focal loss for dense object detection. In Proc.
IEEE Int. Conf. Comput. Vis., pages 2980–2988.
Lin, T.-Y., Maire, M., Belongie, S., Hays, J., Perona, P.,
Ramanan, D., Doll´ar, P., and Zitnick, C. L. (2014).
Microsoft COCO: Common objects in context. In
Fleet, D., Pajdla, T., Schiele, B., and Tuytelaars, T.,
editors, Proc. European Conference on Computer Vi-
sion, pages 740–755, Cham. Springer International
Publishing.
Matsuo, A., Hirokawa, R., Yanagiya, T., Matsub-
ayashi, T., Takahashi, K., Kobayashi, K., and
Sugita, M. (2016). Speed and pitch-stride anal-
ysis for men’s and woman’s 100m in the 2016
season and all seasons(in japanese). 12:74–
83. jaaf.or.jp/pdf/about/publish/2016/2016-074-
83pdf.pdf.
MICROGATE (2011). Optojumpnext.
https://training.microgate.it/en/products/optojump-
next.
NOITOM (2018). Perception neuron 2.0.
https://neuronmocap.com/.
Pishchulin, L., Insafutdinov, E., Tang, S., Andres, B., An-
driluka, M., Gehler, P. V., and Schiele, B. (2016).
Deepcut: Joint subset partition and labeling for multi
person pose estimation. In Proc. IEEE Conf. Comput.
Vis. Pattern Recognit., pages 4929–4937.
icSPORTS 2021 - 9th International Conference on Sport Sciences Research and Technology Support
156
