
Analysis of Water Environment Status and Pollution Source at Plain
River Network Area
Yutong Zhang
1
, Qichen Li
2
, Changlin Du
3
, Minggang Peng
3
, Zhiwen Li
3
, and Min Wang
1,*
1
Institute of Water Resources and Hydro-Electric Engineering, Xi'an University of Technology, Xi' an, 710048, China
2
Changqing Oilfifld Company Oil Production Plant NO.10, Qingyang, Gansu 745100, China
3
China Power Construction Railway Construction Investment Group Co., Ltd, Beijing, 100070, China
Keywords: Plain River network area, Water Environment, Pollution source analysis
Abstract: The construction of clean small watersheds for the "Diversion from the River to the Nest" project requires
an analysis of the current water quality of the plain river network area. This study aimed at the typical plain
river network basin—Zhaohe River Basin, analyzed the current water quality in the basin and the sources of
pollutants in the basin and used the WQI model to evaluate the water quality pollution status of the whole
basin.So as to provides references for water pollution control and clean construction projects in plain river
network areas.The results show that the water quality of 2/3 of the tributaries in the basin is at or inferior to
Grade V, the main influencing factors are TN and TP. Pollutants mainly come from non-point source
pollution in the process of agricultural production in the basin. Livestock and poultry breeding contribute
the least to TN pollution, and rural life pollution contributes the least to TP pollution.
1 INTRODUCTION
The typical plain river network area is characterized
by abundant rainfall, gentle terrain, dense river
network, warm and humid climate, and developed
agriculture and livestock and poultry breeding
industries
(Shen, 2015). A large number of pollutants
produced by agriculture and livestock and poultry
breeding will be concentrated in the surface layer of
the soil (Zhang, 2010), and enter ditches or rivers
with rainfall runoff. However, the flat terrain in the
plain river network area and the slow flow of the
river can easily cause the wild growth of algae and
cause the eutrophication of the water body (Zhong et
al., 2021).
Chaohu Lake Basin has been in a state of
alternating light to moderate pollution in recent years,
and the water quality of lakes in the middle and
lower reaches of the country (Zhang et al., 2020).
Zhaohe River is one of the main inflows of Chaohu
Lake and the main trunk line of " bringing the river
to Chaohu". The river network is dense and belongs
to a typical plain river network area in my country
(Wang et al., 2019). Therefore, this article takes the
Zhaohe River Basin as the research object, analyzes
the water pollution status in the basin, identifies the
main sources of pollutants in the basin and key areas
where pollutants are generated, and provides
references for water pollution control and clean
construction projects in plain river network areas.
Figure 1: Location and water system map.
Zhang, Y., Li, Q., Du, C., Peng, M., Li, Z. and Wang, M.
Analysis of Water Environment Status and Pollution Source at Plain River Network Area.
In Proceedings of the 7th International Conference on Water Resource and Environment (WRE 2021), pages 453-457
ISBN: 978-989-758-560-9; ISSN: 1755-1315
Copyright
c
2022 by SCITEPRESS – Science and Technology Publications, Lda. All rights reserved
453
2 OVERVIEW OF THE
RESEARCH AREA
Zhaohe River Basin is located in Lujiang County,
Anhui Province, China, in the south of Jianghuai
hills, near Chaohu Lake in the north, and near the
Yangtze River in the south belonging to the Yangtze
River system. The main rivers in the basin include
11 rivers including Zhaohe, Xianhe, Xihe,
Huangnihe and Wayanghe etc. The specific location
of the basin and the distribution of river channels are
shown in Figure 1. The study basin belongs to the
northern subtropical monsoon region, with a mild
and humid climate and four distinct seasons; the
average annual rainfall is 1464mm, the precipitation
is unevenly distributed during the year, and the
phenomenon of plum rain and summer drought is
obvious; the south wind is dominant in summer, and
the north wind is dominant in winter.
3 DATA COLLECTION AND
RESEARCH METHODS
3.1 Data Collection
The main water quality in the basin was collected
and analyzed in the main tributaries (11 tributaries)
and the main stream in the basin from 2018 to 2019.
Based on a preliminary analysis, the most prominent
type of pollution exceeding the standard in the basin
is total nitrogen, followed by total phosphorus.
Therefore, each sample mainly analyzed water
quality indicators such as total nitrogen, total
phosphorus, ammonia nitrogen and chemical oxygen
demand. And in accordance with the "
Environmental quality standards for surface water"
(GB3838-2002) to evaluate the current water quality
in the study area (Ministry of Environmental
Protection, 2002).
3.2 Research Methods
The water quality index is a normalized
dimensionless number that integrates multiple water
quality parameters. The parameters to be considered
depend on the use of water. The water quality
parameters usually considered include DO, BOD
5
,
COD, pH, SS, NH
3
-N, TN and TP etc. (Zhao et al.,
2020). This paper mainly uses the WQI model to
evaluate the water quality pollution status of the
whole basin, selects 6 water quality parameters of
water body DO, BOD5, COD, pH, SS, NH
3
-N, and
transforms these water quality parameter variables
according to the classification index function (SI).
As a non-spatial variable, the SI calculation formulas
for different parameters are shown in Table 1.
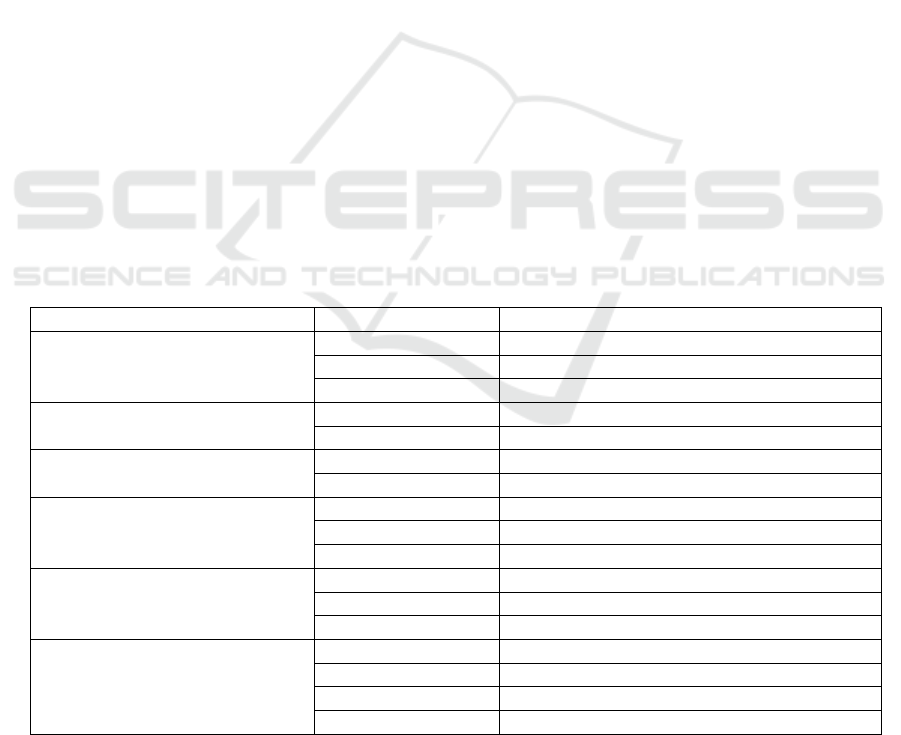
Table 1: The sub-index equations for WQI.
Water quality parameters Value Categorical exponential function
DO
X≤8 SI
DO
=0
8<X<92 SI
DO
=-0.395+0.03X
3
-0.0002X
3
X≥92 SI
DO
=100
BOD
5
X≤5 SI
BOD5
=100.4-4.23X
X>5 SI
BOD5
=(108e
-0.055X
)-0.1X
COD
X≤20 SI
COD
=99.1-1.33X
X>20 SI
COD
=(103e
-0.0157X
)-0.04X
NH
3
-N
X≤0.3 SI
NH3-N
=100.5-105X
0.3<X<4 SINH3-N=(94e
-0.573X
)-51X-21
X≥4 SI
NH3-N
=0
SS
X≤100 SI
SS
=(97.5e
-0.00676X
)+0.05X
100<X≤1000 SI
SS
=(71e
-0.0016X
)+0.015
X≥1000 SI
SS
=0
pH
X<5.5 SI
pH
=17.2-17.2X+5.02X
2
5.5≤X<7 SI
pH
=242+95.5X-6.67X
2
7≤X<8.75 SI
pH
=-181+82.4X-6.05X
2
X≥8.75 SI
pH
=536-77X+2.76X
2
Note: The variable unit represented by X is mg/L, where pH is dimensionless
WRE 2021 - The International Conference on Water Resource and Environment
454
WQI model calculation formula:
WQI=0.22SI
DO
+0.19SI
BOD5
+0.16SI
COD
+0.15SI
NH
3-N
+0.16SI
SS
+0.12SI
pH
In the formula: SI stands for classification index.
According to the input water quality test data of the
model, the water quality of the sampling points is
normalized to between 0 and 100, and according to
the degree of water pollution, the water quality is
divided into 6 categories from 0 to 100,
corresponding to severe pollution (<31.0), pollution
(31.0-51.9), light pollution (51.9-76.5), better
(76.5-92.7) and good (>92.7).
4 RESULTS AND ANALYSIS
4.1 Analysis of the Current Situation of
the Water Environment of the
Zhaohe River
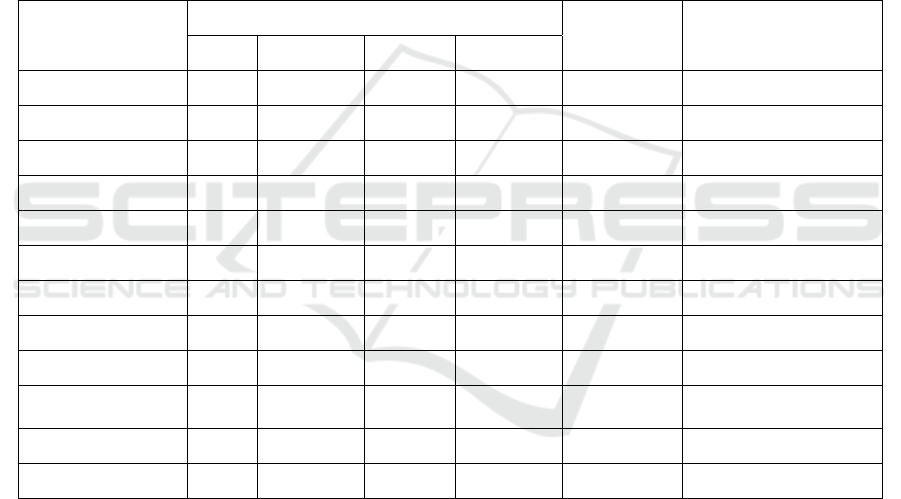
It can be seen from Table 2 that the pollution
situation in the study area is relatively serious.
Two-thirds of the rivers have water quality of V or
worse. Only the quality of Wayang River, Shungang
River and Zhaohe River is in good condition, which
can meet the requirements of clean watershed and
the goal of construction (quality of III). TN in the
study area is the main pollutant exceeding the
standard, after it is TP.
Table 2: Evaluation of water environment status of main polluted rivers in the study area.
River monitoring
point
Detection Indicator(mg/L)
Water quality
category
Substances and
multiples that exceed
the standard (Class Ⅲ)
TN TP NH
3
-N COD
CR
Shicaohe river 3.02 0.11 0.65 5.85 worse than Ⅴ TN (2.02)
Huangtunhe river 1.85 0.29 1.19 19.62 Ⅴ TN (0.85)TP (0.45)
Wayanghe river 0.97 0.06 0.29 10.12 Ⅱ ——
Huangnihe river 3.18 0.29 1.89 27.38 worse than Ⅴ TN (2.18) TP (0.45)
Shunganghe river 0.52 0.07 0.10 12.67 Ⅲ ——
Peihe river 4.01 0.35 3.05 38.6 worse than Ⅴ TN (3.01) TP (1.75)
Dongdawei river 1.79 0.19 1.47 21.83 Ⅴ TN (0.79)
Xidawei river 1.12 0.14 0.61 20.4 Ⅳ TN (0.12)
Shengqiaohe river 2.38 0.23 1.61 24.89 worse than Ⅴ TN (1.38) TP (0.15)
Mainstream of the
West Rive
r
1.85 0.18 1.32 27 Ⅴ TN (0.85)
Xian he river 4.70 0.57 3.47 24.92 worth than Ⅴ TN (3.70) TP (1.85)
Upper Zhaohe river 1.02 0.19 0.34 29 Ⅲ ——
Analyzing the monthly changes of TN and TP in
the main stream waters in the study area (Figures 2
and 3), it can be seen that the main stream has
serious total nitrogen pollution, and the water quality
is inferior to V. The highest concentration peak
appeared in August 2016 which reached 2.6 times of
the water quality of V. With the artificial treatment of
water bodies, the TP concentration began to decline
after mid-2017; the TP content of water bodies is
relatively low, and most of them meet the
requirements of II water quality standards, but do not
exceed the III water standards.
4.2 Analysis of Pollution Sources in the
Basin
The TP emission in the study area is about 7,996
tons/year, and the TN and NH
3
-N emissions are
7,907 tons/year and 1,299 tons/year, respectively
(Table 3), which puts greater pressure on the water
environment of the basin.
According to the research of Wang et al. (2019),
TN and TP in the Zhaohe River Basin mainly come
from agricultural production. According to the
composition of pollution sources in the basin
(Figure 4), agricultural production pollution
Analysis of Water Environment Status and Pollution Source at Plain River Network Area
455
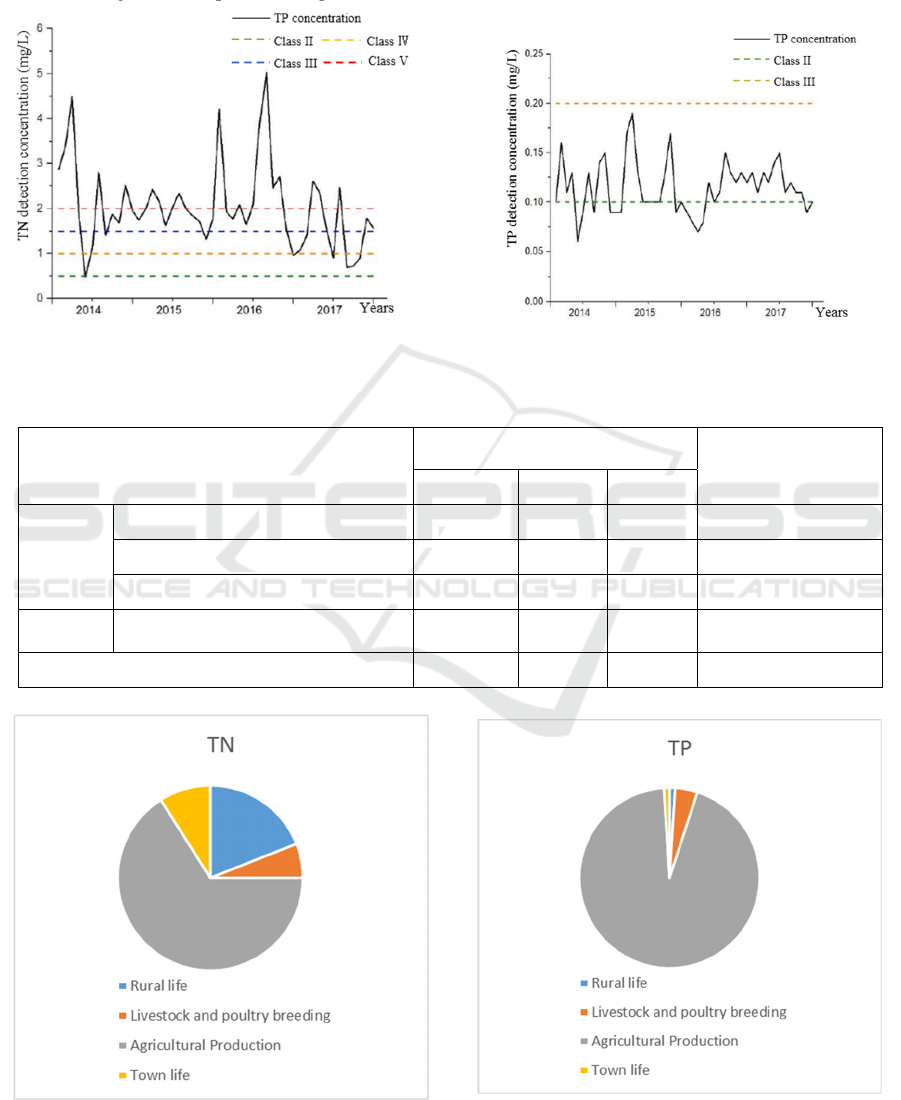
accounts for the largest proportion of TN and TP
sources, reaching 66% and 94% respectively.
Therefore, the pollution control of the watershed in
the study area needs to focus on the prevention and
control of agricultural production pollution. In
addition, the point source pollution of urban life is
the direct source of water pollution, and the amount
of its discharge will directly cause the fluctuation of
the pollutant content in the river, so it also needs
attention.
Figure 2: Monthly change of TN content.
Figure 3: Monthly change of TP content.
Table 3: Current status of nitrogen and phosphorus pollution input in the study area.
Pollution source classification
Input of nitrogen and phosphorus
p
ollution(T/a)
Into the river property
TN TP NH
3
-N
Non-point
source
Rural life 1535.47 71.87 653.39 Access to the river
Livestock and poultry breeding 459.93 345.71 266.74 Access to the river
Agricultural Production 5203.6 7533.18 - Access to the river
Point
source
Town life
Industrial and mining enterprises, etc.
707.99 45.94 378.73 Directly into the river
total 7906.99 7996.70 1298.86 -
Figure 4: The main sources of pollutants in the study area.
WRE 2021 - The International Conference on Water Resource and Environment
456

According to the research of Wang et al. (2019),
TN and TP in the Zhaohe River Basin mainly come
from agricultural production. According to the
composition of pollution sources in the basin (Figure
4), agricultural production pollution accounts for the
largest proportion of TN and TP sources, reaching
66% and 94% respectively. Therefore, the pollution
control of the watershed in the study area needs to
focus on the prevention and control of agricultural
production pollution. In addition, the point source
pollution of urban life is the direct source of water
pollution, and the amount of its discharge will
directly cause the fluctuation of the pollutant content
in the river, so it also needs attention.
5 CONCLUSION
By analyzing the current situation and pollution
sources of the water environment in the Zhaohe
Basin, a typical plain river network basin, the
following research results are obtained: The overall
water quality of the Zhaohe River Basin is poor. Two
thirds of the tributaries have water quality at Class V
or Class inferior Ⅴ. TN and TP are the main
pollutants in the basin. In recent years,
comprehensive improvement projects have been
achieved. With certain results, the water quality of
the basin is gradually improving. From the analysis
of the sources of pollutants, the TN and TP in the
study area mainly come from agricultural production,
and it is necessary to focus on monitoring and
controlling the TN and TP produced in the
agricultural production process.
ACKNOWLEDGEMENTS
This work has been supported by the National
Natural Science Foundation of China (51809211),
the China Postdoctoral Science Foundation
(2018M633548), the Natural Science Foundation of
Shaanxi Province(2019JQ-745) and the Scientific
Research Program Funded by Shaanxi Provincial
Education Department(20JY045).
REFERENCES
Ministry of Environmental Protection. (2002).
Environmental quality standards for surface water.
http://openstd.samr.gov.cn/bzgk/gb/newGbInfo?hcno=
0DB5914A2BE0CB5D4F459544EDC0E09E
Shen, T. (2015). Research on characteristics and control
strategies of non-point source pollution in typical
areas of plain river network in the lower reaches of the
Yangtze River. East China Normal University.
Wang, M. H., Zhou, X. P., Jiao, M., Zhai, M. T., & Xue, W.
Y. (2019). Research on the technical system of
comprehensive management of watershed water
environment: take mega-river basin as an example.
Environmental Engineering, 37(10), 16-22+28.
Zhang, M., Shi, X. L., Yang, Z., & Chen, K. N. (2020).
Analysis of water quality trends and cyanobacteria
prevention and control recommendations for chaohu
lake, 2012-2018. Journal of Lake Sciences, 32(01),
11-20.
Zhang, Q. L. (2010). Qiuling. Simulation of agricultural
non-point source pollution based on SWAT model.
Zhejiang University.
Zhao, S., Ni, Z. K., Huang, D. L., Zhang, B. T., Feng, M.
L., Chen, H. W., & Wang, S. R. (2020). Study on the
water quality evolution trend and driving factors of
Poyang Lake based on WQI method. Acta Scientiae
Circumstantiae, 40(01), 179-187.
Zhong, S. C., Hu, T., Zheng, X. Y., Yao, X. L., Xue, X. H.,
& Zhang, Z. H. (2021). The practice of ecological
restoration of water system in small and medium-sized
basins in plain areas under the background of
ecological civilization. Environmental Ecology, 3(07),
49-55.
Analysis of Water Environment Status and Pollution Source at Plain River Network Area
457
