
To Evaluate the Characteristics of Cloud Parameters Retrieved by
Satellite and Cloud Structure of the Northward Typhoon In-Fa
Xiaorui Zhang
1,2
, Wenxia Yang
1,2,*
, Tuanjie Hou
3
, Zhiqiang Shen
4
,
Shuai Li
4
, Shaoyu Hou
1,2
and
Jing Meng
4
1
Weather Modification Office of Hebei Province, Shijiazhuang 050021, China
2
Key Laboratory of Meteorology and Ecological Environment of Hebei Province, Shijiazhuang 050021, China
3
Institute of Atmospheric Physics, Chinese Academy of Sciences, Beijing 100029, China
4
Qian Xuesen Laboratory, China Academy of Space Technology (CAST), Beijing 100094, China
Keywords: Northward typhoon, Cloud parameters retrieved by Satellite, Cloud structure
Abstract: Cloud parameters retrieved by Satellite and model data with detailed cloud microphysical processes are used
in this paper to conduct a comprehensive analysis of the precipitation process of the northward typhoon "In-
fa" in Hebei Province. The main conclusions are as follows: optical thickness (>20), cloud top temperature (-
10℃~-25℃), and cloud top height (>9km) of cloud characteristics parameters retrieved by FY-2 satellite
(Fengyun meteorological satellite) have obvious indications for the range and intensity of precipitation. The
effective radius of cloud particles needs to be combined with multi-parameter comprehensive analysis.
Satellite monitoring products can be used to compare and correct cloud model forecast products. In the early
stage of the low-pressure precipitation process of this typhoon, cold clouds are thicker, and the content of
hydrometeor and supercooled water in cold clouds are abundant. After 17:00 on the 29th, the hydrometeor
and supercooled water contents of cold clouds have decreased significantly and increased obviously in warm
cloud, the large value center of water content have also decreased, ice crystals number concentration and
snow-graupel mixing ratio have declined, and the main precipitation mechanism changed from cold cloud
precipitation to warm cloud precipitation.
1 INTRODUCTION
As an important observation method, meteorological
satellites can monitor the evolution of the cloud
system on a large scale. The cloud parameters
retrieved by the multi-channel radiation
characteristics of the satellite can not only reflect the
macro and micro physical evolution characteristics in
the cloud, but also have a certain degree of
precipitation. (Wang et al, 2019). With the continuous
development of China’s satellite technology in recent
years, China’s geostationary satellite data of FY
series has been widely used. Zhou et al. (2008; 2011)
used the observation data of FY geostationary
satellites, combined with other observation data,
retrieved nearly 10 cloud macro and micro physical
characteristic parameters, such as cloud top height,
cloud top temperature, cloud optical thickness, cloud
particle effective radius, etc. Since 2006, related
cloud characteristic products have been released one
after another and have been commercialized. Satellite
retrieval of cloud parameters plays a key role in
disaster prevention and mitigation and high-impact
weather forecasting and early warning.
There is plenty of scientific research
achievements in domestic and foreign using
meteorological satellites data, mainly focus on the
development and evolution of the weather system,
and the relationship between the satellite inversion of
cloud parameters and the occurrence and
development of precipitation. Rosenfeld & Gutman
(1994) studied the relationship between the effective
radius of cloud particles retrieved by NOAA satellites
and precipitation, and proposed that the effective
radius greater than 14μm is the threshold for
precipitation in the cloud. The relationship between
cloud parameters and precipitation in different
regions of China has been studied by Cai, Zhou, &
Zhu, (2010; 2011) and Chen et al. (2007; 2009;
2013a; 2013b) successively, and found that FY-2C
and MODIS data can consistently reflect the main
characteristics of particle effective radius
Zhang, X., Yang, W., Hou, T., Shen, Z., Li, S., Hou, S. and Meng, J.
To Evaluate the Characteristics of Cloud Parameters Retrieved by Satellite and Cloud Structure of the Northward Typhoon In-Fa.
In Proceedings of the 7th International Conference on Water Resource and Environment (WRE 2021), pages 475-482
ISBN: 978-989-758-560-9; ISSN: 1755-1315
Copyright
c
2022 by SCITEPRESS – Science and Technology Publications, Lda. All rights reserved
475
distribution, the large value area of the cloud liquid
water path is basically the same as the location of the
ground heavy precipitation center, the ground hourly
rainfall is positive with the cloud optical thickness
and the effective radius of the cloud particles, the
probability of precipitation is more closely related to
cloud optical thickness, and cloud parameters precede
changes in surface precipitation, etc. The correlation
between cloud characteristic parameters and
precipitation in North China is studied by Wang Lei
et al. (2019), and revealed that cloud optical thickness
greater than 20 and cloud top temperature less than -
15°C can be used as satellite monitoring indicators to
predict the upcoming precipitation in North China.
In recent years, with the operational of numerical
model data with detailed cloud microphysical
processes, cloud parameters retrieved by satellite as a
large-scale live monitoring data is often used for
comparison and correction of model data. Typhoon
In-fa (No.6 of 2021) landed and northward on July
25, and due to its slow-moving speed, it stayed on
inland for 95 hours, which is the longest since 1949;
the accumulated rainfall is large, and the maximum
accumulated rainfall at a single point exceeds
1000mm, significant precipitation was brought to
most areas of Hebei Province on July 28th to 30th.
This article uses the cloud parameters retrieved by
satellite and the model data with detailed cloud
microphysical processes released by the National
Weather Modification Center to analyze this process.
2 ANALYSIS OF SYNOPTIC
BACKGROUND AND
CIRCULATION PATTERNS
From July 28th to 30th, due to the combined effect of
the peripheral airflow and cold air of Typhoon In-fa,
significant precipitation occurred in most parts of
Hebei Province, and the rainfall distribution was
more in the east and less in the west. In this paper,
cloud characteristic parameters retrieved by FY-2
satellite and CPEFS cloud model data during 29th in
North China has been used for comprehensive
analysis.
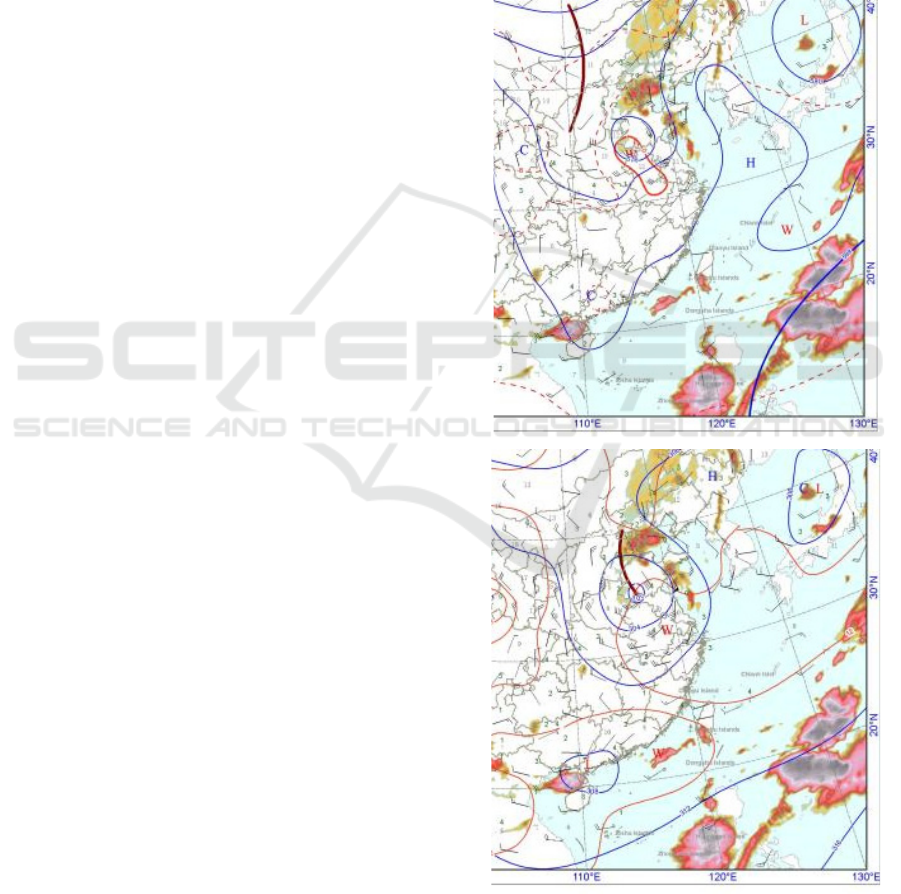
As showed in
Figure 1, the northern part of Hebei
was in front of the 500hpa trough, and the center of
tropical depression In-fa was in the southern part of
Shandong Province
at at 08:00 on the 29th, moving
slowly to the northeast at a speed of 15 m/s, and the
warm humid air streams on the sea were
supplemented by the low pressure in the southeast
wind direction. A deep moisture layer and an obvious
vertical upward movement area above 700hpa in the
lower layer was existed, The apparent precipitation
process was jointly affected by the cold air and the
northward typhoon. “cold pad” was formed by the
interaction of weak cold air pile in internal boundary
layer and warm humid air streams , which is come
from low-latitude. The pad has played a role of
forcing ascending motion,dry cold air intrusion and
warm humid air streams transferred by low-level
jet(LLJ) cause potential instability, which is
conducive to the occurrence of heavy rainfall.
Figure 1: The overlay map of 500hpa(a) and 700hpa(b)
synoptic situation and satellite cloud picture at 08:00 on
July 29th, 2021.
(a)
(b)
WRE 2021 - The International Conference on Water Resource and Environment
476
3 ANALYSIS OF CLOUD
PARAMETER RETRIEVED BY
SATELLITE
Lots of researches has been presented by using cloud
optical thickness and effective particle radius, which
is retrieved by using airborne or satellite visible light
and near-infrared/mid-infrared channel detection data
(Twomey & Cocks, 1982; Twomey & Cocks, 1989;
King, 1987; Nakajima & King, 1990; Nakajima &
Nakajima, 1995; Arking & Childs, 1985), the
theoretical basis is that the reflection function is
mainly a function of cloud optical thickness in the
non-water vapor absorption band, and the reflection
function is mainly a function of the size of the cloud
particle in the water vapor absorption band. Cloud
characteristic parameters retrieved by FY-2E
satellites has been used in this paper to analyze the
evolution characteristics of cloud optical thickness,
cloud top height, cloud top temperature, and effective
radius of cloud particles, which have the widest range
of service applications and are indicative of cloud and
precipitation. The data is provided by the National
Weather Modification Center.
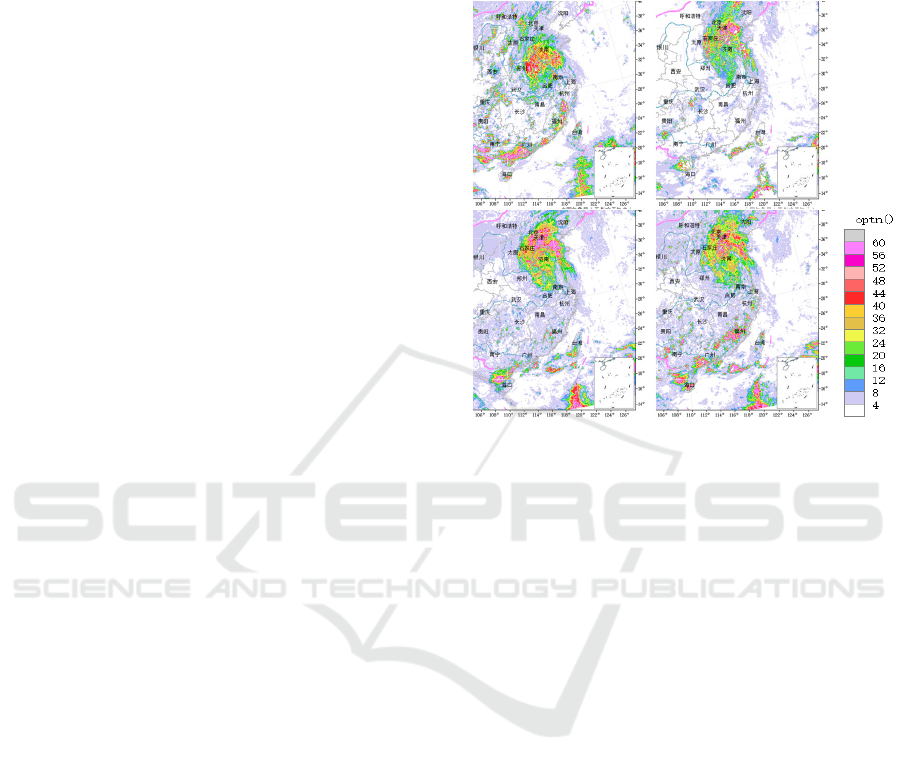
3.1 Cloud Optical Thickness
Figure 2 shows the large value areas of cloud optical
thickness mainly appear in the northeast and
northwest quadrants of the typhoon. The intensity and
range of cloud optical thickness gradually increased
from 16:00 on July 28 to 14:00 on the 29th. Satellite
data can Real-time monitoring of the changes in the
precipitation center in the typhoon spiral rain belt.
Recent work by Wang Lei et al. showed that cloud
optical thickness is more indicative of precipitation
than other cloud parameters, followed by cloud top
temperature and cloud top height. When the optical
thickness is greater than 20, the probability of
precipitation increases significantly. At 17:00 on the
28th, the optical thickness in the southeastern part of
Hebei gradually increased, and in some areas, it
exceeded 20, corresponding to the beginning of light
rain in the eastern areas of Handan, Xingtai and other
places. As the cloud system moved northward, the
cloud optical thickness increased at 08:00 on the 29th,
exceeding 50 in some areas. Light to moderate rains
appeared in central and southern Hebei, and the
hourly rain intensity exceeded 10 mm in Hengshui
and Cangzhou. At 12:00 on the 29th, the optical
thickness of the cloud band and the area of the large
value area greater than 50 reached the maximum.
Until 14:00, the central large value gradually
weakened to 30-40, and the area of the large value
decreased, the hourly precipitation was below 10mm.
During the process, the optical thickness has a good
indication of the hourly rain intensity.
Figure 2: The evolution of optical thickness of FY-2 cloud
characteristic parameter: 16:00 on July 28th(a), 08:00 on
July 29th(b), 12:00 on July 29th(c), 14 :00 on July 29th(d).
3.2 Cloud Top Temperature
Figure 3 shows when the low-pressure cloud system
began to affect North China at 17:00 on 28th, the
minimum temperature of the cloud top in the center
of the cloud system was less than -50℃, and the
temperature of the cloud top over the surrounding
Hebei region was between -15℃ and -25℃.
With the system moving northward and eastward,
the temperature of the cloud top gradually increased,
while the range of the low value center of the cloud
top temperature gradually decreased. At 06:00 on
29th, the low value center of cloud top temperature is
located in the southeast of Hebei, lower than -25℃,
and the range of low value center corresponds to the
maximum range of hourly precipitation, the
precipitation has reached moderate to heavy rain in
the past 3 hours. Until 20:00 on 29th, the cloud top
temperature continued to increase, corresponding to
the decrease of hourly rainfall on the ground, and the
cloud top temperature over Hebei increased to -
10℃~-20℃. Since the early morning of 30th, the
cloud top temperature in northeast Hebei gradually
decreased, the lowest temperature was less than -35℃
at 05:00, the precipitation area and hourly rainfall
increased. The change of the low value center of
(c)
(d)
(a)
(b)
To Evaluate the Characteristics of Cloud Parameters Retrieved by Satellite and Cloud Structure of the Northward Typhoon In-Fa
477

cloud top temperature in this process has a good
indication for the precipitation area.
Figure 3: The evolution of cloud top temperature (unit: ℃)
of FY-2 cloud characteristic parameter: 16:00 on July
28th(a), 08:00 on July 29th(b), 12:00 on July 29th(c), 14 :00
on July 29th(d).
Figure 4: The evolution of cloud top height (unit: km) of
FY-2 cloud characteristic parameter: 16:00 on July 28th(a),
08:00 on July 29th(b), 12:00 on July 29th(c), 14 :00 on July
29th(d).
3.3 Cloud Top Height
Before the main cloud band moved to north China, as
showed in
Figure 4,
the central part of the cloud top
height was more than 14km. At 17:00 on 28th, the
cloud top height of cloud system over the southeast of
Hebei increased from 7~8km to more than 9km, and
precipitation began. With the main cloud band
northward, the cloud top height of main cloud system
gradually decreases to 7km at night, hourly
precipitation is basically below 4mm. At 08:00 on
29th, the cloud system of low-pressure center moved
to the east of Hebei, cloud top height in 9~12 km and
local hourly precipitation in more than 10 mm. In the
afternoon on 29th, the cloud system was weakened,
cloud top height was reduced, and hourly
precipitation was also decreased. By the early
morning of 30th, the cloud system was strengthened,
and the cloud top height over northeast Hebei was
more than 9km, and the hourly precipitation intensity
increased. The change of cloud top height in this
process had a good indication of precipitation
intensity.
Figure 5: The evolution of effective particle radius (unit:
µm) of FY-2 cloud characteristic parameter: 16:00 on July
28th(a), 08:00 on July 29th(b), 12:00 on July 29th(c), 14 :00
on July 29th(d).
3.4 Effective Particle Radius
The effective radius of cloud particles can be used to
judge the size of cloud top particles. However, false
large particles also appear in the clear air, so non-
cloud zone cannot be identified. Therefore, a
comprehensive analysis is required by combining
cloud optical thickness, cloud top temperature and
cloud top height. As showed in
Figure 5, a
t 16:00 on
28th, the maximum effective radius of cloud particles
above 40μm appears in some areas of southern Hebei,
then the hourly precipitation was greater than 5 mm.
It shows that in addition to the cloud system needing
to reach a certain height and temperature, cloud
droplets need to reach a certain scale to produce
precipitation. Until 12:00 on 29th, effective radius of
cloud particles in northern Hebei reached more than
50μm, However, the large value area of surface
hourly precipitation is still in the southeast of Hebei,
and the corresponding effective particle radius is less
(a)
(b)
(c) (d)
(a)
(b)
(c)
(d)
(a)
(b)
WRE 2021 - The International Conference on Water Resource and Environment
478

than 20μm. Only the effective radius of cloud
particles does not significantly reflect the
quantification of precipitation.
4 COMPARATIVE ANALYSIS
THE EVOLUTION OF CLOUD
PARAMETERS AND
NUMERICAL MODEL
4.1 Forecast Adjustment and Error
Analysis of Cloud Band Simulated
by Model
The CPEFS cloud model is a cloud precipitation
display and forecast system launched by the National
Weather Modification Center in 2017. Based on the
dynamic framework of WRF, the country is divided
into 8 regions with double nesting. The first layer has
a resolution of 9Km×9Km, and the second layer has
a resolution of 3Km×3Km, the output product time
resolution is 1 hour.
Figure 6: The horizontal distributions of total hydrometeors
simulated (unit: mm) by CPEFS model in this process:
14:00 on July 28th(a), 14:00 on July 28th(b), 08:00 on July
29th(c), 14:00 on July 29th(d).
The cloud bands reported by CPEFS cloud mode
since 20:00 on 27th and 08:00 on 28th were selected
for evolution analysis as showed in
Figure 6
. It shows
that the cloud system move faster at 20:00 on 27th,
and at 14:00 on 28th, the southeastern of Hebei is
influenced by the top of cloud system of low pressure,
and the intensity is stronger, vertical accumulation of
condensate water content to reach more than 5 mm.
Weather system intensity change is not obvious at
night on 28th, and the late adjustment system move
slow, weak strength, vertical accumulation of
condensate water content was 3 to 5 mm, and
weakening process of the system was obviously at
night. By 08:00 on 29th, the late adjusted position of
forecast was more southerly, and the moving
direction of the cloud band’s main body was more
easterly. Meanwhile, the range of the large value area
and the intensity of the center were weakened.
Figure 7: The comparision of Cloud band simulated by
CPEFS (a, unit:mm) , and optical thickness of FY-2 cloud
characteristic parameter(b), and black body temperature(c,
unit: ℃) at 08:00 on July 30th, 2021.
Comparing and analyzing the optical thickness and
black body temperature of the observation data and the
model forecast data (
Figure 7
), and the result showed
that the movement of observation datawas still slow
after the adjustment of the model, the system
weakened more obviously at night on the 28th by
observation data; and on the 29~30th, the model
forecast was generally a slow weakened, changing
process existed in the cloud band presented by
observation data was weakened and then
strengthened; on the 30th, the model forecasted that
the cloud band moved faster, and the cloud band
moved to the Chengde-Tangshan area at 08:00 on the
30th, and from the observation data, a certain intensity
of optical thickness was seen over eastern Hebei at
08:00. Precipitation cloud system existed obviously in
northeast region of Hebei on afternoon, and hourly
precipitation at some areas can reach 5~10 mm. The
influence of low-pressure cloud band on Hebei was
later then the model forecast in this process, and the
movement speed was slow, hence the time of
influence was longer. Intensity variations of cloud
system were not reflected in forecast. Difference
existed between model forecast data and observation
(a)
(b)
(c) (d)
(a) (b)
(c)
To Evaluate the Characteristics of Cloud Parameters Retrieved by Satellite and Cloud Structure of the Northward Typhoon In-Fa
479

data in this process, however, the trend direction of
model adjustment has guiding significance for
forecasting.
4.2 Comparison of Cloud Top Height
and Cloud Top Temperature
Simulated by Model with Actual
Cloud Parameters
Figure 8: Cloud top height simulated by CPEFS(a, unit:mm)
and optical thickness of FY-2 cloud characteristic
parameter(b, unit: km) at 08:00 on July 29th, cloud top
temperature simulated by CPEFS(c, unit: ℃) and cloud top
temperature of FY-2 cloud characteristic parameter(d,
unit: ℃).
The cloud top height and cloud top temperature
reported by CPEFS cloud model since 08:00 on 28th
were compared with satellite cloud parameters (
Figure
8
), and it revealed that the cloud top height was
forecasted to have a false large value area in the edge
of cloud system at 08:00 on 29th in Hebei, the center
of cloud top height was above 9km. From the satellite
cloud parameter field, the large value area of cloud
top height was located in the bohai Rim area of
eastern Hebei, and the center of large value was about
9~11 km, hence compared to forecasts, observation
data is on the low side; forecast field of cloud top
temperature also had a false low value area of
temperature over Shanxi at 20:00 on 29th, the low
center of cloud top temperature in northeast Hebei is
below -25℃. However, according to the analysis of
the satellite cloud parameter field, the cloud top
temperature in the same region was between -15℃
and 25℃, which was lower than the actual forecast.
False value area of cloud top height and cloud top
temperature forecasted by the cloud model is
obviously, and satellite monitoring product can be
used to comparisons and correction. After eliminating
false value area from cloud model data, the typhoon
center and the scope and intensity of spiral rain band
closed to center is consistent with the result of
satellite inversion, and can be used to analyze the
vertical characteristics of cloud structure in typhoon
low pressure center.
5 ANALYSIS OF TYPHOON LOW
PRESSURE CENTER BY
VERTICAL CROSS SECTION
At 17:00 on the 28th, the beginning of precipitation
(
Figure 9
), low-pressure cloud system began to affect
the southern part of Hebei. The southern cloud system
developed strongly, dominated by cold-warm mixed
clouds. The height of 0℃ layer was 5km, the height
of -5℃ layer was about 6km, and the cloud top height
was above 8km. The supercooled water was mainly
distributed between 5~8 km, corresponding to the
temperature is 0~20℃ and the large value center of
supercooled is 1g/kg, ice crystal number
concentration is 1-100 L
-1
, and the center value of
snow-graupel mixing ratio is 1g/kg.
Figure 9: Cloud-water mixing ratio (unit: g/kg) forecasted
by CPEFS model at 17:00 on July 28th along the 36°N and
ice crystal number concentration (unit: 1/L) (a, cloud-water
mixing ratio: shadow, ice crystal number concentration: red
line), snow-graupel mixing ratio (unit: g/kg) and height (unit:
m) (b, snow-graupel mixing ratio: shadow, height: red line).
(a)
(b)
(c)
(d)
(a)
(b)
WRE 2021 - The International Conference on Water Resource and Environment
480

At 08:00 on 29th (
Figure 10
), the low-pressure
cloud system moved northward to the central and
southern part of Hebei, dominated by cold-warm
mixed clouds. The height of 0℃ layer was 5.5 km,
the height of -5℃ layer was about 6.5 km, and the
cloud top height was about 10 km. The supercooled
water was mainly distributed between 5.5-8.5 km,
corresponding to the temperature is 0-20℃ and the
large value center of supercooled is 1g/kg, ice crystal
number concentration is 1-100 L-1, and the center
value of snow-graupel mixing ratio is 4g/kg.
Figure 10: As figure 9, but on 29th, July 2021 along the
38°N.
At 17:00 on 29th (
Figure 11
), the central and
eastern part of Hebei was influenced by the low-
pressure cloud system dominated by warm clouds.
The height of the 0℃ layer was 5.5 km, the height of
the -5℃ layer was about 6 km, and the cloud top
height was about 10 km. The supercooled water was
distributed between 5.5-8km, corresponding to the
temperature is 0-20℃ and the large value center of
supercooled is 0.3 g/kg, ice crystal number
concentration is 1-50 L-1, and the center value of
snow-graupel mixing ratio is 1g/kg.
From the vertical cross section, there was thick
clod cloud, and the content of hydrometeorsand
supercooled water is abundant at the beginning of the
precipitation process. After 17:00 on 29th, the content
of hydrometeors and supercooled water in cold cloud
was decreased significantly and increased in warm
cloud correspondingly. The large value center of
water content and snow-graupel mixing ratio have
declined, and ice crystals number concentration
decreased. The precipitation mechanism changed
from cold cloud precipitation to warm cloud
precipitation.
Figure 11: As figure 9 but on 29th, July 2021 along the
40°N.
6 SUMMARY AND DISCUSSION
The evolution’s characteristics of the scope, intensity
and cloud characteristic parameters of Northward
typhoon’s cloud band can be monitored by FY-2
satellite product, and the optical thickness (>20),
cloud top temperature (-10℃~-25℃) and cloud top
height(>9km) of cloud characteristic parameters have
obvious indication significance to the range and
intensity variation of surface precipitation. The single
variable of cloud particle effective radius does not
significantly reflect the quantitative precipitation,
need combined with multi-parameter comprehensive
analysis.
Satellite monitoring products can be used to
compare and correct cloud model prediction products.
In this process, the simulated typhoon center moves
slowly, and false large value areas appear in the outer
and distant areas of the spiral cloud belt. The range
and intensity of the spiral cloud belt at the typhoon
(a)
(b)
(a)
(b)
To Evaluate the Characteristics of Cloud Parameters Retrieved by Satellite and Cloud Structure of the Northward Typhoon In-Fa
481

center and near the center are consistent with the
actual satellite inversion.
The typhoon low pressure at the beginning of the
precipitation process, the cold cloud is deep, content
of hydrometeors and supercooled water in cold cloud
is abundant, After 17:00 on 29th, the content of
hydrometeors and supercooled water decreased
obviously in the cold cloud, and it increased
significantly in warm cloud, the large value center of
water content, ice crystals number concentration and
snow-graupel mixing ratio have declined obviously,
The precipitation mechanism changed from cold
cloud precipitation to warm cloud precipitation.
ACKNOWLEDGEMENTS
This work is supported by the fund of the
Collaborative innovation of Meteorological
Technology in BohaiRim (QYXM202004), and the
civil space pre-research project of the 13th Five-Year
plan “the key technology of the emergency
observation & information support for domestic
satellite”, and the “S&T Program of Hebei
(19275420D)”.
REFERENCES
Arking, A., & Childs, J. D. (1985). Retrieval of cloud cover
parameters from multi-spectral satellite images.
Journal of Applied Meteorology and Climatology, 24,
322-333.
Cai, M., Zhou, Y. Q., & Zhu, B. (2010). Analysis of Cloud
Characteristic Parameters Retrieved by FY-2C/D
Satellite and the Parsivel Observation on Surface.
Meteorological and Environmental Sciences, 33(1), 1-
6.
Cai, M., Zhou, Y. Q., & Zhu, B. (2011). Comprehensive
analysis of satellite and other observations from a
convective cloud merging event. Transactions of
Atmospheric Sciences, 34(2), 170-179.
Chen, Y. Y., Zhou, Y. Q., Mao, J. T., & Yang. J. (2007).
Experimental Research of the Retrieval of Cloud
Effective Particle Radius by FY-2C Geostationary
Satellite Data. Meteorological Monthly, 33(4), 29-34.
Chen, Y. Y., Tang, R. M., Zhou, Y. Q., & Mao, J. T. (2009).
Microphysical Characteristic Parameters Product
Retrieved by F Y-2C/D Satellite and Its Application in
the Precipitation Analysis. Meteorological Monthly,
35(2), 15-18.
Chen, Y. Y., Xiong, S. Q., Zhou, Y. Q., Zhu, B., & Mao, J.
T. (2013a). Research on Effective Particle Radius of
Water Clouds Retrieved from the Data of FY 3A Three
Channels. Meteorological Monthly, 39(4), 478-485.
Chen, Y. Y. (2013b). Analysis on characteristic cloud
parameters of a heavy rain event based on satellite
cloud images from FY-3A. Torrential Rain and
Disasters, 32(1), 24-31.
King, M. D. (1987). Determination of the scaled optical
thickness of clouds from reflected solar radiation
measurements. Journal of the Atmospheric Sciences,
44, 1734-1751.
Nakajima, T. Y., & King, M. D. (1990). Determination of
the optical thichness and effective particle radius of
clouds from reflected solar radiation measurements.
PartⅠ, Theory. Journal of the Atmospheric Sciences,
47(15), 1878-1893.
Nakajima, T. Y., & Nakajima, T. (1995). Wide-area
determination of cloud microhpysical properties from
NOAA AVHRR measurements for FIRE and ASTEX
regions. Journal of the Atmospheric Sciences, 52, 4043-
4059.
Rosenfeld, D., & Gutman, G. (1994). Retrieving
microphysical properties near the tops of potential rain
clouds by multispectral analysis of AVHRR data.
Atmospheric Research, 34, 259-283.
Twomey, S., & Cocks, T. (1982). Spectral reflectance of
clouds in the near-infrared, Comparison of
measurements and calculations. Journal of the
Atmospheric Sciences, 60, 583-592.
Twomey S, & Cocks T, 1989. Remote sensing of cloud
parameters from spectral reflectance in the near
infrared. Beitr Phys Atmos, 62, 172-179.
Wang, L., Zhou, Y. Q., Cai, M., & Shen, S. H. (2019).
Study on Correlation Between Cloud Characteristic
Parameters and Precipitation in North China.
Meteorological and Environmental Sciences, 42(3), 9-
16.
Zhou, Y. Q., Chen, Y. Y., Li, J., Huang, Y. M., He, X. D.,
Zhou, F. F., Wu, M. X., Hu, B., & Mao, J. T. (2008).
Retrieval and Preliminary Test of Cloud Physical
Parameters from Combination of FY-2C/D
Geostationary Satellite Data and Other Observation
Data. Meteorological Monthly, 34(12), 27-35.
Zhou, Y. Q., Cai, M., Ou, J. J., Cai, Z. X., & Shi, A. L.
(2011). Correlation between cloud characteristic
parameters and precipitation. Transactions of
Atmospheric Sciences, 34(6), 641-652.
WRE 2021 - The International Conference on Water Resource and Environment
482
