
Deceptive AI Explanations: Creation and Detection
Johannes Schneider
1
, Christian Meske
2
and Michalis Vlachos
3
1
University of Liechtenstein, Vaduz, Liechtenstein
2
University of Bochum, Bochum, Germany
3
University of Lausanne, Lausanne, Switzerland
Keywords:
Explainability, Artificial Intelligence, Deception, Detection.
Abstract:
Artificial intelligence (AI) comes with great opportunities but can also pose significant risks. Automatically
generated explanations for decisions can increase transparency and foster trust, especially for systems based
on automated predictions by AI models. However, given, e.g., economic incentives to create dishonest AI,
to what extent can we trust explanations? To address this issue, our work investigates how AI models (i.e.,
deep learning, and existing instruments to increase transparency regarding AI decisions) can be used to create
and detect deceptive explanations. As an empirical evaluation, we focus on text classification and alter the
explanations generated by GradCAM, a well-established explanation technique in neural networks. Then, we
evaluate the effect of deceptive explanations on users in an experiment with 200 participants. Our findings
confirm that deceptive explanations can indeed fool humans. However, one can deploy machine learning
(ML) methods to detect seemingly minor deception attempts with accuracy exceeding 80% given sufficient
domain knowledge. Without domain knowledge, one can still infer inconsistencies in the explanations in an
unsupervised manner, given basic knowledge of the predictive model under scrutiny.
1 INTRODUCTION
AI can be used to increase wealth and well-being
globally. However, the potential uses of AI cause con-
cerns. For example, because of the limited modera-
tion of online content, attempts at deception prolifer-
ate. Online media struggle against the plague of “fake
news”, and e-commerce sites spend considerable ef-
fort in detecting deceptive product reviews (see (Wu
et al., 2020) for a survey). Marketing strategies ex-
ist that consider the creation of fake reviews to make
products appear better or to provide false claims about
product quality (Adelani et al., 2019).
There are multiple reasons why to provide “al-
tered” explanations of a predictive system. Truth-
ful explanations might allow to re-engineer the logic
of the AI system, i.e., leak intellectual property.
Decision-makers might also deviate from suggested
AI decisions at will. For example, a bank employee
might deny a loan to a person she dislikes claim-
ing an AI model’s recommendation as to the reason,
supported by a made-up explanation (irrespective of
the actual recommendation of the system). AI sys-
tems may perform better when using information that
should not be used but is available. For example, pri-
vate information on a person’s health condition might
be used by insurances to admit or deny applicants.
Even though this is forbidden in some countries, the
information is still very valuable in estimating ex-
pected costs of the applicant if admitted. Product sug-
gestions delivered through recommender systems are
also commonly accompanied by explanations (Fusco
et al., 2019) in the hope of increasing the likelihood
of sales. Companies have an incentive to provide ex-
planations that lure customers into sales irrespective
of their truthfulness. As such, there are incentives to
build systems that utilize such information but hide its
use. That is, “illegal” decision criteria are used, but
they are omitted from explanations requested by au-
thorities or even citizens. In Europe, the GDPR law
grants rights to individuals to get explanations of de-
cisions made in an automated manner.
The paper contributes in the area of empirical and
formal analyses of deceptive AI explanations. Our
empirical analysis, including a user study, shows in
alignment with prior work that deceptive AI explana-
tions can mislead people. Our formal analysis sets
forth some generic conditions under which detection
of deceptive explanations is possible. We show that
domain knowledge is required to detect certain forms
44
Schneider, J., Meske, C. and Vlachos, M.
Deceptive AI Explanations: Creation and Detection.
DOI: 10.5220/0010768300003116
In Proceedings of the 14th International Conference on Agents and Artificial Intelligence (ICAART 2022) - Volume 2, pages 44-55
ISBN: 978-989-758-547-0; ISSN: 2184-433X
Copyright
c
2022 by SCITEPRESS – Science and Technology Publications, Lda. All rights reserved

of deception that might not be available to explainees
(the recipients of explanations). Our supervised and
unsupervised detection marks one of the first steps in
the quest against deceptive explanations. They high-
light that while detecting deception is often possible,
success depends on multiple factors such as type of
deception, availability of domain knowledge and ba-
sic knowledge of the deceptive system.
2 PROBLEM DEFINITION
We consider classification systems that are trained us-
ing a labeled dataset D = {(X, Y )} with two sources
of deception: model decisions and explanations. A
model M maps input X ∈ S to an output Y , where
S is the set of all possible inputs. To measure the
level of deception, we introduce a reference (machine
learning (ML)) model M
∗
and a reference explana-
tion method H
∗
. In practice, M
∗
might be a deep
learning model and H
∗
a commonly used explain-
ability method such as LIME or SHAP. That is, H
∗
might not be perfect. Still, we assume that the ex-
plainee trusts it, i.e. she understands its behavior
and in what ways explanations differ from ”human”
reasoning. The model M
∗
is optimized with a be-
nign objective, i.e. maximizing accuracy. We as-
sume that M
∗
is not optimized to be deceptive. How-
ever, model M
∗
might not be fair and behave uneth-
ically. A deceiver might pursue other objectives than
those used for M
∗
leading to the deceiver’s model
M
D
. The model M
D
might simply alter a few de-
cisions of M
∗
using simple rules or it might be a
completely different model. A (truthful) explainabil-
ity method H(X, Y, M) receives input X, class la-
bel Y and model M to output an explanation. For
the reference explanation method H
∗
, this conforms
to provide a best-effort, ideally a truthful, reasoning,
why model M would output class Y . The deceiver’s
method H
D
might deviate from H
∗
using arbitrary
information. It returns H
D
(X), where the exact de-
ception procedure is defined in context. An explainee
(the recipient of an explanation) obtains for an input
X, a decision M
D
(X) and an explanation H
D
(X).
The decision is allegedly from M
∗
and the explana-
tion allegedly from H
∗
and truthful to the model M
D
providing the decision. Thus, an explainee should
be lured into believing that M
∗
(X) = M
D
(X) and
H
D
(X) = H
∗
(X, M
D
(X), M
D
). However, the de-
ceiver’s model might not output M
D
(X) = M
∗
(X)
and a deceiver might choose an explainability method
H
D
that differs from H
∗
or she might explain a differ-
ent class Y . This leads to four scenarios (see Figure
1). We write H
∗
(X) := H
∗
(X, M
D
(X), M
D
).
The goal of a deceiver is to construct an explana-
tion so that the explainee is neither suspicious about
the decision in case it is not truthful to the model M
D
,
ie. M
D
(X) 6= M
∗
(X), nor about the explanation
H
D
(X) if it deviates from H
∗
(X, M
D
(X), M
∗
).
Thus, an explanation might be used to hide an un-
faithful decision to the model or it might be used to
convey a different decision-making process than oc-
curs in M
D
.
An input X consists of values for n features,
F = {i|i = 1 . . . n}, where each feature i has a sin-
gle value x
i
∈ V
i
of a set of feasible values V
i
. For
example, an input X can be a text document such as a
job application, where each feature i is a word speci-
fied by a word id x
i
. Documents X ∈ S are extended
or cut to a fixed length n. ML models learn (a hier-
archy of) features. Explaining in terms of learnt fea-
tures is challenging since they are not easily mapped
to unique concepts that are humanly understandable.
Thus, we focus on explanations that assign relevance
scores to features F of an input X. Formally, we con-
sider explanations H that output a value H
i
(X, Y, M)
for each feature i ∈ F . Where H
i
> 0 implies that
feature i with value x
i
is supportive of decision Y . A
value of zero implies no dependence of i on the deci-
sion Y . H
i
< 0 shows that feature i is indicative of
another decision.
3 MEASURING EXPLANATION
FAITHFULNESS
We measure faithfulness of an explanation using two
metrics, namely decision fidelity and explanation fi-
delity.
Decision Fidelity. It amounts to the standard no-
tion of quantifying whether input X and explanation
H
D
(X) on their own allow deriving the correct de-
cision Y = M
∗
(X) (Schneider and Handali, 2019).
Therefore, if explanations indicate multiple outputs or
an output different from Y , this is hardly possible.
Decision fidelity f
D
can be defined as the loss when
predicting the outcome using some classifier g based
on the explanation only, or formally:
f
D
(X) = −L(g(X, H
D
(X)), Y ) (1)
The loss might be defined as 0 if g(X, H
D
(X)) = Y
and 1 otherwise. We assume that the reference ex-
planations H
∗
(X, M
∗
(X), M
∗
) results in minimum
loss, i.e., maximum decision fidelity. (Large) deci-
sion fidelity does not require that an explanation con-
tains all relevant features used to derive the decision
M
D
(X). For example, in a hiring process, gender
Deceptive AI Explanations: Creation and Detection
45
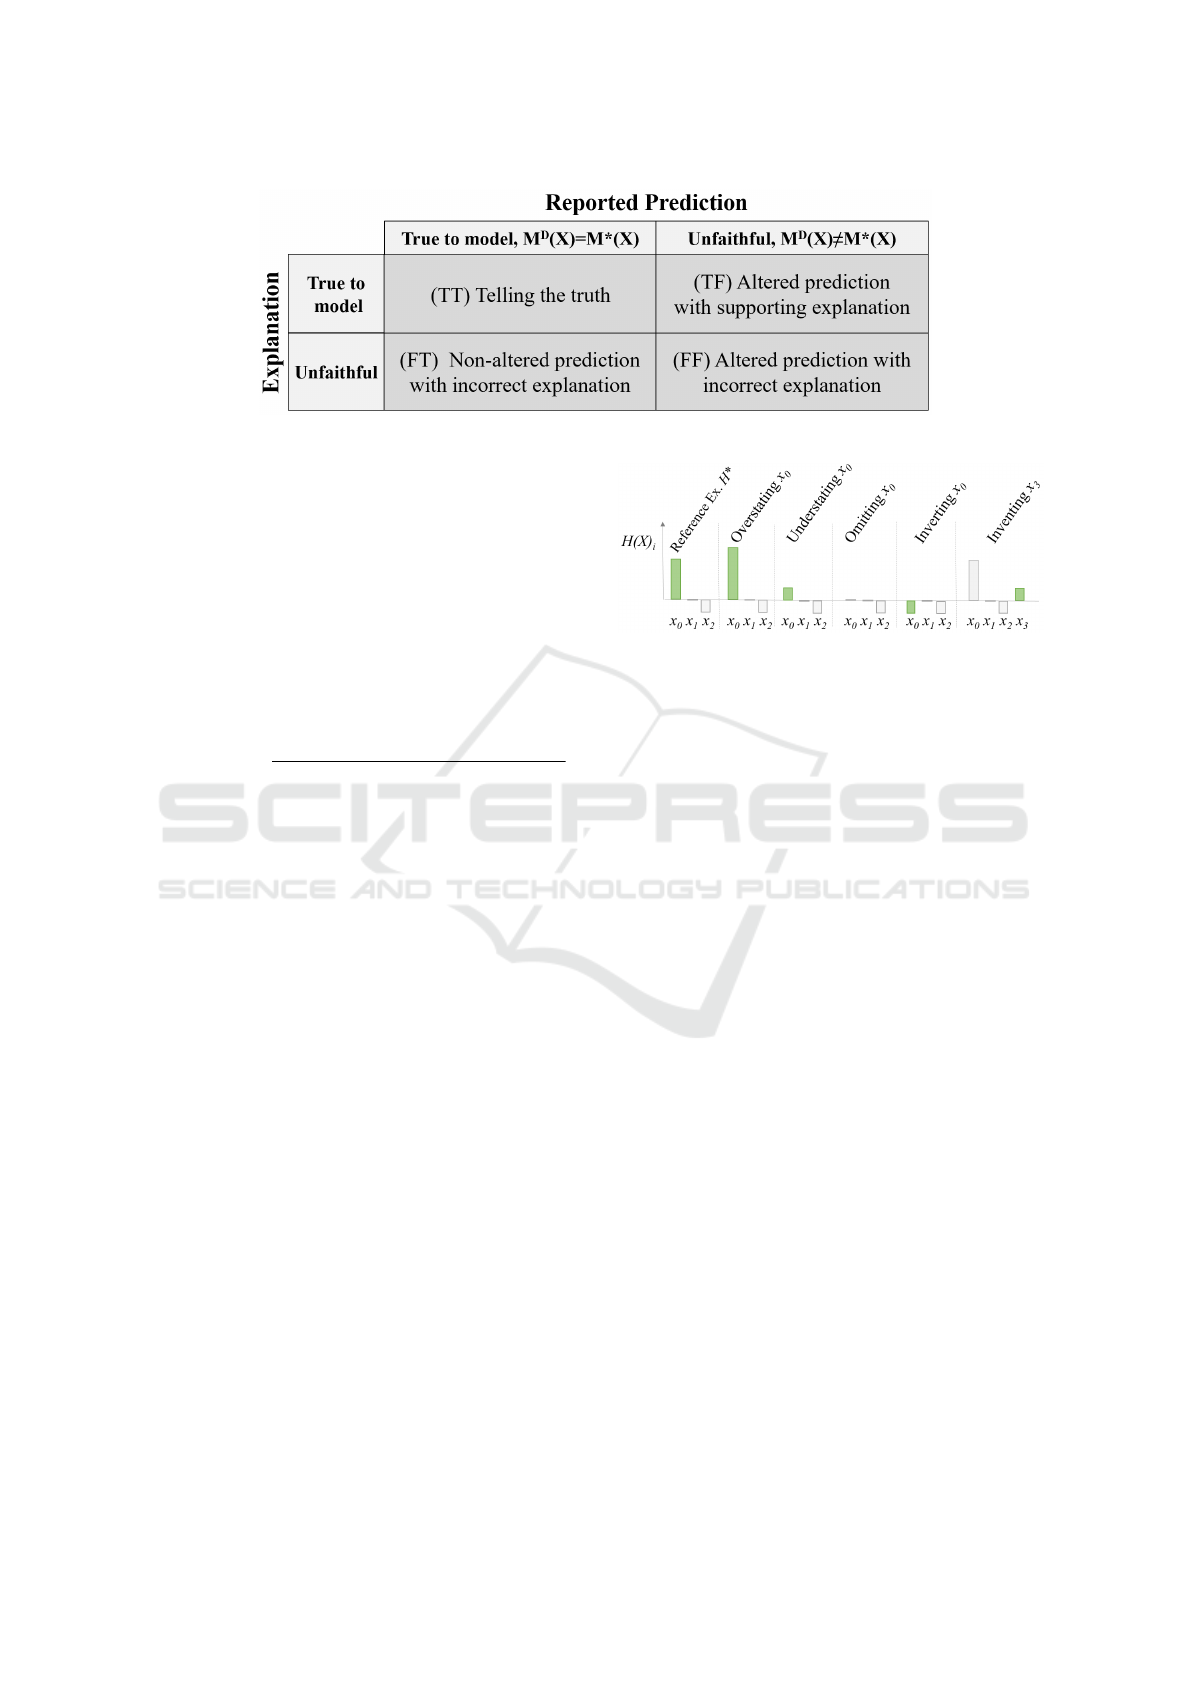
Figure 1: Scenarios for reported predictions and explanations.
might influence the decision, but for a particular can-
didate other factors, such as qualification, social skills
etc., are dominant and on their own unquestionably
lead to a hiring decision.
Explanation Fidelity. This refers to the overlap of
the (potentially deceptive) explanation H
D
(X) and
the reference explanation H
∗
(X, M
D
(X), M
D
) for
an input X and reported decision M
D
(X). Any mis-
match of a feature in the two explanations lowers ex-
planation fidelity. It is defined as:
f
O
(X) = 1 −
kH
∗
(X, M
D
(X), M
D
) − H
D
(X)k
kH
∗
(X, M
D
(X), M
D
)k
(2)
Even if the decision M
D
(X) is non-truthful to the
model, i.e., M
D
(X) 6= M
∗
(X), explanation fidelity
might be large if the explanation correctly outputs the
reasoning that would lead to the reported decision.
If the reported decision is truthful, i.e., M
D
(X) =
M
∗
(X), there seems to be an obvious correlation be-
tween decision- and explanation fidelity. But any ar-
bitrarily small deviation of explanation fidelity from
the maximum of 1 does not necessarily ensure large
decision fidelity and vice versa. For example, assume
that an explanation from H
D
systematically under- or
overstates the relevance of features, i.e. H
D
(X)
i
=
H
∗
(X)
i
· c
i
with arbitrary c
i
> 0 and c
i
6= 1. For c
i
differing significantly from 1, this leads to explana-
tions that are far from the truth, which is captured by
low explanation fidelity. However, decision fidelity
might yield the opposite picture, i.e., maximum de-
cision fidelity, since a classifier g (Def. 1) trained on
inputs (X, H
D
(X)) with labels M
D
(X), might learn
the coefficients c
i
and predict labels without errors.
Explanation fidelity captures the degree of decep-
tiveness of explanations from H
D
by aggregating the
differences of its relevances of features and those of
the reference explanations. When looking at individ-
ual features from a layperson’s perspective, deception
can arise due to over- and understating the feature’s
relevance or even fabricating features (see Figure 2).
Omission and inverting of features can be viewed as
Figure 2: Deviations from (trusted) reference explanation.
special cases of over- and understating. In this work,
we do not consider feature fabrication.
4 CREATION OF DECEPTIVE
EXPLANATIONS
We first discuss goals a deceiver might pursue us-
ing deceptive explanations, followed by how decep-
tive explanations can be created using these goals in
mind.
Purposes of Deceptive Explanation include:
i) Convincing the explainee of an incorrect predic-
tion, i.e. that a model decided Y for input X although
the model’s output is M
D
(X) with Y 6= M
D
(X).
For example, a model M
∗
in health-care might
predict the best treatment for a patient trained on his-
torical data D. A doctor might change the prediction.
She might provide the best treatment for well-paying
(privately insured) patients and choose a treatment
that minimizes her effort and costs for other patients.
ii) Providing an explanation that does not accurately
capture model behavior without creating suspicion.
An incorrect explanation will manifest in low de-
cision fidelity and explanation fidelity. It involves
hiding or overstating the importance of features in the
decision process (Figure 2) with more holistic goals
such as:
a) Omission: Hiding that decisions are made based
on specific attributes such as gender or race to prevent
legal consequences or a loss in reputation.
ICAART 2022 - 14th International Conference on Agents and Artificial Intelligence
46

b) Obfuscation: Hiding the decision mechanism
of the algorithm to protect intellectual property.
The combination of (i) and (ii) leads to the four sce-
narios shown in Figure 1.
Creation: To construct deceptive explanations (and
decisions), a deceiver has access to the model M
∗
and M
D
, the input X and the reference explanation
H
∗
. She outputs a decision M
D
(X) in combination
with an explanation H
D
(X) (see Figure 3). Decep-
tive explanations are constructed to maximize the ex-
plainee’s credence of decisions and explanations. We
assume that an explainee is most confident that the
reference explanation H
∗
(X, Y, M
D
) and the model-
based decision Y = M
∗
(X) are correct. This en-
codes the assumption that the truth is most intuitive
since any deception must contain some reason that
can be identified as faulty.
We provide simple means for creating deceptive
explanations that are non-truthful explanations (FT
and FF). The idea is to alter reference explanations.
This approach is significantly simpler than creating
deceptive explanations from scratch using complex
algorithms as done in other works (Aivodji et al.,
2019; Lakkaraju and Bastani, 2019; Adelani et al.,
2019), while at the same time guaranteeing high-
quality deceptive explanations since they are based
on what the explainee expects as a valid explanation.
For non-truthful explanations a deceiver aims at over-
, understating or omitting features X
0
⊆ X that are
problem or instance-specific. To obtain non-truthful
explanations we alter reference explanations in two
ways:
Definition 1 (Omission). Remove a fixed set of values
V so that no feature i has a value x
i
∈ V as follows:
H
Omit
(X)
i
:=
(
0, if x
i
∈ V.
H
∗
(X)
i
, otherwise.
(3)
In our context, this means denying the relevance
of some words V related to concepts such as gender
or race. The next alteration distorts relevance scores
of all features, eg. to prevent re-engineering through
obfuscation.
Definition 2 (Noise addition). Add noise in a multi-
plicative manner for any explanation H
∗
(X):
H
Noise
(X)
i
:= H
∗
(X)
i
· (1 + r
i,X
), (4)
where r
i,X
is chosen uniformly at random in [−k, k]
for a parameter k for each feature i and input X ∈ S.
We assume that these alterations are applied con-
sistently for all outputs. Note, that this does not imply
that all explanations are indeed non-truthful, e.g., for
noise it might be that by chance explanations are not
altered or only very little, for omission it might be that
a feature is not relevant in the decision for a particular
input X, i.e. the value of a feature H
∗
(X)
i
is zero
anyway.
5 DECEPTION DETECTION
To detect deception attempts, we reason using expla-
nations and decisions of multiple inputs. That is, for a
set of inputs X ∈ S
D
, we are given for each input X
the reported decision M
D
(X) and accompanying ex-
planation H
D
(X). Our goal is to identify if a model
outputs deceptive explanations or not. For supervised
learning, we (even) aim to identify the inputs yielding
deceptive outputs. We assume that only features that
are claimed to contribute positively to a decision are
included in explanations. Features that are claimed
to be irrelevant or even supporting of another deci-
sion outcome are ignored. The motivation is that we
aim at explanations that are as simple to understand as
possible. The omission of negatively contribution fea-
tures makes detection harder. We first provide theo-
retical insights before looking into practical detection
approaches.
Formal Investigation: Ideally, any of the three
types of deception {T F, F T, F F } is detected using
only one or more inputs X ∈ S
D
and their responses
M
D
(X) and H
D
(X) (see Figure 3). But, without
additional domain knowledge (such as correctly la-
beled samples), metadata or context information, this
is not impossible for all deception attempts. This fol-
lows since data, such as class labels, bear no mean-
ing on their own. Thus, any form of ”consistent” ly-
ing is successful, eg. always claiming that a cat is a
dog (using explanations for class dog) and a dog is a
cat (using explanations for class cat) is non-detectable
for anybody lacking knowledge on cats and dogs, i.e.,
knowing what a cat or a dog is.
Theorem 1. There exist non-truthful reported deci-
sions M
D
(X) 6= M
∗
(X) that cannot be identified as
non-truthful.
Proof. Consider a model M
D
for dataset {(X, Y )}
for binary classification with labels Y ∈ {0, 1} and
M
D
(X) = M
∗
(X). Assume a deceiver switches the
decision of model M
D
, i.e. it returns M
D
(X) =
1 − M
∗
(X) and H
∗
(X, M
D
(X), M
D
). Consider
a dataset with switched labels, i.e. {(X, 1 − Y )}
and a second model M
0D
that is identical to M
D
except that it outputs M
0D
(X) = 1 − Y =
1 − M
D
(X). Thus, reference explanations are
identical, i.e. we have H
∗
(X, M
0D
(X), M
0D
) =
Deceptive AI Explanations: Creation and Detection
47

Figure 3: Inputs and outputs for deceiver and explainee for scenario FT in Figure 1. Images by (Petsiuk et al., 2018).
H
∗
(X, M
D
(X), M
D
). Thus, for input X both
the deceiver and model M
0D
report M
D
(X) =
1 − M
D
(X) and H
∗
(X, M
D
(X), M
D
). Therefore,
M
0D
and M
D
cannot be distinguished by any detec-
tor.
A similar theorem might be stated for non-truthful
explanations H 6= H
∗
, eg. by using feature inversion
H(X) = −H
∗
(X).
The following theorem states that one cannot hide
that a feature (value) is influential if the exchange of
the value with another value leads to a change in de-
cision.
Theorem 2. Omission of at least one feature value
v ∈ V can be detected, if there are instances X, X
0
∈
S with decisions M
D
(X) 6= M
D
(X
0
) and X
0
= X
except for one feature j with x
j
, x
0
j
∈ V and x
0
j
6= x
j
.
Proof. We provide a constructive argument. We can
obtain for each input X ∈ S, the prediction M
D
(X)
and explanation H
D
(X). By Definition of Omis-
sion, if feature values V are omitted it must hold
H
D
(X)
i
= 0 for all (i, X) ∈ F
S,v
and v ∈ V. Omis-
sion occurred if this is violated or there are X, X
0
∈ S
that differ only in the value x
j
∈ V for feature j and
M
D
(X) 6= M
D
(X
0
). The latter holds because the
change in decision must be attributed to the fact that
of x
j
6= x
0
j
, since X and X
0
are identical except for
feature j with values that are deemed omitted.
Theorem 2 is constructive, meaning that it can eas-
ily be translated into an algorithm by checking all in-
puts S if the stated condition is matched. But, gen-
erally all inputs S cannot be evaluated due to com-
putational costs. Furthermore, the existence of inputs
X, X
0
∈ S that only differ in a specific feature is not
guaranteed. However, from a practical perspective, it
becomes apparent that data collection helps in detec-
tion, i.e. one is more likely to identify ”contradictory”
samples X, X
0
in a subset S
0
⊂ S the larger S
0
is.
Detection Approaches: Our formal analysis
showed that only decisions and explanations are
not sufficient to detect deception involving flipped
classes. That is, some knowledge on the domain
is needed. Encoding domain know-how with a
labeled dataset seems preferable to using expert rules
or the-like. Thus, not surprisingly, this approach
is common in the literature, e.g. for fake news
detection (P
´
erez-Rosas et al., 2017; Przybyla, 2020).
To train a detector, each sample is a triple (X,
M
D
(X), H
D
(X)) for X ∈ S
T
together with label
L ∈ {T T, F T, T F, F F } stating the scenario in
Figure 1. After the training, the classifier can be
applied to the explanations and decisions of X ∈ S
D
to investigate. We develop classifiers maximizing
deception detection accuracy.
Labeling data might be difficult since it requires
not only domain knowledge on the application but
also knowledge on ML, ie. the reference model and
explainability method. Thus, we also propose unsu-
pervised approaches to identify whether a model, ie.
its explanations, are truthful to the model decision.
That is, the goal is to assess if given explanations H
D
are true to the model M
D
(X) or not.
Algorithm 1: ConsistencyChecker.
Input: Untrained models M
0
, reference method
H
∗
, inputs S
D
with (deceptive) decisions and ex-
planations {(M
D
(X), H
D
(X)}
Output: (Outlier) Probability p
S
M
0
= s randomly chosen elements from S
D
with
s random in [c
0
|S
D
|, |S
D
|] {We used: c
0
= 0.33}
Train each model M
0
∈ M
0
on (X, M
D
(X)) for X ∈
S
M
0
m
∗
i
(X) =
1
|M
0
|
P
M
0
∈M
0
H
∗
i
(X, M
D
(X), M
0
)
s(M
0
) =
P
i∈[0,n−1],X∈S
D
(H
∗
i
(X, M
D
(X), M
0
) − m
i
(X))
2
n|S
D
|
s(M
D
) =
P
i∈[0,n−1],X∈S
D
(H
D
i
(X) − m
i
(X))
2
n|S
D
|
µ =
1
|M
0
|
P
M
0
∈M
0
s(M
0
)
σ =
1
|M
0
|
q
P
M
0
∈M
0
(s(M
0
) − µ)
2
p = prob
T > |s(M
D
) − µ|
T ∼ N (0, σ)
ICAART 2022 - 14th International Conference on Agents and Artificial Intelligence
48

Our approach is to check, whether the explana-
tions of H
D
and decisions of M
D
are consistent. This
would be easy, if the model M
D
was available, ie. we
would check if H
∗
(X, M
D
(X), M
D
) = H
D
(X).
Since it is not, we aim to use a model M
0
to approx-
imate model M
D
and compare the explanations H
∗
of M
0
with H
D
. Since approximation introduces an
error, we must determine if differences in the expla-
nations originate from model approximation or from
deception. To do so, we train (approximate) reference
models M
0
≈ M
D
with M
0
∈ M
0
using the provided
data (X, M
D
(X)) with X ∈ S
D
. The models might
differ, e.g. in hyperparameter settings. If explana-
tions of M
D
are ”outliers” relative to those of models
M
0
∈ M
0
explanations might be untruthful and fur-
ther investigation is needed. Otherwise, any variation
of explanation compared to H
∗
due to deception is
comparable to variation that might arise if models are
slightly varied but no deception is attempted.
Details on the model M
D
are unknown. But for many
common ML tasks excellent performing architectures
are publicly known. Therefore, we assume that we
can anticipate at least a well-working architecture for
the problem – the closer it is to M
D
the better.
Algorithm 1 (ConsistencyChecker) shows details. It
takes as input a set of untrained models M
0
∈ M
0
– ideally similar to M
D
. The more information is
known on M
D
, the more similar the models can be
chosen. If only very little information or no informa-
tion on M
D
is available, one might train models on
(X, M
D
(X)) for X ∈ S
D
and choose those that per-
form best.
The second unsupervised approach Algorithm 2
(UsefulnessChecker) tries to reproduce the decisions
based on explanations. If this is not possible for ex-
planations from M
D
but for those of approximate
models M
D
then explanations from M
D
are likely
deceptive. As before, we train multiple approximate
models M
0
∈ M
0
. For each of these models M
0
, we
train a classifier C
M
0
using explanations from the ap-
proximate models M
0
as well as one on explanations
from M
D
. We use the same classifier architecture for
all. We conduct a statistical test (as in Algorithm 1),
if accuracy is an outlier. The full pseudo-code is sim-
ilar to Algorithm 1. For the sake of completeness, it
is shown in Algorithm 2.
6 EVALUATION
We elaborate on two text classification tasks using a
convolutional neural network (CNN) for text classi-
fication by (Kim, 2014) as our reference model M
∗
and GradCAM (Selvaraju et al., 2017) for generat-
Algorithm 2: UsefulnessChecker.
Input: Untrained models M
0
, reference method
H
∗
, inputs S
D
with (deceptive) decisions and expl.
{(M
D
(X), H
D
(X)}, untrained classifier model C
Output: (Outlier) Probability p
S
M
0
= s randomly chosen elements from S
D
with
s random in [c
0
|S
D
|, |S
D
|] {We used: c
0
:= 0.33}
Train each model M
0
∈ M
0
on (X, M
D
(X) for
X ∈ S
M
0
S
T
= random subset of S
D
of size c
1
|S
D
| {We
used: c
1
:= 0.8}
C
M
0
= trained classifier model C on
H
∗
(X, M
D
(X), M
0
), M
D
(X)
for X ∈ S
T
and
M
0
∈ M
0
C
M
D
= trained classifier model C on
H
D
(X, M
D
(X), M
D
), M
D
(X)
for X ∈ S
T
Acc(C
M
) := Accuracy of classifier C
M
using
X ∈ S
D
\ S
T
µ =
1
|M
0
|
P
M
0
∈M
0
Acc(C
M
0
)
σ =
1
|M
0
|
q
P
M
0
∈M
0
(Acc(C
M
0
) − µ)
2
p = prob
T > |Acc(C
M
D
) − µ|
T ∼ N (0, σ)
ing reference explanations H
∗
. The CNN is well-
established, conceptually simple and works reason-
ably well. GradCAM was one of the methods said
to have passed elementary sanity checks that many
other methods did not (Adebayo et al., 2018). While
GradCAM is most commonly employed for CNN im-
age recognition the mechanisms for texts are iden-
tical. In fact, (Lertvittayakumjorn and Toni, 2019)
showed that GradCAM on CNNs similar to the one
by (Kim, 2014) leads to outcomes on human tasks that
are comparable to other explanation methods such as
LIME. The GradCAM method, which serves as refer-
ence explanation H
∗
, computes a gradient-weighted
activation map starting from a given layer or neuron
within that layer back to the input X. We apply the
reference explanation method H
∗
, ie. GradCAM, on
the neuron before the softmax layer that represents
the class Y
0
to explain. For generating a high fi-
delity explanation for an incorrectly reported predic-
tion M
D
(X) 6= M
∗
(X) (scenario FT in Figure 1)
we provide as explanation the reference explanation,
i.e. H
D
(X) = H
∗
(X, M
D
(X), M
D
). By definition
reference explanations maximize explanation fidelity
f
O
.
Setup: We employed two datasets. The IMDB
dataset (Maas et al., 2011) consists of movie re-
views and a label indicating positive or negative sen-
timent polarity. We also utilized the Web of Science
(WoS) dataset consisting of abstracts of scientific pa-
Deceptive AI Explanations: Creation and Detection
49

Figure 4: Generated sample explanations for scenarios TT
(top) and FT (bottom) from Figure 1.
pers classified into 7 categories (Kowsari et al., 2017).
Our CNNs for classification achieved accuracies of
87% for IMDB and 75% for WoS trained with 2/3 of
the samples for training and 1/3 for testing. We com-
puted explanations for test data only. For deception
using omission, we removed a randomly chosen set of
words V (see Def. 1), such that their overall contri-
bution to all explanations H
∗
is k% (with a tolerance
of 0.01k %). The contribution of a word v is given
by
P
(i,X)∈F (v,S)
H
∗
(X, M
∗
(X))
i
. For explanation
distortion parameter k (see Definitions 1 and 2) we
state values for each experiment.
ML based Detection: As detector models, we used
CNN models. For supervised learning, the model in-
put is a concatenation of three vectors: i) a text vector
of word indices, ii) a heatmap vector of values ob-
tained via GradCAM, that is a 1:1 mapping of the vi-
sual output shown to the user, and iii) a one-hot pre-
diction vector of the decision. Our ”simple” CNN de-
tector, i.e. classifier, is designed as follows: we per-
form an embedding, concatenate the heatmap vector
with the word embedding before doing a 1D convo-
lution. Then we concatenate the one-hot prediction
vector and use two dense layers. The more ”com-
plex” CNN adds six more conv1D layers: two pro-
cessing the embedding, two on the heatmap vector,
and two after the first concatenation. We used dropout
for regularization. Since labeling is difficult and po-
tentially error-prone, we consider different levels of
label noise, i.e., L ∈ [0, 0.32], such that a fraction L
of all labels were replaced with a random label (dif-
ferent from the correct one). For the detection ex-
periment, we chose samples that were predicted cor-
rectly by the truthful model. For unsupervised learn-
ing, we train 35 classifiers M
0
∈ M
0
being varia-
tions of a CNN network (Kim, 2014), i.e., each of the
following hyperparameters was chosen uniformly at
random for each classifier M
0
: embedding dimension
{32, 64, 128}; 1-3 linear layers; 2-6 conv layers for
the Kim network with varying number of filters. We
also varied the training sets in terms of size and ele-
ments, ie. we trained a model with a subset of T of
size 33, 50 and 100%. Any model was trained using
the Adam optimizer for 100 epochs. Train/Test data
split was 80/20 for all detector models.
Classifiers learning from (deceptive) explanations
as done in our unsupervised approach Usefulness-
Checker tend sometimes to focus on raw inputs X
and disregard explanation relevance scores H
D
i
(X).
That is, they often work well and show little varia-
tion in accuracy despite large variations in explana-
tions. To avoid this, we convolve also an inner repre-
sentation of the network with explanation values en-
forcing stronger entanglement. That is, in the Use-
fulnessChecker model the output of the word embed-
ding of the input is convolved with the explanations
as follows: First, we perform a low-dimensional em-
bedding (just one dimensional) and multiply the em-
bedding values with the explanation values and add
explanation values on top. This is then fed into 3
Conv1D layers followed by two dense layers.
Human-based Detection: We conducted a user
study using the IMDB dataset.
1
For the scenarios of
interest, we compare explanations that are aligned to
the shown prediction, i.e. TT and FT. Two samples
are shown in Figure 4. We recruited a total of 200 par-
ticipants on Amazon Mechanical Turk from the US
having at least a high-school degree. We presented
each participant with 25 predictions together with ex-
planations. They had to answer ”Is the classification
correct?” on a scale of five ranging from strongly dis-
agree to strongly agree. We randomized the choice of
presented samples, i.e. we randomly chose a sample
of the dataset and we randomly chose between sce-
narios TT and FT in Figure 1.
7 RESULTS
Human-based Detection: Out of the 200 partici-
pants, we removed participants that spend less than 5
seconds per question, since we deemed this time too
short to provide a reasonable answer. We also filtered
out participants who always gave the same answer for
all 25 questions. This left 140 participants amounting
to 3,500 answers. Demographics and answer distribu-
tions are in Figure 5 and Table 1.
A t-test of means confirmed that the distributions
differ significantly (p-value of 0.008), though the
mean scores for ”agreeing” of 3.74(TT) and 3.58(FT)
1
The WoS dataset seems less suited since it uses ex-
pert terminology that is often not held by the general pub-
lic from which participants originate as found in (Lertvit-
tayakumjorn and Toni, 2019).
ICAART 2022 - 14th International Conference on Agents and Artificial Intelligence
50

Table 1: Participants Demographics with n = 140 partici-
pants.
Variable Value Percentage
Gender Male 66%
Female 34%
Age ≤ 25 years of age 18%
from 26 to 40 years of age 62%
from 41 to 65 years of age 18%
> 65 years of age 2%
Education High School 16%
Associate Degree 11%
Bachelor’s Degree 56%
Master’s Degree 16%
Doctoral Degree 1%
Figure 5: Distributions of user replies to “The classification
is correct” (1 = strongly disagree to 5 = strongly agree).
show that in absolute terms differences are minor.
This implies that while the majority of humans might
be fooled oftentimes, they have the capability to col-
lectively detect deceptive explanations.
Supervised ML-based Detection: Figure 6 shows
results for IMDB, those for WoS are similar, shown in
Figure 7. The plot shows that for very minor decep-
tion (small k) detection is more difficult. Accuracy
rarely tops 60%, which is fairly low given that 50%
is the baseline for guessing. Accuracy is also more
volatile given label noise. Beyond some threshold
under all scenarios, accuracy exceeds 90% for cor-
rectly deciding whether a decision and/or explanation
are deceptive. Accuracy worsens with greater label
noise, though it is often better than guessing even for
a noise level of 32%. Mostly the complex CNN (with
more layers) outperforms the simple one with one ex-
ception: the scenario where the explanation is always
truthful to the model, but the decision is not. Here, a
simple function allows distinguishing deceptive (FT)
from the non-deceptive scenario (TT). We observed
that for the scenario with noise on non-truthful expla-
nations for correct decisions (TFNoise) small noise
levels can lead to very low test accuracies. Training
accuracies were larger, but mostly close to random
guessing, indicating that the network fails to learn
proper conditions what values constitute a noisy rele-
vance score and which do not.
Unsupervised ML-based Detection: For a single
model, a small probability indicates that it is unlikely
to witness such an (extreme) outcome, i.e. accuracy
or deviation from the average explanation. Thus, a
small probability such as 0.05 indicates a high like-
lihood of deception. Figure 10 shows the average as
well as maximum probability of all 35 models. Detec-
tion ability follows an S-curve, meaning that for de-
ception with parameterized strength k above a thresh-
old detection works fairly well, whereas it fails oth-
erwise. Required noise levels are somewhat higher
for the WoS dataset, as shown in Figure 7 but qualita-
tively, results are identical. The trained classifier per-
forms worse on WoS than IMDB, since WoS is a more
complex dataset. Classifiers vary (relatively) more in
accuracy, which in turn also leads to more variance in
explanations. Looking at the mean and max indicates
that for multiplicative noise (TFNoise) all deceptive
models are reliably detected for k = 0.8, while below
that value at least for the most difficult to detect model
it fails to do so. For k < 0.8, the detection methods
are still valuable to identify suspicious models, mean-
ing that such models exhibit lower probability, but are
not low enough to be certain. The same reasoning
also applies to TFOmit, though here a strong differ-
ence between methods is apparent. The Consisten-
cyChecker yields much better outcomes, highlighting
that even small omissions can be detected reliably. It
shows that statistical analysis is preferable to using a
downstream task. Our models M
0
are very diverse,
ie. models differ by a factor of 3 in terms of training
data and number of layers, as well as in neurons/filters
per layer. We found that reducing (or increasing) the
diversity has a profound impact on results, as shown
in Figures 8 and 9.
8 DIFFICULTY OF DECEPTION
DETECTION
We provide intuition for Algorithm Consistency-
Checker discussing the difficulty of detection de-
pending on noise models and deception strategy.
To compute the probability, we rely on values
s(M) as defined in Algorithm 1. We are in-
terested in the gap G(H
i
, m
i
(X)) := E[(H
i
−
m
i
(X))
2
] between the mean and the relevance score
in the explanation of a feature i. For multiplicative
noise we have H
D
i
(X, M
D
(X), M ) = (1 + U) ·
H
∗
i
(X, M
D
(X), M
D
), where U is uniformly cho-
sen at random from [−k, k]. We shall use a
i
:=
H
∗
i
(X, M
D
(X), M
D
) and m
i
:= m
i
(X) for ease of
notation. We expect that the deviation for a deceptive
explanation and the mean is:
Deceptive AI Explanations: Creation and Detection
51

Figure 6: Supervised detection results for IMDB for scenarios in Figure 1.
Figure 7: ML-based supervised detection results for WoS for scenarios in Figure 1.
Figure 8: Unsupervised detection results for WoS where ap-
proximate models vary only in training data (but have the
same hyperparameters).
Figure 9: Unsupervised detection results for WoS where ap-
proximate models vary in training data and hyperparame-
ters. Detection is more difficult compared to varying train-
ing data only (Figure 8).
G((1 + U )a
i
, m
i
) =E[((1 + U)a
i
− m
i
)
2
]
= E[(a
i
− m
i
)
2
− 2Ua
i
m
i
− U
2
a
2
i
]
= (a
i
− m
i
)
2
+ a
2
i
k
2
/3
The overall deviation s(M) for a model is just the
mean across all features i and inputs X. Detection is
difficult when
X
i,X
(a
i
− m
i
)
2
X
i,X
a
2
k
2
/3 (5)
Put in words, detection is difficult, when the distor-
tion due to deception (right-hand side term in Equa-
tion 5) is small compared to the one due to model
variations M
0
(left hand side term in Equation 5).
The closer a
i
and m
i
are and the larger k, the eas-
ier detection. For omission we get that if feature i
is omitted then G(a
i
, m
i
) = m
2
i
and G(a
i
, m
i
) =
(a
i
− m
i
)
2
. Assume a set F
D
of features is omitted,
where the size of F
D
depends on the parameter k.
We get that deception is difficult if
P
i
(a
i
− m
i
)
2
P
i∈F
D
m
2
i
+
P
i /∈F
D
(a
i
− m
i
)
2
. Clearly, the larger
F
D
the easier detection. Say we omit features with
m
i
= a
i
and we are given the choice of omitting two
features with mean m or one with mean 2m. The
latter is easier to detect since means are squared, ie.
m
2
+ m
2
= 2m
2
< (2m)
2
= 4m
2
. Therefore, it is
easier to detect few highly relevant omitted features
than many irrelevant ones.
Figure 10: Unsupervised detection results for IMDB.
ICAART 2022 - 14th International Conference on Agents and Artificial Intelligence
52

9 RELATED WORK
(Slack et al., 2020) showed how arbitrary explana-
tions for methods relying on perturbations can be gen-
erated for instances by training a classifier with adver-
sarial inputs. (Dimanov et al., 2020) trains a classi-
fier using an explainability loss term for a feature that
should be masked in explanations. (Fukuchi et al.,
2020) showed that biases in decision-making are dif-
ficult to detect in an input-output dataset of a biased
model if the inputs were sampled in a way to disguise
the detector. (Lai and Tan, 2019) used ML (including
explanations) to support detection of deceptive con-
tent. The explanations were non-deceptive.
(Viering et al., 2019) are interested in manipulat-
ing the inner workings of a deep learning network to
output arbitrary explanations. Whether the explana-
tions themselves are convincing or not, is not con-
sidered, i.e., the paper shows many examples of ”in-
credible” explanations that can easily be detected as
non-genuine. (Aivodji et al., 2019) focus on manip-
ulating reported fairness based on a regularized rule
list enumeration algorithm. (Lakkaraju and Bastani,
2019) investigated the effectiveness of misleading ex-
planations to manipulate users’ trust. Decisions were
made using prohibited features such as gender and
race but misleading explanations were supposed to
disguise their usage. Both studies (Aivodji et al.,
2019; Lakkaraju and Bastani, 2019) found that users
can be manipulated into trusting high fidelity but mis-
leading explanations for correct predictions. In con-
trast, we do not generate fake reviews but only gener-
ate misleading justifications for review classifications
and provide detection methods and some formal anal-
ysis.
Inspiration for detecting deceptive explanations
might be drawn from methods used for evaluating the
quality of explanations (Mohseni et al., 2021). In our
setup, quality is a relative notion compared to an ex-
isting explainability method and not to a (human) gold
standard. Papenmeier et al. (Papenmeier et al., 2019)
investigated the influence of classifier accuracy and
explanation fidelity on user trust. They found that
accuracy is more relevant for trust than explanation
quality though both matter.
(Nourani et al., 2019) investigated the impact of
explanations on trust. Poor explanations indeed re-
duce a user’s perceived accuracy of the model, inde-
pendent of its actual accuracy. Explanations’ helpful-
ness varies depending on task and method (Lertvit-
tayakumjorn and Toni, 2019). Explanations are more
helpful in assessing a model’s predictions compared
to its behavior. Some methods support some tasks
better than others. For instance, LIME provides the
most class discriminating evidence, while the layer-
wise relevance propagation (LRP) method (Bach
et al., 2015) helps assess uncertain predictions.
(Adelani et al., 2019) showed how to create and
detect fake online reviews of a pre-specified senti-
ment. In contrast, we do not generate fake reviews
but only generate misleading justifications for review
classifications. Fake news detection has also been
studied(P
´
erez-Rosas et al., 2017; Przybyla, 2020)
based on ML methods and linguistic features ob-
tained through dictionaries. (P
´
erez-Rosas et al., 2017;
Przybyla, 2020) use a labeled data set. Linguistic
cues (Ludwig et al., 2016) such as flattery was used
to detect deception in e-mail communication. We
do not encode explicit, domain-specific detection fea-
tures such as flattery.
Our methods might be valuable for the detection
of fairness and bias – see (Mehrabi et al., 2019) for
a recent overview. There are attempts to prevent ML
techniques from making decisions based on certain at-
tributes in the data, such as gender or race (Ross et al.,
2017) or to detect learnt biases based on representa-
tions (Zhang et al., 2018) or perturbation analysis for
social associations (Prabhakaran et al., 2019). In our
case, direct access to the decision-making system is
not possible — neither during training nor during op-
erations, but we utilize explanations.
In human-to-human interaction, behavioral cues
such as response times (Levine, 2014) or non-verbal
leakage due to facial expressions (Ekman and Friesen,
1969) might have some, but arguably limited im-
pact (Masip, 2017) on deception detection. In our
context, this might pertain, e.g., to computation time.
We do not use such information. Explanations to sup-
port deceptions typically suffer from at least one fal-
lacy such as ”the use of invalid or otherwise faulty
reasoning” (Van Eemeren et al., 2009). Humans can
use numerous techniques to attack fallacies (Damer,
2013), often based on logical reasoning. Such tech-
niques might also be valuable in our context. In par-
ticular, ML techniques have been used to detect lies
in human interaction, eg. (Aroyo et al., 2018).
10 DISCUSSION
Explanations provide new opportunities for deception
(Figure 1) that are expected to rise since AI is becom-
ing more pervasive, more creative (Schneider et al.,
2022), personalized (Schneider and Vlachos, 2021b).
Deceptive explanations might aim at disguising the
actual decision process, e.g., in case it is non-ethical,
or make an altered prediction appear more credible.
While faithfulness of explanations can be clearly ar-
Deceptive AI Explanations: Creation and Detection
53

ticulated mathematically using our proposed decision
and explanation fidelity measures, determining when
an explanation is deceptive, is not always as clear,
since it includes a grey area. That is, an explanation
might be said to be deceptive, but it might also only
be judged as inaccurate or simplified. Thus, deception
detection is not an easy task: While strong deception
is well-recognizable, minor forms are difficult to de-
tect. Furthermore, some form of domain or model
knowledge is necessary. This could be data similar
or, preferably, identical to the model’s training data
under investigation. Domain experts could also pro-
vide information in the form of labeled samples or de-
tection rules, i.e., they can investigate model outputs
and judge them as faithful or deceptive. Identifying
deceptive explanations becomes much easier if model
access and training or testing data are available, i.e.,
it reduces to comparing outputs from models to those
suggested by the (training) data. We recommend reg-
ulatory bodies to pass laws that ensure that auditors
have actual model access since this simplifies the pro-
cess of deception detection. It is one step towards en-
suring that AI is used for the social good.
Detection methods will improve, but so will
strategies for lying. Thus, it is important to anticipate
weaknesses of detection algorithms that deceitful par-
ties might exploit, and mitigate them early on, e.g.,
with the aid of generic security methods (Schlegel
et al., ). The field of explainability evolves quickly
with many challenges ahead (Meske et al., 2021).
This provides ample opportunities for future research
to assess methods for creation and detection of decep-
tive explanations, e.g., methods explaining features or
layers of image processing systems rather than text
(Schneider and Vlachos, 2021a).
11 CONCLUSION
Given economic and other incentives, a new cat
and mouse game between ”liars” and ”detectors” is
emerging in the context of AI. Our work provided
a first move in this game: We structured the prob-
lem, and contributed by showing that detection of de-
ception attempts without domain knowledge is chal-
lenging. Our ML models utilizing domain knowledge
through training data yield good detection accuracy,
while unsupervised techniques are only effective for
more severe deception attempts or given (detailed) ar-
chitectural information of the model under investiga-
tion.
REFERENCES
Adebayo, J., Gilmer, J., Muelly, M., Goodfellow, I., Hardt,
M., and Kim, B. (2018). Sanity checks for saliency
maps. In Neural Information Processing Systems.
Adelani, D., Mai, H., Fang, F., Nguyen, H. H., Yamag-
ishi, J., and Echizen, I. (2019). Generating sentiment-
preserving fake online reviews using neural language
models and their human-and machine-based detec-
tion. arXiv:1907.09177.
Aivodji, U., Arai, H., Fortineau, O., Gambs, S., Hara, S.,
and Tapp, A. (2019). Fairwashing: the risk of ratio-
nalization. In Int. Conf. on Machine Learning(ICML).
Aroyo, A. M., Gonzalez-Billandon, J., Tonelli, A., Sciutti,
A., Gori, M., Sandini, G., and Rea, F. (2018). Can a
humanoid robot spot a liar? In Int. Conf. on Humanoid
Robots, pages 1045–1052.
Bach, S., Binder, A., Montavon, G., Klauschen, F., M
¨
uller,
K.-R., and Samek, W. (2015). On pixel-wise explana-
tions for non-linear classifier decisions by layer-wise
relevance propagation. PloS one.
Damer, T. E. (2013). Attacking faulty reasoning. Cengage
Learning, Boston, Massachusetts.
Dimanov, B., Bhatt, U., Jamnik, M., and Weller, A. (2020).
You shouldn’t trust me: Learning models which con-
ceal unfairness from multiple explanation methods. In
SafeAI@ AAAI.
Ekman, P. and Friesen, W. V. (1969). Nonverbal leakage
and clues to deception. Psychiatry, 32(1):88–106.
Fukuchi, K., Hara, S., and Maehara, T. (2020). Faking
fairness via stealthily biased sampling. In Pro. of the
AAAI Conference on Artificial Intelligence.
Fusco, F., Vlachos, M., Vasileiadis, V., Wardatzky, K., and
Schneider, J. (2019). Reconet: An interpretable neu-
ral architecture for recommender systems. In Proc.
IJCAI.
Kim, Y. (2014). Convolutional neural networks for sentence
classification. In Proc. Empirical Methods in Natural
Language Processing (EMNLP).
Kowsari, K., Brown, D. E., Heidarysafa, M., Meimandi,
K. J., Gerber, M. S., and Barnes, L. E. (2017). Hdltex:
Hierarchical deep learning for text classification. In
IEEE Int. Conference on Machine Learning and Ap-
plications (ICMLA).
Lai, V. and Tan, C. (2019). On human predictions with ex-
planations and predictions of machine learning mod-
els: A case study on deception detection. In Proceed-
ings of the Conference on Fairness, Accountability,
and Transparency, pages 29–38.
Lakkaraju, H. and Bastani, O. (2019). How do i fool you?:
Manipulating user trust via misleading black box ex-
planations. arXiv preprint arXiv:1911.06473.
Lertvittayakumjorn, P. and Toni, F. (2019). Human-
grounded evaluations of explanation methods for text
classification. arXiv preprint arXiv:1908.11355.
Levine, T. R. (2014). Encyclopedia of deception. Sage Pub-
lications.
ICAART 2022 - 14th International Conference on Agents and Artificial Intelligence
54

Ludwig, S., Van Laer, T., De Ruyter, K., and Friedman,
M. (2016). Untangling a web of lies: Exploring au-
tomated detection of deception in computer-mediated
communication. Journal of Management Information
Systems, 33(2):511–541.
Maas, A., Daly, R., Pham, P., Huang, D., Ng, A., and Potts,
C. (2011). Learning word vectors for sentiment anal-
ysis. In Association for Computat. Linguistics (ACL).
Masip, J. (2017). Deception detection: State of the art and
future prospects. Psicothema.
Mehrabi, N., Morstatter, F., Saxena, N., Lerman, K., and
Galstyan, A. (2019). A survey on bias and fairness in
machine learning. arXiv preprint arXiv:1908.09635.
Meske, C., Bunde, E., Schneider, J., and Gersch, M. (2021).
Explainable artificial intelligence: objectives, stake-
holders, and future research opportunities. Informa-
tion Systems Management.
Mohseni, S., Zarei, N., and Ragan, E. D. (2021). A mul-
tidisciplinary survey and framework for design and
evaluation of explainable ai systems. Transactions on
Interactive Intelligent Systems.
Nourani, M., Kabir, S., Mohseni, S., and Ragan, E. D.
(2019). The effects of meaningful and meaningless
explanations on trust and perceived system accuracy
in intelligent systems. In AAAI Conference on Artifi-
cial Intelligence.
Papenmeier, A., Englebienne, G., and Seifert, C. (2019).
How model accuracy and explanation fidelity influ-
ence user trust. arXiv preprint arXiv:1907.12652.
P
´
erez-Rosas, V., Kleinberg, B., Lefevre, A., and Mihalcea,
R. (2017). Automatic detection of fake news. arXiv
preprint arXiv:1708.07104.
Petsiuk, V., Das, A., and Saenko, K. (2018). Rise: Ran-
domized input sampling for explanation of black-box
models. arXiv preprint arXiv:1806.07421.
Prabhakaran, V., Hutchinson, B., and Mitchell, M. (2019).
Perturbation sensitivity analysis to detect unintended
model biases. arXiv preprint arXiv:1910.04210.
Przybyla, P. (2020). Capturing the style of fake news. In
Proceedings of the AAAI Conference on Artificial In-
telligence, volume 34, pages 490–497.
Ross, A. S., Hughes, M. C., and Doshi-Velez, F. (2017).
Right for the right reasons: training differentiable
models by constraining their explanations. In Int.
Joint Conference on Artificial Intelligence (IJCAI).
Schlegel, R., Obermeier, S., and Schneider, J. Structured
system threat modeling and mitigation analysis for in-
dustrial automation systems. In International Confer-
ence on Industrial Informatics.
Schneider, J., Basalla, M., and vom Brocke, J. (2022). Cre-
ativity of deep learning: Conceptualization and as-
sessment. In International Conference on Agents and
Artificial Intelligence (ICAART).
Schneider, J. and Handali, J. P. (2019). Personalized expla-
nation for machine learning: a conceptualization. In
European Conference on Information Systems (ECIS).
Schneider, J. and Vlachos, M. (2021a). Explaining neural
networks by decoding layer activations. In Int. Sym-
posium on Intelligent Data Analysis.
Schneider, J. and Vlachos, M. (2021b). Personalization of
deep learning. In Data Science–Analytics and Appli-
cations.
Selvaraju, R. R., Cogswell, M., Das, A., Vedantam, R.,
Parikh, D., and Batra, D. (2017). Grad-cam: Visual
explanations from deep networks via gradient-based
localization. In Int. Conference on Computer Vision
(ICCV).
Slack, D., Hilgard, S., Jia, E., Singh, S., and Lakkaraju, H.
(2020). Fooling lime and shap: Adversarial attacks on
post hoc explanation methods. In AAAI/ACM Confer-
ence on AI, Ethics, and Society.
Van Eemeren, F. H., Garssen, B., and Meuffels, B. (2009).
Fallacies and judgments of reasonableness: Empir-
ical research concerning the pragma-dialectical dis-
cussion rules, volume 16. Springer Science & Busi-
ness Media, Dordrecht.
Viering, T., Wang, Z., Loog, M., and Eisemann, E. (2019).
How to manipulate cnns to make them lie: the grad-
cam case. arXiv preprint arXiv:1907.10901.
Wu, Y., Ngai, E. W., Wu, P., and Wu, C. (2020). Fake online
reviews: Literature review, synthesis, and directions
for future research. Decision Support Systems.
Zhang, Q., Wang, W., and Zhu, S.-C. (2018). Examining
cnn representations with respect to dataset bias. In
AAAI Conf. on Artificial Intelligence.
Deceptive AI Explanations: Creation and Detection
55
