
Translational Robustness of Neural Networks Trained for Transcription
Factor Binding Site Classification
Gergely Pap
a
and Istv
´
an Megyeri
b
University of Szeged, Hungary
Keywords:
Transcription Factor Binding Site, Convolutional Neural Networks, Adversarial Training, Sequence Motifs.
Abstract:
Classifying DNA sequences based on their protein binding profiles using Deep Learning has enjoyed con-
siderable success in recent years. Although these models can recognize binding sites at high accuracy, their
underlying behaviour is unknown. Meanwhile, adversarial attacks against deep learning models have re-
vealed serious issues in the fields of image- and natural language processing related to their black box nature.
Analysing the robustness of Transcription Factor Binding Site classifiers urges us to develop adversarial at-
tacks for them. In this work, we introduce shifting as an adversarial data augmentation so that it quantifies
the translational robustness. Our results show that despite its simplicity our attack can significantly affect
performance. We evaluate two architectures using two data sets with three shifting strategies and train robust
models with adversarial data augmentation.
1 INTRODUCTION
1.1 Brief Biological Overview
One of the most important regulators in a cell’s biol-
ogy are Transcription Factors (TFs) (Stormo, 2000).
TFs are responsible for key processes regarding gene
expression, understanding the nature of their work-
ings is of paramount importance in microbiology and
related fields. TFs are proteins which can bind to
DNA strands to facilitate transcription: the process
of turning DNA nucleotide sequence data into RNA.
TFs generally have binding sites associated with them
called Transcription Factor Binding Sites (TFBSs).
These are identifiable regions, where a TF usually
binds the DNA strands. A TFBS is around 10 nu-
cleotide base pair in length. The nucleotides (basic
building blocks of DNA; A: adenine, C: cytosine, G:
guanine, T: thymine) inside the TFBSs are conserved
sequences, the sequence pattern that they form is re-
peated several times in the genome of biological or-
ganisms. This pattern of the order of nucleotides is
also called the TFs’ motif. Locating and detecting
these motifs and TFBSs are important steps to better
understand TFs’ biological mechanisms and to exam-
ine these key control points’ effects on gene regula-
a
https://orcid.org/0000-0002-6641-5845
b
https://orcid.org/0000-0002-7918-6295
tion.
1.2 Connection to Deep Learning
Through Next Generation Sequencing techniques, the
number of available data sets increased rapidly (Bern-
stein et al., 2012), thus it was feasible to use deep
learning to examine nucleotide sequence data. Deep
Learning models have achieved considerable suc-
cess in the field of TFBS classification (Zhou and
Troyanskaya, 2015). At first, Convolutional Neu-
ral Networks (CNNs) (Alipanahi et al., 2015; Zeng
et al., 2016) were applied to nucleotide sequence
data, then Recurrent Neural Networks (RNNs) (Lan-
chantin et al., 2017) such as Long Short-Term Mem-
ory (LSTM) cells were used and in recent years, hy-
brid architectures containing both convolutional and
recurrent layers made their impact on this task (Has-
sanzadeh and Wang, 2016; Quang and Xie, 2019;
Park et al., 2020). The dominant success of the atten-
tion mechanism improved performance and opened a
new way to interpret TFBS classifier network deci-
sions.
1.3 Relation to Interpretability and
Adversarial Robustness
Recent studies analyse the behaviour of trained TFBS
classifiers while searching for interpretable features
Pap, G. and Megyeri, I.
Translational Robustness of Neural Networks Trained for Transcription Factor Binding Site Classification.
DOI: 10.5220/0010769100003116
In Proceedings of the 14th International Conference on Agents and Artificial Intelligence (ICAART 2022) - Volume 3, pages 39-45
ISBN: 978-989-758-547-0; ISSN: 2184-433X
Copyright
c
2022 by SCITEPRESS – Science and Technology Publications, Lda. All rights reserved
39
Expectation
Observation
TFBS
TFBS
TFBS
TFBS
Binding ✓
Context window
Sequences
Model Prediction
Binding ✓
Binding ✓
Not Binding ✗
Context window - shifted by 10
Context window - shifted by 10
Context window
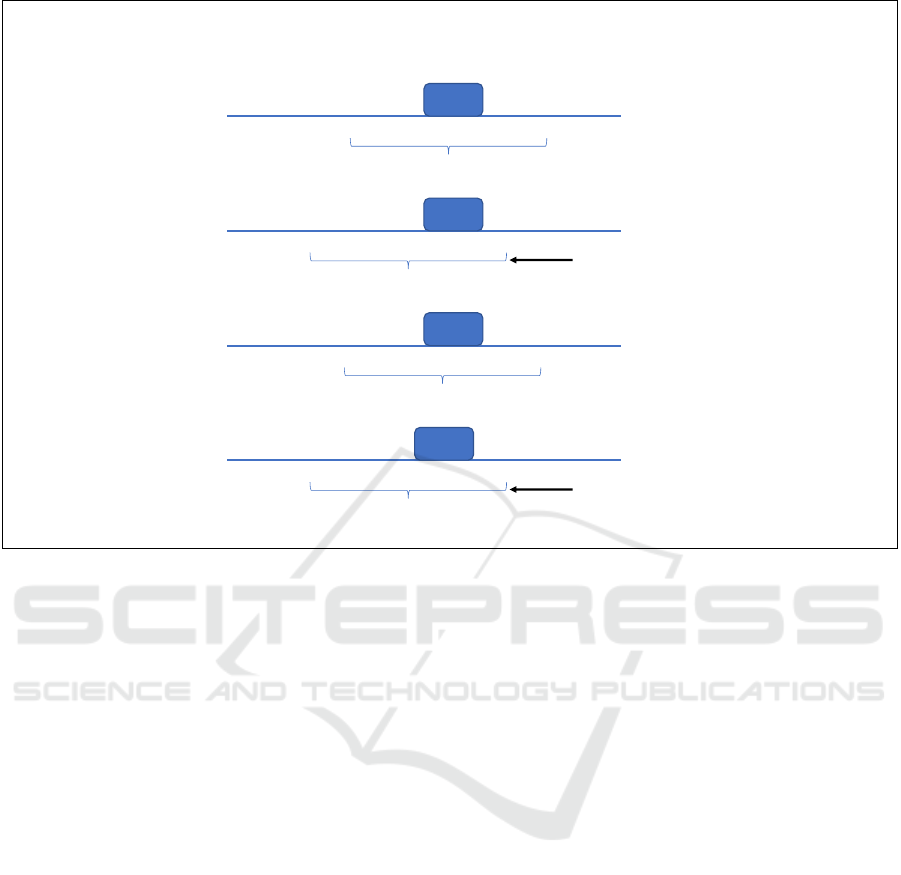
Figure 1: Visualization of the expected and observed transcription factor binding site classification. The motifs (made of
consensus nucleotides) are generally located near the center of the sequences (e.g., starting from the 45. position with a length
of 10 bases in a 100 long sequence). Translating the sequence (as in shifting the position horizontally) should not influence
performance. However, we observe significant accuracy decrease when utilizing transformations such that the context window
is moved in either direction by several nucleotides. Blue lines denote the large neighborhood of the TFBS (most of which is
not used for training). Red lines show the 100 nucleotides passed through the CNN. Blue arrows mark the position shift and
the red lines show the new 100 nucleotides with the TFBS. (The only difference between the original and the shifted sequence
is 20 nucleotides, 10 disappearing from one end and 10 new appearing on the other due to the shift of the context window,
i.e., the sequence input of the model. The TFBS and the nucleotides close to it are unaltered.)
(Koo and Ploenzke, 2020) (Lanchantin et al., 2017)
(Zhou and Troyanskaya, 2015; Alipanahi et al.,
2015). Such features might help biologists to bet-
ter characterize specific TF binding events. Although
neural networks achieve remarkable performance on
TFBS classification, they are black box models. That
is, the underlying behaviour is unknown. Thus ex-
amining TFs using Deep Neural Networks (DNNs)
might require alternative approaches.
In other domains such as image classification
or natural language processing, adversarial examples
revealed that state of the art models are prone to
learn non-robust features. These examples are gener-
ated from natural samples using semantics-preserving
transformations in such a way that the model will mis-
label the modified input. For images, a commonly
used transformation is applying tiny norm bounded
additive noise (Brendel et al., 2019). In NLP, defining
the modification is more challenging, but it is still fea-
sible to find adversarial examples. A recent approach
replaces input words by their synonyms to mislead the
model (Morris et al., 2020). This sensitivity to adver-
sarial examples introduces concerns regarding their
interpretability.
These two results seem contradictory: the high
sensitivity of the models in other domains and the in-
terpretabality of the TFBS classifiers. In this work,
we aim to investigate this problem more deeply and
examine TFBS classifiers from a robustness perspec-
tive.
1.4 Examining and Evaluating
Translations
To the best of our knowledge no experiments or stud-
ies were communicated regarding TFBS and network
vulnerability. Our contributions in this work are as
follows:
• We apply input shifting to find adversarial exam-
ples for state-of-the-art TFBS classifiers.
• We show that these models are sensitive to in-
ICAART 2022 - 14th International Conference on Agents and Artificial Intelligence
40

put shifting despite their excellent performance on
unmodified data.
• We propose a training method inspired by adver-
sarial training which improves the models’ robust-
ness against these kinds of attacks.
Our experiments conducted on two datasets imply
that the features considered important by the origi-
nal networks are not necessarily the humanly desired
ones. Our code is available from
1
.
2 TRANSCRIPTION FACTOR
BINDING SITE
CLASSIFICATION
In this section we give an introductory overview in
connection to TFBS and CNNs. The main concepts
necessary to facilitate further understanding of the ad-
versarial robustness of TFBSs classifier models are
explained below. A reader well-versed in the litera-
ture of TFBS classification might wish to skip to Sec-
tion 3.
2.1 Default Approach
The success of DeepBind (Alipanahi et al., 2015) ush-
ered many follow-up works to use CNNs for TFBS
detection. The TFBS data sets usually contain two
classes, one of which consists of sequences with TF-
BSs (three positive example sequences belonging to
Sp1 are shown in Figure 2). The learner is expected
to use convolutional filters over the four channels
(here the nucleotides of A,C,G,T - instead of an im-
age’s colour channels of R,G,B). One hypothesis for
the success of convolutional neurons regarding TFBS
classification is the motif scanner idea: the weights
inside the neurons are able to learn a representation
(very similar to) the sequence logo of a TF. That is,
for some neurons the weights over the channels can
be transformed to a format closely resembling a PWM
(Position Weight Matrix). PWMs are ways to store
and present information about the nucleotides of a
binding site. In a PWM each row corresponds to
one symbol of the alphabet, e.g., nucleic acids, and
each column corresponds to one position in the pat-
tern (Zhang, 2013). For a sequence length of 15, 4
rows of the nucleotides are shown, where the value in
a given position (column) and nucleotide (row) means
the probability (log-likelihood) of that nucleotide’s
occurrence at that index in the binding site. A simple
visual explanation is given in Figure 3. To summarize,
1
https://github.com/istvanmegyeri/tf translational
robustness
the learned weights of a convolutional neuron can be
extracted and numerically transformed to be similar
to a 2D matrix of a TF’s PWM.
2.2 Issue of Performance Regarding the
motif scanners
Given that some of the neurons learn representa-
tions similar to PWMs, when such a neuron con-
volves over a sequence containing the corresponding
TFBS, it should produce a high activation and the net-
work would be expected to classify the instance cor-
rectly due to the motif scanner observation. Further-
more most TFBSs are located near the middle of a
sequence (assuming a preprocessed dataset) and are
recognised relatively well. Since convolutions are
translation-invariant, moving the TFBS along the se-
quence should not result in a harder task\lower model
performance. The above-described shift of a TFBS
is similar to a pixel-wise location transformation of
an MNIST digit (Kauderer-Abrams, 2017), in which
case, if the digit is moved several pixels in either di-
rection, it should still be recognised and classified by
the CNN model correctly. However when the input
sequences are shifted, the model’s performance de-
creases (Figure 1).
3 ATTACKS AND DEFENCES
We selected shifting (lengthwise translation) as the
input modification for our attacks. Our reasoning is
as follows: Firstly, TFBS classifiers are commonly
trained using varying input lengths. In (Alipanahi
et al., 2015; Zeng et al., 2016) 101 base pairs (bp)
while in (Zhou and Troyanskaya, 2015; Park et al.,
2020) 1000 bp are used. Usually, the longer the in-
put lengths, the better the model’s performance. Sec-
ondly, due to the fact that the convolution operation
is translation invariant, it seems reasonable to expect
CNNs to be also resilient to small shifting. Above
all, we can control arbitrarily the preservation or de-
struction of the semantics by defining a bound on the
shifted positions
2
.
For each shifting strategy, we assume that the in-
put contains the binding site in the middle of the se-
quence and is longer than what the model expects
(e.g., the sequences in the data all have a length of
100 bp, and the models were trained using only 80 bp,
so that we have a window of 20 bp for translation).
We exclude slices that would interfere with the mo-
tif (i.e., remove nucleotides from the middle part of
2
http://jaspar.genereg.net/matrix/MA0079.3/
Translational Robustness of Neural Networks Trained for Transcription Factor Binding Site Classification
41

Three example sequences containing a binding site of
SP1
aggcggcccgccgaggcgcaggtgcacagcccggccggcccgcccgcgccGCCCCGCCCCTggcggtagcacacgccccgccttcccatccggagcgtgacgtcaaggggg
cgggaaagggactggggcgtggaggcgatctgggggcgggtcaaacgctgGCCCCGCCCCTctgcaggccccgtccctcagtgtccatacgtgcttgtgctagggcgcctg
agaggcgagtgatcggacaacttctgcacctcccggaagcggctgcgccgGCCCCGCCCCTccagaggcaggcgtggcctcatgaataatgaatcgtgcgggggaggggcc
Figure 2: A transcription factor binding site is a sequence
pattern of nucleotides that can be found in several places in
a biological entity’s DNA and is bound by a specific tran-
scription factor protein to regulate gene expression.
A 0.098 0.000 0.011 0.000 0.000 0.156 0.000 0.000 0.000 0.121 0.075
C 0.204 0.712 0.767 1.000 0.992 0.000 1.000 1.000 0.765 0.728 0.569
G 0.489 0.074 0.000 0.000 0.000 0.529 0.000 0.000 0.000 0.000 0.084
T 0.208 0.215 0.221 0.000 0.008 0.315 0.000 0.000 0.235 0.151 0.272
Figure 3: Position Weight Matrix (PWM) and sequence
logo for MA0079.3
3
(Fornes et al., 2019).
the sequence). Based on this, we defined three shift-
ing strategies. We denote them as No Shift: removing
an equal number of bases from both sides. Rnd: the
starting index is randomly selected. Worst: the shift
producing the highest loss value.
The Worst method leads to the largest increment
in network loss. For larger input sequences, we might
relax the worst criteria and simply use the one pro-
ducing the highest loss from n random shifts. We de-
note it by W-of-n. From the adversary’s point of view,
the Worst is a black box attack which uses only the
model’s output probability to seek for adversarial in-
put.
After evaluating the models with the above-
mentioned attacks, we incorporated all shifting strate-
gies into the training process in order to make the
models robust or at least less sensitive to these
changes. During training we used one of the follow-
ing strategies to help the networks learn more robust
features: shortened the sequences from both ends by
the same value [No Shift], shifted each sequence at
a random index [Rnd], shifted the sequence at the
position which gave the highest loss with respect to
the current model [Worst]. The maximum amount by
which the sequences could be shifted were calculated
by subtracting the models’ input length from the orig-
inal sequence length.
4 EXPERIMENTAL SETUP
In this section, we detail our experiments. First, we
describe the datasets, then the network architectures
and finally the evaluation metrics.
We used two datasets. The smaller dataset was
the ENCODE-DREAM in vivo Transcription Factor
Binding Site Prediction Challenge, we acquired the
sequences from
4
(Zeng et al., 2016) and denote it
as D
s
. The set contains two machine learning tasks,
in which the entities belonging to the negative class
are different. The ’motif discovery’ data set uses
the shuffled versions of the binding examples as the
other class while the ’motif occupancy’ contains se-
quences, that were not bound in the TF binding ex-
periments (ChIP-seq). From the D
s
TFBS data set 3
TFs were selected, each one of them has a discov-
ery and an occupancy task, and their learning pro-
files regarding accuracy shows a significant differ-
ence. The original length of the sequences in the
database is 101 bp. We used the data sets from the dis-
covery and the occupancy tasks for the following TFs:
SydhImr90MafkIggrab (M), SydhK562Znf143Iggrab
(Z), HaibH1hescSp1Pcr1x (S) with lengths of 75, 90,
95 and 101. The amount of shifting was limited to
preserve the information from the central region.
The larger machine learning task (D
l
) is from
(Zhou and Troyanskaya, 2015). The data was down-
loaded from
5
. D
l
has 690 labels associated with 4.4
million train entities. Chromosomes 8 and 9 were sep-
arated as the test set (amounting to 0.45m examples).
Here we experiment with the inputs’ lengths also, but
instead of only reduction, we appended 100-100 nu-
cleotides on both sides of the original training entities
to have the opportunity to examine a larger scope. We
used Genome Reference Consortium Human Build 37
(GRCh37) to obtain the extra sequences. Beside the
1000 length bp, we also used a 900 length version of
this dataset.
Building upon the architectural choices of Deep-
Bind and the CNN from (Zeng et al., 2016), we con-
ducted experiments on a two-layer convolutional net-
work as our base(line) main subject for the task of
binary classification. The network has two convo-
lutional layers with filter size 256 and 64, and with
kernel size 24 and 12 respectively, each followed by
a ReLU activation. Then a global max pooling and
two Dense layers are applied with 500 and 2 neu-
rons with ReLU and Softmax activation respectively.
The interpretability of convolutional kernels was es-
tablished in the DeepBind study and the fact that
(some) convolutional neurons learn TFBS nucleotide
4
http://cnn.csail.mit.edu/
5
http://deepsea.princeton.edu/help/
ICAART 2022 - 14th International Conference on Agents and Artificial Intelligence
42

patterns enjoyed considerable acceptance from the
community. In theory, a properly trained model’s
first layer kernels (or a subset of them) would en-
code the 4xL
bindingsite
(or motif) information respec-
tive of a given TF. This would enable CNNs to learn
new motifs and recognise unknown nucleotide se-
quence patterns from binding sites. Following the
machine learning task for the DeepSea article’s data
base (Zhou and Troyanskaya, 2015) and utilizing the
SOTA TbiNet (Park et al., 2020) architecture, we
tested the CNN+LSTM hybrid network, which also
employs an attention mechanism. The interpretability
of such an architecture could very well be established
with trials, passing through gradients and (layer) ac-
tivation visualizations. We tried to preserve the orig-
inal parameters and hyper-parameters of the learner
as much as possible. As this architecture contains a
CNN feature extractor, an attention module and a re-
current (bidirectional LSTM) layer to learn regulatory
grammar, we hoped to gather supporting evidence
about the workings of the model. Due to the attention
layer, it is expected from the model (at least to some
degree) to be able to recognise important parts of the
input for successful classification. As we have seen in
the experimental results in Tables 1 and 2, relying on
the motif scanner hypothesis might not be the most
prudent way to unravel these TFBS models. How-
ever, for both interpretability cases, we hypothesize
that the networks learn a lot of ”noise” or otherwise
humanly uninterpretable features. These might just be
useful for the separation of the training sets and gener-
alise poorly to other unseen examples. The evaluation
metrics for the D
l
data set are Area Under the Receiv-
ing Operating Characteristics (AUROC) and the area
under the precision-recall curve (AUPR). For the D
s
dataset, we use simple accuracy.
5 RESULTS
According to the experimental setups, we trained the
corresponding architectures on both datasets and for
each shifting strategy. Then we evaluated the obtained
models using the three shifting strategies again on the
test set. That is for each task, we have three models
and three evaluation modes.
The results for the D
s
dataset are in Table 1. For
comparison, we present the results for the vanilla
model that is trained on unmodified sequence length
(101 bp). If we use the no shift strategy, the perfor-
mance remains almost the same even for the smallest
sequence length 75. The largest drop is 0.042 for S-
75, while the smallest is 0.0102. On average the re-
duction is 0.0195. It confirms that the semantic of the
input is kept even for the smallest sequence length.
However, the worst-case performance of these mod-
els is different. Even at the largest examined sequence
lengths, a more noticeable performance degradation is
present, though the relative input length difference is
modest: 95 vs 101.
Considering other strategies, we see better re-
sults on the worst-case performance. It is somewhat
improved, conceding that we apply random shifting
during training. However, worst-case performance
is highest when worst shift is involved at training
time. This confirms the model can learn translation-
invariant features, but those are used only when ad-
versarial training is applied. In some cases during
our training runs, we noticed that the models were un-
able to minimize the loss on the worst shifted training
data. Removing the regularization solved the prob-
lem except for the S-75. We hypothesize that learning
translation-invariant features requires more capacity
from the models.
In Table 2, we can see similar tendencies on the
D
l
dataset using the attention based TbiNet model.
Removing 100 bp has negligible impact for no shift
evaluation. In contrast, the performance according to
both metrics drops significantly when the worst shift-
ing strategy is applied. Even simple random shifting
causes remarkable degradation.
6 CONCLUSIONS
After examining the effect of adversarial input shift-
ing for a Transcription Factor Binding Site classifi-
cation task, a steady drop in performance can be ob-
served for a simpler CNN and for a more complex
CNN+LSTM model with an attention mechanism.
Both learners are supposed to be able to handle sim-
ple translation or random starting position picking for
shorter length entities, however they are not perform-
ing well under the above-mentioned conditions. We
show that incorporating these modified examples into
the training process results in models that are more ro-
bust and can better cope with the challenges that the
augmented sequences pose.
ACKNOWLEDGEMENTS
This research was supported by the Ministry of In-
novation and Technology NRDI Office within the
framework of the Artificial Intelligence National Lab-
oratory Program and the Artificial Intelligence Na-
tional Excellence Program (grant 2018-1.2.1-NKP-
Translational Robustness of Neural Networks Trained for Transcription Factor Binding Site Classification
43

Table 1: Results on D
s
dataset using the CNN and three shifting methods for evaluation and training. S, M and Z mean
HaibH1hescSp1Pcr1x, SydhImr90MafkIggrab and SydhK562Znf143Iggrab respectively. Each 3 by 3 block represents one
task from the dataset for a specific sequence length. * means that the model was trained without regularization. The perfor-
mance drops if worst shift is applied, which implies that the model uses features which are not position-invariant. Although
these models would be able to learn invariant features, they only seem to do so when worst shifting is involved at training.
TF train
discovery occupancy
evaluation strat. evaluation strat.
No Shift Rnd Worst No Shift Rnd Worst
S-75
No Shift 0.7158 0.7124 0.5029 0.7435 0.7399 0.5449
Rnd 0.7240 0.7240 0.5235 0.7749 0.7739 0.5677
Worst 0.5015 0.5015 0.5015 0.7301 0.7290 0.6423
S-90
No Shift 0.7321 0.7316 0.6394 0.7582 0.7582 0.6600
Rnd 0.7542 0.7558 0.6497 0.7653 0.7679 0.6765
Worst 0.7285* 0.7324* 0.6600* 0.7489 0.7485 0.6958
S-95
No Shift 0.7466 0.7463 0.6834 0.7542 0.7544 0.7017
Rnd 0.7468 0.7456 0.6894 0.7505 0.7507 0.6891
Worst 0.7607 0.7620 0.7212 0.7563 0.7571 0.7265
S-101 No Shift 0.7578 n/a. n/a. 0.7537 n/a. n/a.
M-75
No Shift 0.9292 0.9229 0.8493 0.7302 0.7302 0.5972
Rnd 0.9302 0.9270 0.8549 0.7336 0.7326 0.6209
Worst 0.9268 0.9213 0.8658 0.7239 0.7242 0.6848
M-90
No Shift 0.9303 0.9296 0.9061 0.7368 0.7349 0.6485
Rnd 0.9337 0.9337 0.9141 0.7382 0.7373 0.6734
Worst 0.9327 0.9322 0.9190 0.7372 0.7377 0.7193
M-95
No Shift 0.9352 0.9342 0.9218 0.7416 0.7416 0.6902
Rnd 0.9378 0.9382 0.9255 0.7433 0.7442 0.7107
Worst 0.9363 0.9358 0.9272 0.7385 0.7388 0.7226
M-101 No Shift 0.9394 n/a. n/a. 0.7478 n/a. n/a.
Z-75
No Shift 0.8655 0.8618 0.7505 0.6484 0.6484 0.4825
Rnd 0.8760 0.8703 0.7656 0.6590 0.6546 0.4759
Worst 0.8726 0.8679 0.7969 0.6177 0.6177 0.5701
Z-90
No Shift 0.8777 0.8790 0.8327 0.6615 0.6645 0.5649
Rnd 0.8748 0.8739 0.8264 0.6646 0.6653 0.5805
Worst 0.8791 0.8775 0.8540 0.6606 0.6599 0.6043
Z-95
No Shift 0.8821 0.8802 0.8519 0.6671 0.6675 0.6064
Rnd 0.8854 0.8885 0.8654 0.6676 0.6664 0.6125
Worst 0.8818 0.8811 0.8614 0.6635 0.6648 0.6327
Z-101 No Shift 0.8822 n/a. n/a. 0.6686 n/a. n/a.
Table 2: Results on the D
l
dataset using TBiNet with 900 and 1000 as sequence lengths. The performance drops according to
both metrics if worst shift is applied, which implies that the model uses features which are not position-invariant. The worst
performance improves on the test set, if the model was trained on augmented data.
length train
AUROC AUPR
No Shift Rnd W-of-20 No Shift Rnd W-of-20
900
No Shift 0.9423 0.9133 0.7702 0.3168 0.2305 0.0693
Rnd 0.9426 0.9364 0.8881 0.3088 0.2530 0.1086
W-of-20 0.9319 0.9303 0.9055 0.2258 0.2178 0.1431
1000
No Shift 0.9428 0.9302 0.8605 0.3185 0.2694 0.1268
Rnd 0.9453 0.9409 0.9105 0.3209 0.2860 0.1644
W-of-20 0.9380 0.9367 0.9194 0.2680 0.2564 0.1838
ICAART 2022 - 14th International Conference on Agents and Artificial Intelligence
44

2018-00008), as well as grant NKFIH-1279-2/2020.
Both authors contributed equally.
REFERENCES
Alipanahi, B., Delong, A., Weirauch, M. T., and Frey, B. J.
(2015). Predicting the sequence specificities of DNA-
and rna-binding proteins by deep learning. Nature
biotechnology, 33(8):831–838.
Bernstein, B., Birney, E., Dunham, I., Green, E., Gunter, C.,
and Snyder, M. (2012). Consortium ep. an integrated
encyclopedia of DNA elements in the human genome.
Nature, 489(7414):57–74.
Brendel, W., Rauber, J., K
¨
ummerer, M., Ustyuzhaninov, I.,
and Bethge, M. (2019). Accurate, reliable and fast ro-
bustness evaluation. In Wallach, H., Larochelle, H.,
Beygelzimer, A., d Alch
´
e-Buc, F., Fox, E., and Gar-
nett, R., editors, Advances in Neural Information Pro-
cessing Systems, volume 32. Curran Associates, Inc.
Fornes, O., Castro-Mondragon, J. A., Khan, A.,
van der Lee, R., Zhang, X., Richmond, P. A., Modi,
B. P., Correard, S., Gheorghe, M., Barana
ˇ
si
´
c, D.,
Santana-Garcia, W., Tan, G., Ch
`
eneby, J., Ballester,
B., Parcy, F., Sandelin, A., Lenhard, B., Wasser-
man, W. W., and Mathelier, A. (2019). JASPAR
2020: update of the open-access database of transcrip-
tion factor binding profiles. Nucleic Acids Research,
48(D1):D87–D92.
Hassanzadeh, H. R. and Wang, M. D. (2016). Deeperbind:
Enhancing prediction of sequence specificities of dna
binding proteins. In 2016 IEEE International Con-
ference on Bioinformatics and Biomedicine (BIBM),
pages 178–183. IEEE.
Kauderer-Abrams, E. (2017). Quantifying translation-
invariance in convolutional neural networks. arXiv
preprint arXiv:1801.01450.
Koo, P. K. and Ploenzke, M. (2020). Deep learning for
inferring transcription factor binding sites. Current
Opinion in Systems Biology, 19:16–23.
Lanchantin, J., Singh, R., Wang, B., and Qi, Y. (2017).
Deep motif dashboard: Visualizing and understand-
ing genomic sequences using deep neural networks.
In Pacific Symposium on Biocomputing 2017, pages
254–265. World Scientific.
Morris, J., Lifland, E., Yoo, J. Y., Grigsby, J., Jin, D., and
Qi, Y. (2020). Textattack: A framework for adversar-
ial attacks, data augmentation, and adversarial train-
ing in nlp. In Proceedings of the 2020 Conference on
Empirical Methods in Natural Language Processing:
System Demonstrations, pages 119–126.
Park, S., Koh, Y., Jeon, H., Kim, H., Yeo, Y., and Kang, J.
(2020). Enhancing the interpretability of transcription
factor binding site prediction using attention mecha-
nism. Scientific Reports, 10(1):13413.
Quang, D. and Xie, X. (2019). Factornet: A deep learn-
ing framework for predicting cell type specific tran-
scription factor binding from nucleotide-resolution se-
quential data. Methods, 166:40–47. Deep Learning in
Bioinformatics.
Stormo, G. D. (2000). DNA binding sites: representation
and discovery. Bioinformatics, 16(1):16–23.
Zeng, H., Edwards, M., Liu, G., and Gifford, D.
(2016). Convolutional neural network architectures
for predicting DNA-protein binding. Bioinformatics,
32:i121–i127.
Zhang, X. (2013). Position weight matrices. In Dubitzky,
W., Wolkenhauer, O., Cho, K.-H., and Yokota, H., ed-
itors, Encyclopedia of Systems Biology, pages 1721–
1722. Springer New York, New York, NY.
Zhou, J. and Troyanskaya, O. (2015). Predicting effects
of noncoding variants with deep learning-based se-
quence model. Nature methods, 12.
Translational Robustness of Neural Networks Trained for Transcription Factor Binding Site Classification
45
