
ScaPMI: Scaling Parameter for Metric Importance
Ramisetty Kavya, Jabez Christopher and Subhrakanta Panda
Department of Computer Science and Information Systems, BITS Pilani, Hyderabad Campus, Telangana, India
Keywords:
Classifiers, Performance Metrics, Multi-criteria Decision-making.
Abstract:
Selection of an optimal classifier is an important task in supervised machine learning, and it depends on per-
formance analytics, metric-importance, and domain requirements. This work considers distinct classifiers
as decision alternatives and various performance metrics as decision criteria. The weight for each metric
is computed by applying an Analytic hierarchy process on the proposed scaling parameter. Multi-criteria
decision-making methods consider the performance of classifiers along with metric-weights to generate the
ranking order of alternatives. Some typical experimental observations: Random forest is chosen as an opti-
mal classifier by five MCDM methods for liver disorders dataset; Logistic regression, seems optimal for four
MCDM methods over hepatitis dataset, and to three methods over heart disease dataset; many such observa-
tions discussed in this work may enable developers to choose appropriate classifier for supervised learning
systems.
1 INTRODUCTION
Classification is the process of learning patterns from
historical data to predict the category of the unknown
instances in future. Numerous supervised machine
learning algorithms are available in literature to per-
form the classification task (Kavya et al., 2021). Even
though various performance metrics are available in
literature to evaluate a classifier, the choice of the fi-
nal optimal classifier is dependent on the importance
of the performance metrics. Variation in the impor-
tance of a performance metrics has significant impact
on the optimal classifier. Let us assume that accuracy
of the classifier is more important than any other per-
formance metrics. The predictive model which results
in high accuracy is chosen as the optimal classifier to
predict the category of the testing data. There is no
surety that the chosen classifier is optimal in case high
importance is given to some other performance met-
ric instead of accuracy. Therefore, the choice of the
optimal classifier is dependent on the importance of
the performance metrics whereas importance of the
performance metrics is dependent on the domain re-
quirements and user specifications.
This work focuses on analysing the relation be-
tween the choice of an optimal classifier and the im-
portance of performance metrics. This work con-
siders decision tree, support vector machine, na
¨
ıve
bayes, neural network, liner model, logistic regres-
sion, and random forest as classification algorithms
(Osisanwo et al., 2017), and accuracy, hamming loss,
precision, true positive rate, true negative rate, false
positive rate, false negative rate, F1-score, AUC, and
cross-entropy loss as performance metrics (Naser and
Alavi, 2020).
All the chosen classification algorithms are trained
based on the training data and evaluated over test-
ing data. The results of each performance met-
ric with respect to each classification algorithm is
recorded for further decision-making. In this con-
text, decision-making refers to the process of choos-
ing an optimal classifier based on their performance
results. Instead of providing an optimal classification
algorithm, this work generates the preference order of
classification algorithms based on the Multi-criteria
decision-making (MCDM) methods like Simple Ad-
ditive Weighting (SAW), Multiplicative Exponential
Weighting (MEW), Technique for Order Preference
by Similarity to Ideal Solution (TOPSIS), VIKOR,
and Preference Ranking Organisation Method for En-
riching Evaluation (PROMETHEE) (Guhathakurata
et al., 2021).
MCDM methods consider performance of each
classifier with respect to each metric, and the weight
of each metric to rank the classifiers (Baccour, 2018).
This work introduces a Scaling Parameter, ScaPMI, Φ
to represent the importance of metrics. On the scale of
one to the number of performance metrics considered,
user can assign high Φ value to the metric to which
user want to give high importance. User assigns one
Kavya, R., Christopher, J. and Panda, S.
ScaPMI: Scaling Parameter for Metric Importance.
DOI: 10.5220/0010774600003116
In Proceedings of the 14th International Conference on Agents and Artificial Intelligence (ICAART 2022) - Volume 3, pages 83-90
ISBN: 978-989-758-547-0; ISSN: 2184-433X
Copyright
c
2022 by SCITEPRESS – Science and Technology Publications, Lda. All rights reserved
83

as the Φ value to the metric which is not important
compared to remaining metrics. These user-defined Φ
values are considered for assigning weights to perfor-
mance metrics based on Analytic Hierarchy Process
(AHP) method (Asadabadi et al., 2019). The main
contributions of this work are as follows:
• Preference order of classifiers generated based on
equal weight to all the metrics serves as baseline
knowledge.
• An user-defined scaling parameter (Φ) is intro-
duced to represent the importance of performance
metrics.
• A novel framework is modelled to choose an op-
timal classifier based on the importance of perfor-
mance metrics, and majority ranking by various
MCDM methods.
The rest of the paper is structured as follows: Sec-
tion 2 briefly describes the proposed work, Sec-
tion 3 presents the experimental analysis on medical
datasets, and Section 4 concludes the work with fu-
ture directions.
2 PROPOSED SYSTEM
The framework of the proposed decision support sys-
tem is presented as Figure 1. The three phases,
namely, model training, model testing, and decision-
making are detailed in this section.
2.1 Model Training
Computerised systems which are developed based on
the machine learning algorithms learn patterns in data
for developing predictive models as output. Predic-
tive models apply those patterns to support decision-
makers in unknown decision-making scenarios. The
seven machine learning algorithms learn patterns in
training data for developing the corresponding pre-
dictive models. Each algorithm follows different ap-
proach to learn patterns in data. By the end of the first
phase, the proposed decision support system frame-
work is having seven predictive models which are de-
veloped based on seven different machine learning al-
gorithms.
2.2 Model Testing
Assume the dataset contains two distinct class la-
bels, namely, positive and negative; confusion ma-
trix is formed by considering the original class la-
bels as rows and the predicted class labels as columns.
Among the samples whose original class label is pos-
itive, number of correctly predicted samples are said
to be True Positive (a) and number of incorrectly
predicted samples are said to be False Negative (c).
Among the samples whose original class label is neg-
ative, number of correctly predicted samples are said
to be True Negative (d) and number of incorrectly
classified samples are said to be False Positive (b).
Table 1 presents the summary of the performance
metrics based on confusion matrix. By the end of
phase 2, all the seven predictive models are evaluated
over testing data by considering ten distinct perfor-
mance metrics.
2.3 Decision Making
Most of the existing works in literature choose an
optimal classifier based on the performance metrics
(Peteiro-Barral et al., 2017). Different performance
metrics may suggest different classifiers as optimal.
It may not possible to choose few among the perfor-
mance metrics to select an optimal classifier. Though
the evaluation focus of the metrics differ, there ex-
ist a relation among them. For example, increase in
the true positive accuracy decreases the false posi-
tive rate, decrease in the true positive rate increases
the false positive rate. All these dependencies among
the performance metrics has to be analysed and con-
sidered for selecting an optimal classifier which pro-
vides significant and domain relevant results. It is
not advisable to ignore few metrics because each of
the metric evaluates classifier from different perspec-
tive. Therefore, this work focus on providing a prefer-
ence order of classifiers based on the user-defined im-
portance parameter (Φ) for all evaluation metrics in-
stead of providing a single classifier based on limited
metrics. Multi-criteria decision-making methods like
SEW, MEW, TOPSIS, VIKOR, and PROMETHEE
consider each performance metric as criterion to gen-
erate the preference (or ranking) order of classifiers.
Consider m classifiers and n performance metrics; let
a
i j
be the performance of i
th
classifier with respect to
j
th
metric, and φ( j) be the importance-weight of j
th
metric. SAW performs the weighted sum of a
i j
and
φ( j) to assign score to i
th
classifier.
SAW Score(i) =
n
∑
j=1
a
i j
Φ( j)
MEW performs the exponential sum of a
i j
and φ( j)
to assign score to i
th
classifier.
MEW Score(i) =
n
∏
j=1
a
Φ( j)
i j
ICAART 2022 - 14th International Conference on Agents and Artificial Intelligence
84
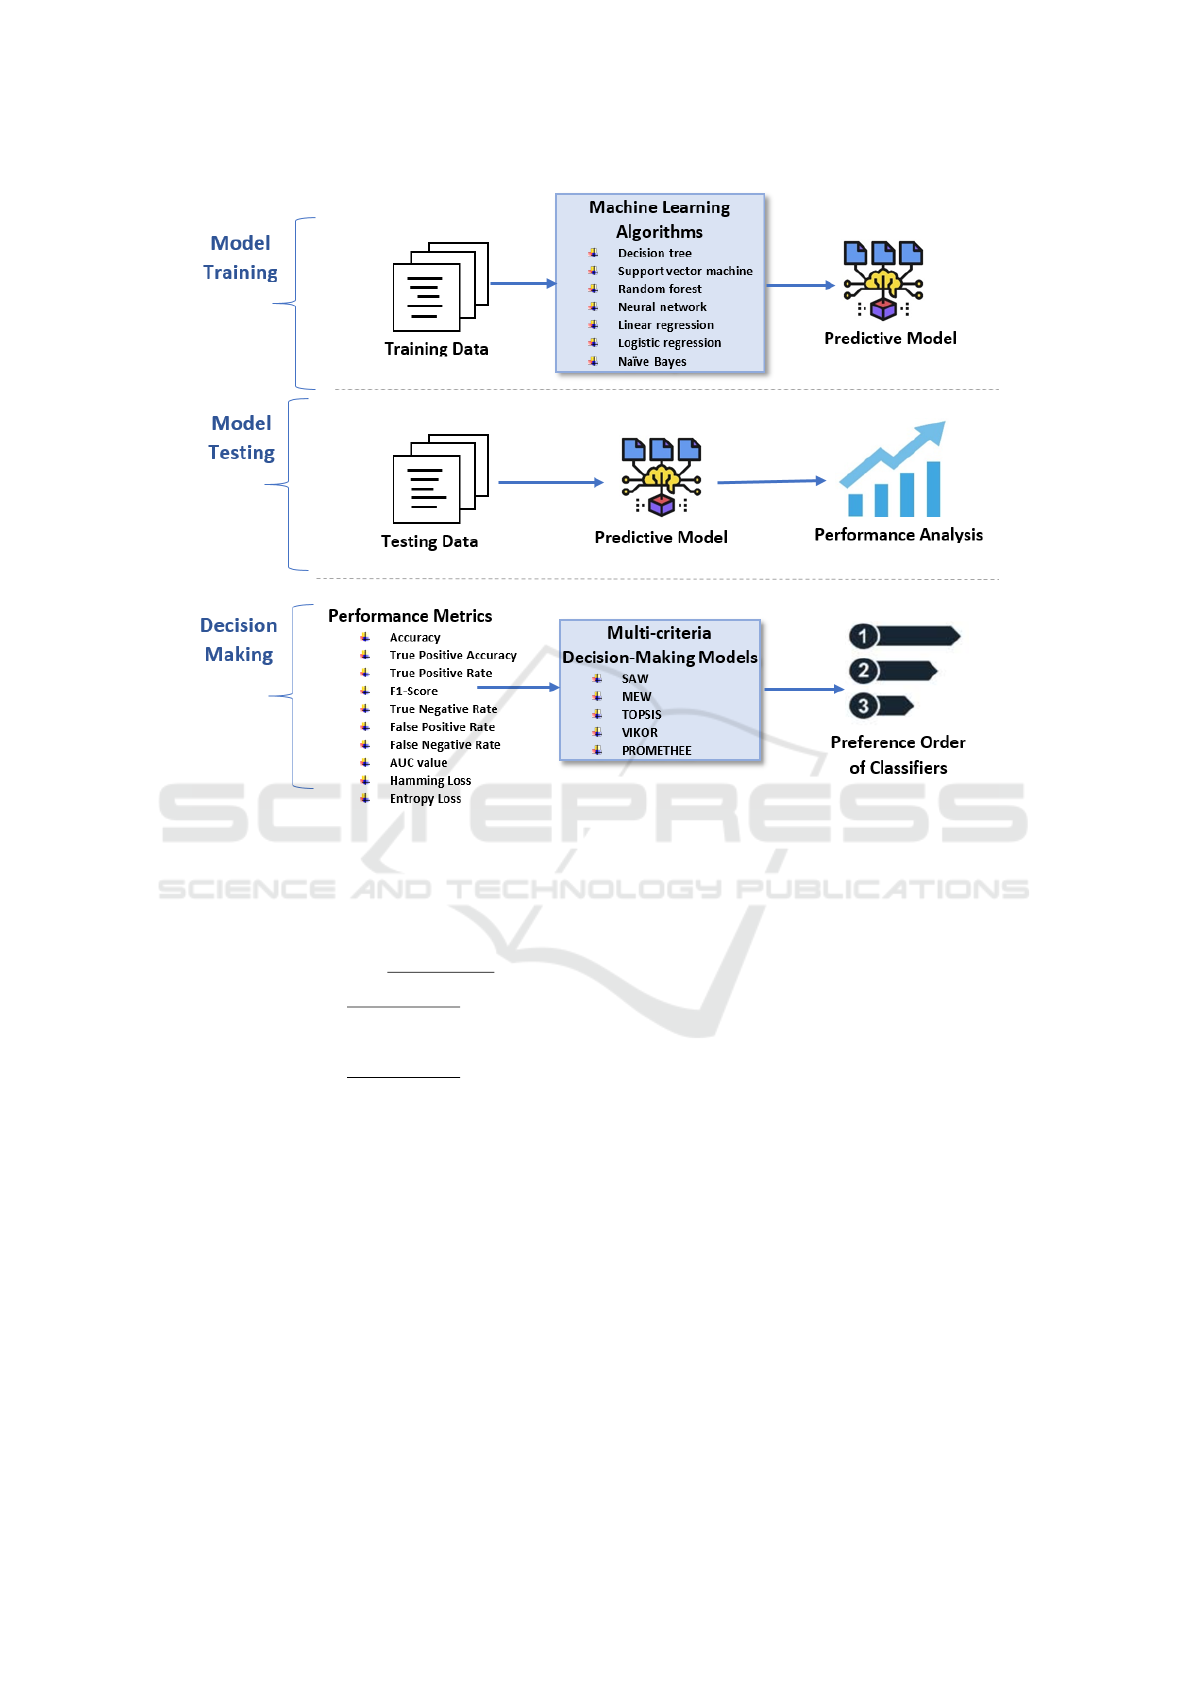
Figure 1: Framework of the proposed decision support system.
TOPSIS assigns score to i
th
classifier based on pos-
itive ideal solution (i
+
) and negative ideal solution
(i
−
).
TOPSIS Score(i) =
(S
i
)
−
(S
i
)
+
+ (S
i
)
−
(S
i
)
+
=
s
n
∑
j=1
(N
i j
− i
+
)
2
(S
i
)
−
=
s
n
∑
j=1
(N
i j
− i
−
)
2
N
i j
= a
i j
Φ( j)
VIKOR follows the same method by TOPSIS to as-
sign score for each classifier. The only difference
is that VIKOR method uses L
p
metric with p = 1
and p = ∞ to compute weighted normalized Manhat-
tan distance (S), weighted normalized Chebyshev dis-
tance (R), and to analyse the relation with S and R as
Q.
PROMETHEE is based on pairwise comparison
among classifiers.
π(i,k) =
n
∑
j=1
P
j
(i,k)Φ( j)
where i and k are distinct classifiers. In-depth de-
tail about PROMETHEE can be found in (Brans and
De Smet, 2016).
Φ( j) has significant impact on the preference or-
der of classifiers generated by MCDM methods. For
example, a classifier can be the optimal in case accu-
racy has given high importance whereas some other
classifier may be the optimal in case high importance
is given to some other metric. Hence, this work focus
on analysing the relation between (Φ) and preference
order of classifiers. For example, in health care do-
main, diagnosing a negative patient as positive is not
as harmful as diagnosing a positive patient as nega-
tive. Therefore, high importance has to be given to
the metrics which focus on positive class compared to
negative class. Since this work considers more than
one MCDM method, majority voting method is opted
to choose an optimal classifier.
3 EXPERIMENTAL ANALYSIS
This section focus on performing a series of exper-
iments on UCI medical datasets, namely, diabetes,
liver, heart, hepatitis, and breast to verify the effec-
ScaPMI: Scaling Parameter for Metric Importance
85

Table 1: Summary of the performance metrics.
Performance Description Evaluation Focus
Precision It is also known as True Positive
Accuracy(TPA). TPA= a/(a + b)
It focuses on correctly predicted positive
samples among all the predicted positive
samples.
Recall/Sensitivity It is also known as True Positive
Rate(TPR). TPR= a/(a + c)
It focuses on the coverage of correctly pre-
dicted positive samples among all the actual
positive samples.
F1-score F1-Score =
(2 × T PA × T PR)
(T PA + T PR)
It focuses on the relation between the actual
positive labels and the predicted positive la-
bels.
Inverse Precision It is also known as True Negative
Accuracy (TNA). TNA= d/(d +
c)
It focuses on the correctly predicted nega-
tive samples among all the predicted negative
samples.
Specificity It is also known as inverse re-
call or True Negative Rate(TNR).
TNR= d/(d + b)
It focuses on the correctly predicted negative
samples among all the actual negative sam-
ples.
False Positive Rate FPR= b/(a + b) It focuses on negative samples which are pre-
dicted as positive.
False Negative Rate FNR= c/(a + b) It focuses on positive samples which are pre-
dicted as negative.
Area under ROC
Curve
- This value represents how good the classifi-
cation algorithm can distinguish between the
positive and negative classes. Higher the
value, higher class separability of the model
Accuracy Accuracy= (a + d)/(a + b + c +
d)
It focuses on the correctly predicted samples
among all the test samples irrespective of pos-
itive and negative classes.
Hamming Loss HL = 1−accuracy It focuses on the incorrectly predicted sam-
ples among all the test samples irrespective
of positive and negative classes.
Cross-Entropy Loss - It focuses on the divergence between pre-
dicted probability and the actual class label.
tiveness of the proposed method in choosing an op-
timal classifier. The detailed overview of the listed
datasets can be found in (Christopher, 2019). 80%
of the dataset is considered for training the classi-
fiers to develop the predictive models and the remain-
ing 20% of the samples are considered for evaluat-
ing the developed predictive models. This section
initially presents the performance results of predic-
tive models and then, the ranking order of classi-
fiers based on the MCDM methods is explained. The
complete executable files with other specifications
are available in https://github.com/pimpo9/Prefrence-
Order-of-Classifiers-based-on-MCDM-method.
All the seven classifiers develop predictive models
based on the training datasets and their performance
on the corresponding testing datasets are measured
using ten distinct metrics. Table 2 presents the perfor-
mance results of seven distinct classifiers on the test-
ing samples from five different datasets respectively.
If accuracy is considered as an importance metric to
choose a classifier, then logistic regression achieved
82%, 70%, 80%, 86%, and 95% accuracy rate for di-
abetes, liver, heart, hepatitis, and breast datasets re-
spectively. All the remaining classifiers achieved ei-
ther slightly high or low accuracy rates. If the impor-
tance is changed from accuracy to some other metric,
there can be a classifier other than logistic regression
which can provide better predictions.
Figure 2 to 6 presents the ROC curves for each
classifier with respect to each dataset. ROC curve of
the classifier which is more towards the left is bet-
ter compared to the remaining curves. However, it is
quite complex to analyse the results of various perfor-
mance metrics to choose an optimal classifier. Even
after analysing the results of all the metrics, an op-
timal classifier is provided to a user by considering
limited metrics.
In case, if the user comes with different argument
where importance must be given to some other then
user has to redo the entire procedure from analysing
ICAART 2022 - 14th International Conference on Agents and Artificial Intelligence
86
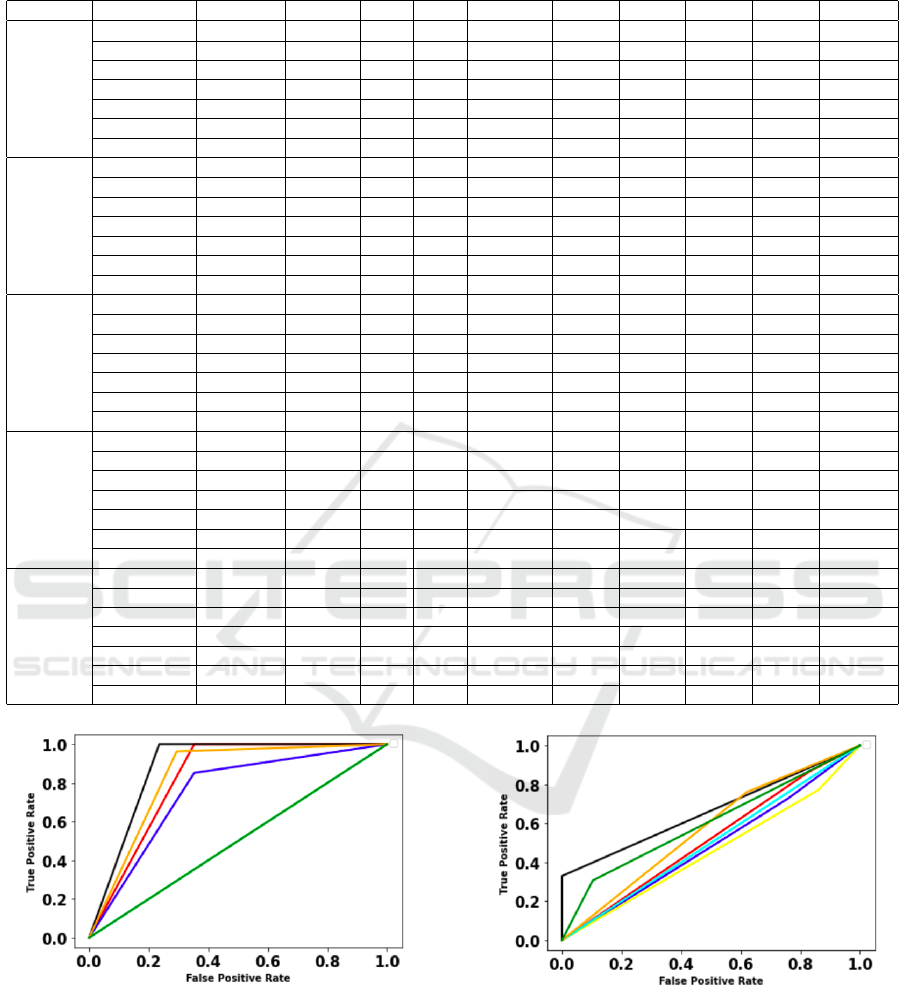
Table 2: Performance of classifiers on test samples of UCI datasets.
Datasets Classifiers Accuracy HL TPA TPR F1-Score TNR FPR FNR AUC Log loss
Diabetes
DT 0.7 0.2987 0.71 0.7 0.7 0.7572 0.2427 0.4117 0.6727 10.3169
SVM 0.48 0.5194 0.46 0.48 0.47 0.6407 0.3592 08431 0.7265 17.9424
RF 0.77 0.2272 0.77 0.33 0.76 0.8834 0.1165 0.4509 0.8229 7.8497
NN 0.7 0.2987 0.68 0.7 0.65 0.9392 0.0679 0.7647 0.6957 10.3168
LINEAR 0.33 0.6688 0.44 0.33 0.18 0.0097 0.9909 0.0196 0.4950 23.1011
LOGISTIC 0.82 0.1818 0.82 0.82 0.81 0.9320 0.0679 0.4117 0.8644 6.2798
NB 0.82 0.9029 0.82 0.82 0.82 0.9029 0.0970 0.3333 0.8850 6.0555
Liver
DT 0.61 0.3931 0.62 0.61 0.61 0.2413 0.7586 0.2727 0.4843 13.5794
SVM 0.62 0.3846 0.59 0.62 0.6 0.1379 0.8620 0.2272 0.5877 13.2843
RF 0.68 0.3162 0.72 0.68 0.7 0.5517 0.4827 0.25 0.6992 10.9226
NN 0.75 0.2478 0.57 0.75 0.65 0 1 0 0.5454 8.5610
LINEAR 0.32 0.6752 0.82 0.32 0.66 1 0 0.8977 0.5511 23.3210
LOGISTIC 0.7 0.2991 0.65 0.7 0.67 0.1724 0.8275 0.1363 0.7612 10.3322
NB 0.5 0.5042 0.83 0.5 0.5 1 0 0.6704 0.6841 17.4169
Heart
DT 0.74 0.26222 0.76 0.74 0.74 0.6470 0.3529 0.1481 0.7494 9.0595
SVM 0.44 0.5573 0.2 0.44 0.27 0 1 0 0.5664 19.2515
RF 0.8 0.1967 0.83 0.8 0.8 0.7058 0.2941 0.0740 0.8834 7.9270
NN 0.56 0.4421 0.31 0.56 0.4 1 0 1 0.3562 15.2876
LINEAR 0.69 0.3114 0.71 0.69 0.69 0.6176 0.3825 0.2222 0.6977 10.7581
LOGISTIC 0.8 0.1967 0.86 0.8 0.8 0.6470 0.3529 0 0.9498 6.7946
NB 0.87 0.1311 0.9 0.87 0.87 0.7670 0.2352 0 0.9346 4.5297
Hepatitis
DT 0.79 0.2068 0.87 0.79 0.82 0.8 0.2 0.25 0.775 7.1460
SVM 0.86 0.1379 0.74 0.86 0.8 1 0 1 0.63 4.7639
RF 0.86 0.1379 0.86 0.86 0.86 0.92 0.08 0.5 0.87 4.7639
NN 0.76 0.2413 0.73 0.76 0.74 0.88 0.12 1 0.44 4.7639
LINEAR 0.72 0.2758 0.81 0.72 0.76 0.76 0.24 0.5 0.63 4.7639
LOGISTIC 0.86 0.1379 0.89 0.86 0.87 0.88 0.12 0.25 0.86 4.7640
NB 0.83 0.1724 0.88 0.83 0.85 0.1724 0.16 0.25 0.95 5.9550
Breast
DT 0.95 0.0526 0.95 0.95 0.95 0.9 0.05 0.054 0.9479 4.7639
SVM 0.44 0.5614 0.42 0.44 0.43 0.15 0.85 0.4054 0.7557 4.7639
RF 0.98 0.0175 0.98 0.98 0.98 1 0 0.027 0.9983 4.7639
NN 0.35 0.6491 0.12 0.35 0.18 1 0 1 0.9665 4.7639
LINEAR 0.94 0.0614 0.94 0.94 0.94 0.875 0.125 0.27 0.9239 2.1208
LOGISTIC 0.95 0.0526 0.95 0.95 0.95 0.925 0.075 0.054 0.9912 4.7639
NB 0.94 0.0614 0.94 0.94 0.94 0.875 0.125 0.027 0.9888 4.7939
Figure 2: ROC for diabetes dataset.
the metrics to finalising an optimal classifier. There-
fore, this work incorporates MCDM methods to rank
the classifiers based on the user preferences.
Figure 3: ROC for liver disorders dataset.
3.1 Analysis on the Preference Order of
Classifiers
The importance of the metric plays a pivotal role in
generating the preference order of classifiers. Though
is not advisable, this work initially assigns equal
weight to all the metrics to verify the preference or-
ScaPMI: Scaling Parameter for Metric Importance
87
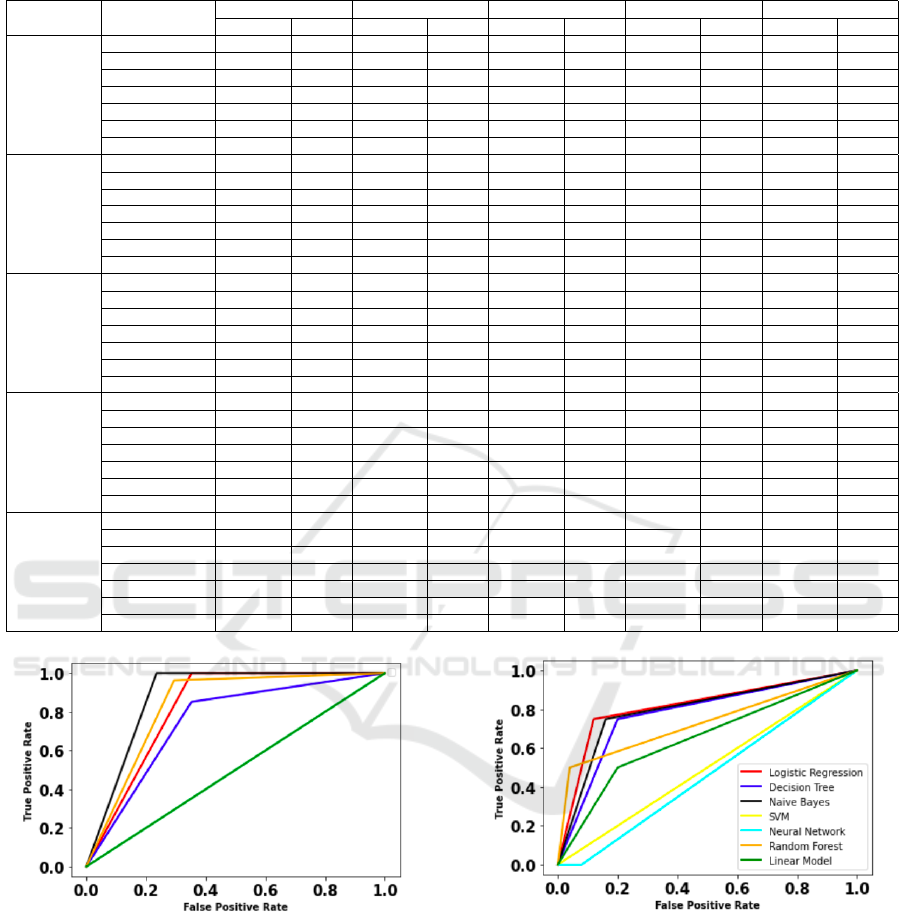
Table 3: Preference order of classifiers based on equal weight.
DATASET CLASSIFIERS
SAW MEW TOPSIS VIKOR PROMETHEE
VALUES RANK VALUES RANK VALUES RANK VALUES RANK VALUES RANK
DIABETES
DT 0.5377 5 0.5983 3 0.7068 4 0.2017 3 -0.1666 5
SVM 0.4877 6 0.6314 1 0.4109 6 0.8404 6 -0.5999 6
RF 0.6103 3 0.5703 4 0.8197 2 0.0964 2 0.2333 3
NN 0.5707 4 0.5674 5 0.6616 5 0.5549 5 -0.0166 4
LINEAR 0.2675 7 0.26804 7 0.2655 7 1.0 7 -0.7666 7
LOGISTIC 0.6421 2 0.5306 6 0.8629 1 0.0 1 0.7333 1
NB 0.7380 1 0.6299 2 0.7284 3 0.5545 4 0.5833 2
LIVER
DT 0.4074 6 0.5956 2 0.4671 6 0.9290 6 -0.3333 7
SVM 0.4346 4 0.5667 3 0.4869 5 0.8209 5 -0.2333 5
RF 0.5884 2 0.6404 1 0.7369 1 0.0 1 0.4333 1
NN 0.4034 7 0.0 NA 0.5568 3 0.7311 3 0.1333 3
LINEAR 0.6072 1 0.0 NA 0.4489 7 1.0 7 -0.2666 6
LOGISTIC 0.5186 4 0.5528 4 0.6249 2 0.4667 2 0.3666 2
NB 0.5713 3 0.0 NA 0.5549 4 0.7605 4 -0.0999 4
HEART
DT 0.5404 4 0.5607 2 0.7125 4 0.2200 4 -0.0666 4
SVM 0.439 7 0.0 NA 0.2677 7 1.0 7 -0.7999 7
RF 0.5804 3 0.5215 3 0.8178 2 0.1123 2 0.3666 3
NN 0.439 6 0.0 NA 0.3979 6 0.8701 6 -0.4000 5
LINEAR 0.5234 5 0.439 1 0.630 5 0.3183 5 -0.4333 6
LOGISTIC 0.5808 2 0.0 NA 0.8173 3 0.1392 3 0.4666 2
NB 0.5974 1 0.0 NA 0.9004 1 0.0 1 0.8666 1
HEPATITIS
DT 0.5647 4 0.77602 2 0.4985 5 0.8134 5 -0.2333 5
SVM 0.4896 5 0.0 7 0.6116 4 0.6571 4 0.2166 3
RF 0.5912 2 0.7328 5 0.813 1 0.0199 1 0.5 1
NN 0.3321 7 0.7605 4 0.3475 7 0.9895 6 -0.4999 6
LINEAR 0.3359 6 0.7891 1 0.3488 6 1.0 7 -0.6166 7
LOGISTIC 0.5823 3 0.7113 6 0.7969 2 0.1249 2 0.5 2
NB 0.6105 1 0.7615 3 0.6781 3 0.3765 3 0.1333 4
BREAST
DT 0.6708 4 0.4277 5 0.7319 4 0.5394 4 0.2833 3
SVM 0.419 7 0.5222 1 0.2307 7 1.0 7 -0.7166 7
RF 0.7000 1 0.0 NA 0.7500 2 0.5 2 0.8333 1
NN 0.4869 6 0.0 NA 0.3852 6 0.9197 6 -0.4499 6
LINEAR 0.578 5 0.508 2 0.8580 1 0.0098 1 -0.1833 5
LOGISTIC 0.6886 2 0.444 3 0.7375 3 0.5312 3 0.3166 2
NB 0.6806 3 0.4405 4 0.7305 5 0.5428 5 -0.0833 4
Figure 4: ROC for C-heart disease dataset.
der of classifiers. Table 3 presents the ranking or-
der of classifiers based on equal weighting. It can
be observed from Table 3 that TOPSIS and VIKOR
has assigned the first rank to same classifier for all
the five datasets. PROMETHEE has assigned first
rank to same classifier as TOPSIS and VIKOR for all
datasets other than breast. The ranking order of clas-
sifiers based on the remaining two MCDM methods
are quite varied compared to TOPSIS and VIKOR. In
most of the cases, decision-makers may not be clear
in deciding the importance of the metrics. In such
Figure 5: ROC for hepatitis dataset.
scenarios, the ranking order based on equal weights
to all the performance metrics will serve as a baseline
knowledge to the decision-maker to assign weights to
metrics. Table 5 presents the importance value of per-
formance metrics from healthcare perspective.
In Table 5, the metrics which focus on predicting
positive class have to be given high importance com-
pared to the metrics which focus on predicting the
negative class. Both precision and recall focus more
on predicting the positive class samples correctly and
therefore a high importance value, 9 and 10, is as-
ICAART 2022 - 14th International Conference on Agents and Artificial Intelligence
88
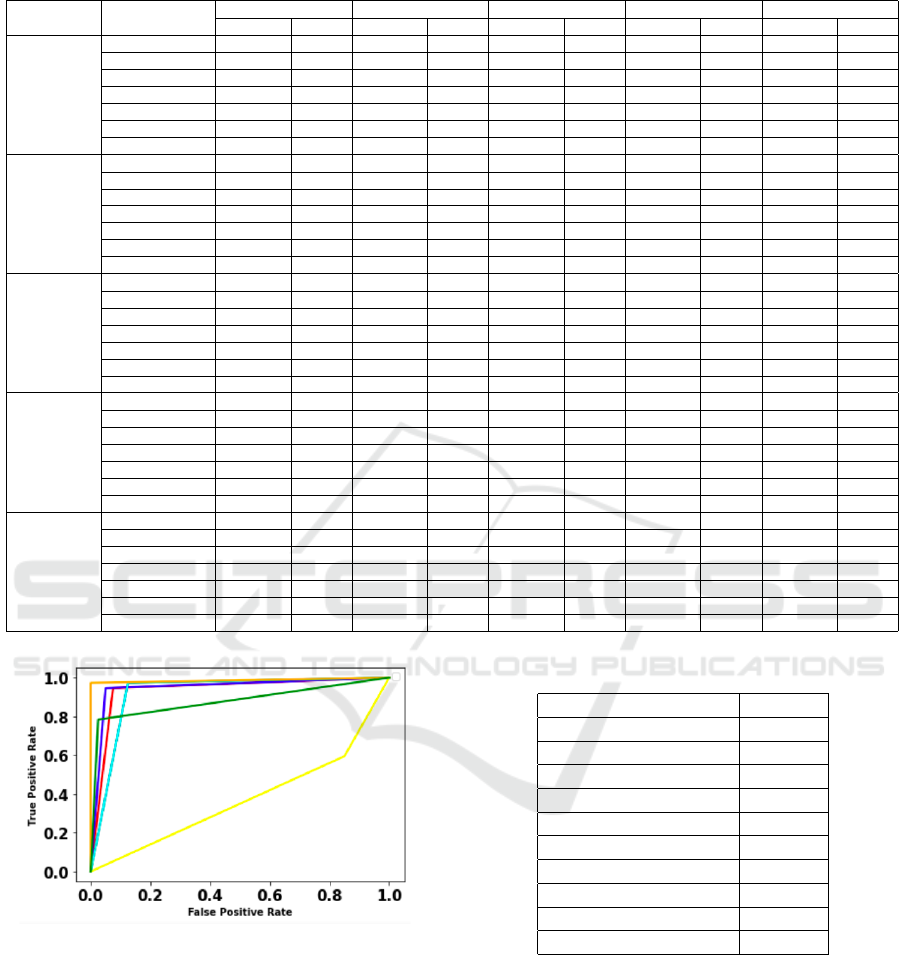
Table 4: Preference order of classifiers based on metric-importance.
DATASET CLASSIFIERS
SAW MEW TOPSIS VIKOR PROMETHEE
VALUES RANK VALUES RANK VALUES RANK VALUES RANK VALUES RANK
DIABETES
DT 0.61712 5 0.6995 4 0.7015 4 0.2596 4 -0.1424 4
SVM 0.4159 6 0.6258 6 0.3539 6 0.7608 6 -0.5757 6
RF 0.74149 3 0.7260 2 0.8504 2 0.0655 2 0.2848 3
NN 0.63497 4 0.6971 5 0.6623 5 0.2658 5 -0.1515 5
LINEAR 0.11594 7 0.2979 7 0.1863 7 1.0 7 -0.8242 7
LOGISTIC 0.80770 2 0.7234 3 0.9077 1 0.0 1 0.7515 1
NB 0.8998 1 0.83692 1 0.7814 3 0.2366 3 0.6575 2
LIVER
DT 0.4076 7 0.6650 3 0.4619 6 0.7193 5 -0.3878 7
SVM 0.4417 6 0.6501 4 0.4908 5 0.7552 6 -0.2424 5
RF 0.69604 1 0.7509 1 0.7736 1 0.0 1 0.4909 1
NN 0.47256 5 0.0 NA 0.5709 3 0.7552 6 0.1333 3
LINEAR 0.5496 4 0.0 NA 0.4473 7 1.0 7 -0.2818 6
LOGISTIC 0.6053 2 0.6701 2 0.6761 2 0.3065 2 0.4242 2
NB 0.57806 3 0.0 NA 0.5315 4 0.6476 3 -0.1363 4
HEART
DT 0.6245 4 0.66287 1 0.7293 4 0.2686 4 -0.0393 4
SVM 0.19052 7 0.0 NA 0.2032 7 1.0 7 -0.8363 7
RF 0.7051 3 0.6552 3 0.8590 3 0.1199 3 0.3969 3
NN 0.3454 6 0.0 NA 0.2602 6 0.7879 6 -0.5818 6
LINEAR 0.5732 5 0.6614 2 0.6373 5 0.3833 5 -0.3878 5
LOGISTIC 0.7185 2 0.0 NA 0.8688 2 0.1066 2 0.5454 2
NB 0.7742 1 0.0 NA 0.9572 1 0.0 1 0.9030 1
HEPATITIS
DT 0.5647 4 0.8116 3 0.6104 4 0.4268 4 -0.1030 5
SVM 0.5429 5 0.0 7 0.5557 5 0.6155 5 0.0727 4
RF 0.73816 2 0.8321 1 0.8656 2 0.0428 2 0.4939 2
NN 0.2694 7 0.7853 6 0.1927 7 0.9411 6 -0.7272 7
LINEAR 0.30312 6 0.8091 4 0.2726 6 0.9680 7 -0.6909 6
LOGISTIC 0.7502 1 0.8056 5 0.8966 1 0.0 1 0.6636 1
NB 0.7065 3 0.8297 2 0.8091 3 0.1161 3 0.2909 3
BREAST
DT 0.7545 4 0.5645 3 0.9047 4 0.0660 4 0.3424 3
SVM 0.3052 7 0.4920 6 0.2420 7 0.9206 6 -0.7303 7
RF 0.8000 1 0.0 NA 0.9514 1 0.0 1 0.9515 1
NN 0.34697 6 0.0 NA 0.9234 6 0.9997 7 -0.6909 6
LINEAR 0.7312 5 0.6465 1 0.8712 5 0.1225 5 -0.2515 5
LOGISTIC 0.7767 2 0.5753 2 0.9345 2 0.0280 2 0.4393 2
NB 0.7653 3 0.5597 4 0.9234 3 0.0371 3 -0.0606 4
Figure 6: ROC for W-breast cancer dataset.
signed to them respectively. If the model is having
high precision and low recall, then it is classifying
many test instances as positive but it is not classifying
most of the positive test instances as positive. If the
model is having high recall and low precision, then it
is correctly predicting the test instances of the positive
classes but it is also predicting most of the negative
classes as positive. In medical domain, sometimes di-
agnosis of a negative sample as positive is not harm-
ful. Therefore, the model with high recall is desirable
compared to high precision value. Based on this ar-
Table 5: Importance of the performance metrics.
Performance metrics Φ value
TPR 10
TPA 9
F1-SCORE 8
AUC 7
ACCURACY 6
HAMMING LOSS 5
FNR 4
TNR 3
FPR 2
LOG LOSS 1
gument, high importance value is given to recall com-
pared to precision. Since F1-Score is the harmonic
mean of precision and recall, this work assigns next
importance to F1-Score.
ROC plots are one of the best ways of presenting
how the classifier is separating positive and negative
classes. Moreover, ROC plots are generated based on
true positive rate which is an important metric in med-
ical diagnosis. The classifier with high AUC value
is preferred compared to remaining. Therefore, this
work assigns next importance to AUC. Though ac-
ScaPMI: Scaling Parameter for Metric Importance
89

curacy is a highly preferred metric in binary classifi-
cation, it is subjected to be biased if there is a class-
imbalance. Therefore it is given less importance com-
pared to the metrics where true positive rate is in-
volved. The least importance is given to the metrics
which focus on negative class because they are not
so important in medical diagnosis. Table 4 presents
the ranking order of classifiers based on the impor-
tance weights in Table 5. It can be observed from Ta-
ble 4 that TOPSIS, VIKOR, and PROMETHEE has
assigned first rank to same classifier for all the five
datasets after assigning importance to metrics. The
ranks assigned by SAW is almost similar to TOP-
SIS, VIKOR, and PROMETHEE whereas the ranks
assigned by MEW are quite dissimilar. In between
Table 3 and 4, the consistent ranking can be observed
for the top performed classifiers by all the MCDM
methods in case of Table 4. By this, we can iden-
tify the fact that correctly weighting the criteria to a
particular problem will result in a similar ranking by
most of the MCDM method. In Table 4, for diabetes
dataset, logistic regression, random forest and na
¨
ıve
bayes are the top ranked classifiers by various MCDM
methods, whereas random forest is followed by logis-
tic regression for both liver and breast datasets. Na
¨
ıve
bayes is followed by logistic regression, and random
forest is followed by logistic regression for heart and
hepatitis datasets respectively.
It can observed from Table 4 that, SVM, lin-
ear model, neural network, and decision tree has not
given preference compared to random forest, logis-
tic regression and na
¨
ıve bayes. By considered the
majority voting, this work concludes the classifier
which is ranked as one by TOPSIS, VIKOR, and
PROMETHEE can be chosen as optimal for corre-
sponding datasets. Therefore, random forest classifier
is chosen as the optimal for liver and breast datasets,
logistic regression for diabetes and hepatitis dataset,
and finally na
¨
ıve bayes classifier for heart dataset.
4 CONCLUSION
This work focuses on providing a preference or-
der of classifiers based on the importance of perfor-
mance metrics which is recorded as ScaPMI value.
A brief overview on various performance metrics and
their evaluation focus is provided so that the task of
assigning ScaPMI value to metrics becomes easier.
Moreover, the preference order of classifiers gener-
ated based on equal ScaPMI value to all the metrics
aid decision-maker in attaining baseline knowledge.
Decision-makers can generate the desired preference
order of classifiers by varying the ScaPMI value of
metrics with the knowledge attained from the prefer-
ence order by equal ScaPMI values. Since, all the
datasets in this work are from medical domain, high
ScaPMI value is given to recall and less ScaPMI value
is given to cross-entropy loss. The classifier to which
most of the MCDM methods has assigned the first
rank is considered as an optimal classifier for corre-
sponding dataset.
As a further extension, this work intends to in-
corporate statistical methods to verify the significance
of the difference among the ranking orders generated
by various MCDM methods. Moreover, an enhanced
study of the performance metrics and the evaluation
focus supports in modeling better criteria and their
weights to rank the classifiers precisely. A series of
experiments on non-medical datasets with multiple
weighting strategies helps in verifying the rationality
and the effectiveness of the ranking methods.
REFERENCES
Asadabadi, M. R., Chang, E., and Saberi, M. (2019). Are
mcdm methods useful? a critical review of analytic
hierarchy process (ahp) and analytic network process
(anp). Cogent Engineering, 6(1):1623153.
Baccour, L. (2018). Amended fused topsis-vikor for classi-
fication (atovic) applied to some uci data sets. Expert
Systems with Applications, 99:115–125.
Brans, J.-P. and De Smet, Y. (2016). Promethee methods.
In Multiple criteria decision analysis, pages 187–219.
Springer.
Christopher, J. (2019). The science of rule-based classifiers.
In 2019 9th International Conference on Cloud Com-
puting, Data Science & Engineering (Confluence),
pages 299–303. IEEE.
Guhathakurata, S., Saha, S., Kundu, S., Chakraborty, A.,
and Banerjee, J. S. (2021). South asian countries are
less fatal concerning covid-19: a fact-finding proce-
dure integrating machine learning & multiple criteria
decision-making (mcdm) technique. Journal of The
Institution of Engineers (India): Series B, pages 1–15.
Kavya, R., Christopher, J., Panda, S., and Lazarus, Y. B.
(2021). Machine learning and xai approaches for al-
lergy diagnosis. Biomedical Signal Processing and
Control, 69:102681.
Naser, M. and Alavi, A. (2020). Insights into performance
fitness and error metrics for machine learning. arXiv
preprint arXiv:2006.00887.
Osisanwo, F., Akinsola, J., Awodele, O., Hinmikaiye, J.,
Olakanmi, O., and Akinjobi, J. (2017). Supervised
machine learning algorithms: classification and com-
parison. International Journal of Computer Trends
and Technology (IJCTT), 48(3):128–138.
Peteiro-Barral, D., Remeseiro, B., M
´
endez, R., and Penedo,
M. G. (2017). Evaluation of an automatic dry eye test
using mcdm methods and rank correlation. Medical &
biological engineering & computing, 55(4):527–536.
ICAART 2022 - 14th International Conference on Agents and Artificial Intelligence
90
