
An Interactive Environment to Support Agent-based Graph
Programming
Daniel Blashaw
a
and Munehiro Fukuda
b
Division of Computing and Software Systems, University of Washington Bothell, U.S.A.
Keywords:
ABM, Visualization, Big Graphs, Parallel Computing.
Abstract:
We apply agent-based modeling (ABM) to distributed graph analysis where a large number of reactive agents
roam over a distributed graph to find its structural attributes, (e.g., significant subgraphs including triangles in
a social network and network motifs in a biological network). Of importance is providing data scientists with
an interactive environment to support agent-based graph programming, which enables interactive verification
of agent behaviors, trial-and-error operations, and visualization of graphs and agent activities. This paper
presents and evaluates our implementation techniques of these interactive features.
1 INTRODUCTION
In contrast to conventional data streaming, we ap-
ply agent-based modeling (ABM) to big-data com-
puting (Fukuda et al., 2020). More specifically, in-
stead of streaming data to analyzers such as Spark
1
,
we construct a distributed data structure, dispatch re-
active agents to it as mobile analyzers, and find its
structural attribute in their emergent collective group
behavior. For instance, triangles in a given social net-
work is considered as a useful factor to measure the
intimacy among the network users and can be counted
by walking agents three times over the network.
Distributed data structures have been facilitated
for years in well-known parallel and distributed sys-
tems. GlobalArray constructs multi-dimensional ar-
rays on top of MPI (Nieplocha et al., 2006). Pregel
is a large-scale graph library based on inter-vertex
message passing (Malewicz et al., 2010) and is used
in Spark’s data streaming as GraphX. RepastHPC is
the parallel version of Repast Simphony
2
that distin-
guishes spatial and network projections.
Focusing on graph analysis, these systems how-
ever have substantial difficulties in implementing
our agent-based approach: GlobalArray could repre-
sent a graph with an adjacency matrix but does not
support element-to-element communication, thus ob-
structing agent communication nor movement; Pregel
a
https://orcid.org/0000-0002-0822-6667
b
https://orcid.org/0000-0001-7285-2569
1
http://spark.apache.org/
2
https://repast.github.io/
and GraphX nail computation in their vertices, im-
mobilizing agents over a graph; and RepastHPC is
meant for traditional ABM simulation, not consider-
ing parallel file I/Os nor interactive operations on its
network projections. Given this background, we fa-
cilitated distributed graph construction, agents’ graph
traversal and visualization in the MASS (multi-agent
spatial simulation) library (Gilroy et al., 2020).
Of importance is providing data scientists with an
interactive environment to support agent-based graph
programming, which includes interactive verification
of agent behaviors, capability of trial-and-error opera-
tions, and visualization of graphs and agent activities.
This paper presents and evaluates our implementation
techniques of these interactive features.
The rest of this paper is organized as follows:
Section 2 differentiates our interactive environment
from the related work in graph programming; Sec-
tion 3 gives technical details on the MASS interac-
tive features and their implementation; Section 4 eval-
uates MASS execution overheads, programmability
improvements, and visualization; and Section 5 con-
cludes our discussions as mentioning our future plans.
2 RELATED WORK
This section compares related systems from the fol-
lowing four viewpoints: (1) potential of distributed
graph analysis with agents, (2) agent tracking over
a distributed graph, (3) forward and backward graph
analysis, and (4) visualization of graphs and agents.
148
Blashaw, D. and Fukuda, M.
An Interactive Environment to Support Agent-based Graph Programming.
DOI: 10.5220/0010776400003116
In Proceedings of the 14th International Conference on Agents and Artificial Intelligence (ICAART 2022) - Volume 1, pages 148-155
ISBN: 978-989-758-547-0; ISSN: 2184-433X
Copyright
c
2022 by SCITEPRESS – Science and Technology Publications, Lda. All rights reserved

2.1 Distributed Graph Analysis with
Agents
NetLogo
3
and Repast Simphony are capable of sim-
ulating networked agents or agent movements over
a network, respectively using network extensions or
network projections. However, the biggest challenge
results from their single-computing execution that
limits graph scalability. In fact, our scalability test
shows that Repast Simphony suffers from counting
the number of triangles in a graph only with 3,000
vertices (Wenger et al., 2021).
RepastHPC and FLAME
4
are MPI-supported par-
allel ABM simulators. Since their paramount goal is
parallel performance in native execution, their MPI-
based C/C++ implementation does not consider in-
teractive operations that are essential to the speed or
the serving layer in big-data computing. Furthermore,
they cannot initialize a graph in parallel as rank 0 must
read an input file sequentially.
WAVE (Sapaty and Borst, 1996) and UCI Mes-
sengers (Bic et al., 1996) are mobile-agent execution
platforms, both allowing their agents to construct and
to roam over a distributed graph at run-time. Their
drawback is the necessity of describing graph con-
struction logics in their agent code, which in turn
means that they are incapable of automating graph
construction from an input file and are thus unsuited
to big-data computing.
2.2 Agent Tracking
ProvMASS (Davis et al., 2018) provides MASS users
with a novel approach for tracking data provenance in
a distributed setting. This data provenance includes
agent data, simulation space, and cluster node infor-
mation, and is captured to file at run-time. Although
these data provenance features contribute to analyz-
ing agent behavior, they have a significant impact on
simulation performance.
Repast Simphony, on the other hand, has a
lightweight implementation for tracking agent data,
but settings must be pre-configured before running
the simulation and recorded agent data can only be
written to console or file. This is useful for review-
ing agent information but does not facilitate interac-
tive uses nor operations on the agent data in a running
simulation.
IBM Aglets (Lange and Oshima, 1998) allows
users to communicate with the agent servers named
Tahiti. Through Tahiti’s GUI, users can create, clone,
3
https://ccl.northwestern.edu/netlogo/
4
http://www.flame.ac.uk/
inspect, dialogue with, retract, and destroy agents.
However, since Aglets are intended to work on In-
ternet tasks, they do not distinguish distributed data
structures nor duplicate too many instances through
the GUI menus.
2.3 Forward and Backward Graph
Analysis
We anticipate that data scientists may want to conduct
various analyses on the same graph, (e.g., centrality
and clustering analyses on the same biological net-
work). These operations need to retract agents or even
roll back computation, which are then followed by a
new analysis. Some systems indirectly or directly im-
plement such forward and backward computation as
follows:
Optimistic synchronization in parallel simula-
tors (Wang and Zhang, 2017) allows each computing
node to take repetitive snapshots of ongoing computa-
tion for the purpose of rolling back to the computation
and accepting tardy messages from slower computing
nodes. As their checkpointing and rollback operations
are system-initiated features, users cannot use them
intentionally for their trial-and-error analysis.
The UCI Messengers system implements the op-
timistic synchronization in the execution platforms so
that agents can automatically go back to a network
node they previously visited. Needless to say, agent
checkpointing and rollback are carried out automati-
cally and thus not user-controllable.
Looking at single-CPU execution, Repast Sim-
phony requires that all graph and agent information
be set prior to execution of the simulation and does
not support incremental backtracking or manipulation
of a running simulation.
2.4 Graph Visualization
Single-CPU ABM simulators furnish non-computing
users with a plenty of graph analyzing and visualiza-
tion features. NetLogo arranges an IDE-based graph
visualization with its network extension, while forc-
ing users to pre-configure visualizations and lacks the
mid-simulation control features. Repast Simphony is
equipped with JUNG (O’Madadhain et al., 2003) as
its internal graph tool, which in turn means that data
scientists need to embed visualization logics in their
graph programming.
Cytoscape
5
is an open-source network visualiza-
tion tool with the following three graph-programming
supports: (1) extensive file support for importing
5
http://cytoscape.org/
An Interactive Environment to Support Agent-based Graph Programming
149

graphs into Cytoscape, (2) native functionality for dy-
namic manipulation of existing graph structures, and
(3) the use of the OSGi framework to make its com-
ponents modular and easily extensible. Needless to
say, Cytoscape is not concerned with agent activities
on a Cytoscape graph.
We should emphasize that all these graph visual-
ization endeavors are limited to single-CPU execu-
tion, thus unable to address the demand for large-scale
graph analysis.
In summary of this section, agent-based graph
programming needs to address interactive and scal-
ability problems in the following three areas:
1. Agent Tracking: quickly observing a large num-
ber of agents traversing a graph;
2. Forward and Backward Computation: inter-
actively retracting active agents, restoring former
graph states, and dispatching new agents; and
3. Graph Visualization: dynamically modifying
graphs through GUI and visualizing agent activ-
ities on a graph.
3 INTERACTIVE FEATURES AND
THEIR IMPLEMENTATION
In the following, we briefly introduce the MASS li-
brary and thereafter explain our technical solutions
to three interactive graph-programming features: (1)
agent tracking, (2) forward and backward computa-
tion, and (3) graph visualization.
3.1 MASS Library
The MASS library represents ABM using the two
modeling objects: Places and Agents. Places is
a computational space implemented with a multi-
dimensional array, distributed over a cluster sys-
tem. Agents is a collection of reactive agents within
the computation. An agent has navigational auton-
omy of traversing places. The MASS library func-
tions using a master-worker pattern to control the
computation. User applications interact with the
MASS master node that runs their main() function;
starts MASS workers with MASS.init(); invokes a
parallel function call at each place or each agent
with Places.callAll(func) or Agents.callAll(func); ex-
changes data among places in an inter-place RPC
form with Places.exchangeAll(func); clones, kills,
and moves agents within Agents.manageAll(); and ter-
minates the MASS workers with MASS.finish().
To ease graph programming, MASS derives
GraphPlaces from the Places base (Gilroy et al.,
2020). Using this class, users can initialize a dis-
tributed graph with an input file in XML, HIPPIE,
CSV, and text formats. As GraphPlaces can grow by
adding a new Places instance to itself, users can in-
crementally construct the graph with addVertex() and
addEdge(). The MASS library interfaces with Cy-
toscape for GUI-enabled graph construction and vi-
sualization as well as with JShell (Oracle, 2017) for
interactive agent deployment over the graph.
3.2 Agent Tracking
We implemented an agent-tracking feature in MASS,
based on the following three design strategies: (1) en-
abling quick observation of many agent activities, (2)
generating consistent agent propagation history, and
(3) facilitating a straightforward, easy-to-use agent-
tracking API.
To pursue the performance consideration, instead
of allowing each agent to carry its travel history with
it, we added to each place the AgentHistoryMan-
ager class that is responsible for managing which
agents or classes of agents are being tracked and
then recording history each time a tracked agent vis-
its that place. Importantly, this means agent history
is stored on the Places but not on the Agents; this
maintains execution performance by ensuring agents
remain lightweight for serialization and transfer be-
tween computing nodes. The trade-off is that agent
history is distributed amongst the cluster nodes during
execution which introduces some complications when
extracting the data, especially when child agents are
involved.
In many applications, agents will come to deci-
sion points at which their instructions indicate they
need to travel to multiple places at once. In these in-
stances, the parent agent will move to one place, and
then a child agent will be spawned for each of the
other available places. At this point, if agents are be-
ing tracked by their class name, then places will be-
gin gathering data on the newly spawned child agents.
This pattern may continue throughout the computa-
tion, causing multiple waves of child agents to spawn
at various times in the computation. The issue that
arises from this process is that the child agents will
have an incomplete history, because they did not exist
at the beginning of execution.
To help illustrate this problem, consider the Tri-
angle Counting benchmark application running on a
sample graph shown in Figure 1. Triangle Counting
is solved in four ABM simulation cycles: (time 0)
one agent is spawned on each available place; (time
1-2) each agent propagates itself to all neighboring
places with a lessor index value than the current place
ICAART 2022 - 14th International Conference on Agents and Artificial Intelligence
150
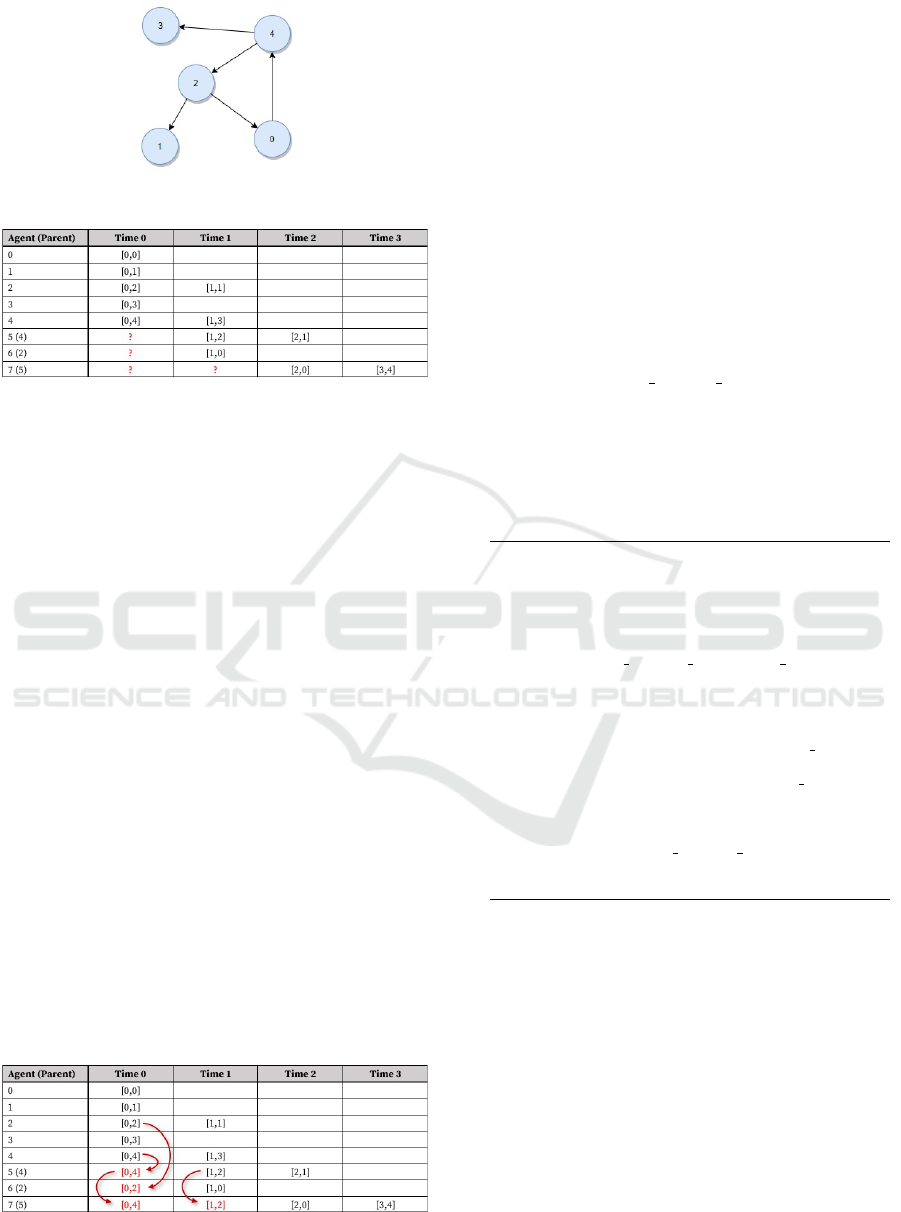
Figure 1: A sample graph.
Figure 2: Agent history before parent propagation, where
[t,v] means: at time t, a given agent visited vertex v.
(which results in spawning children if more than one
neighbors fits this criterion); and (time 3) all remain-
ing agents attempt to return to their original source.
Figure 2 shows the history captured for each agent
as this benchmark application plays out; note that
child agents are missing their parent itinerary before
they were spawned. This missing piece of data is
needed for the user application to correctly determine
the path the agents traveled along, i.e., the edges of the
triangles. In the figure, agent 7 is the only agent that
completed its path at time 3, but its complete path is
unknown because agent 7 is a child and did not spawn
until time 2. Further, agent 7 is agent 5’s child and
agent 5 is also agent 4’s child. So, even if we retrieve
information from agent 5, the data will remain incom-
plete unless we also pull information from agent 4.
Thus, we need to solve this problem depth-first recur-
sively at the time agent 7’s history is extracted.
Figure 3 illustrates the result of propagating data
from parent agents, with the red arrows indicating the
flow of information from parent to child. In the case
of agent 7, we see that it retrieved results directly from
parent agent 5, after agent 5 retrieved its own history
from parent agent 4. Now, from agent 7’s movement
history, we can correctly conclude the triangle found
from this simulation is between vertices 4, 2, and 0.
Figure 3: Agent history after parent propagation.
Listing 1 shows a code snippet to initiate agent
tracking and to collect agent travel history. The
main() program creates a graph (line 5) and initializes
AgentHistoryManager at each graph place (line 6).
Once an agent class is registered for tracking, the user
program may continue execution without worrying
about tracking data. Each time the manageAll() func-
tion is invoked, the MASS library will keep track of
all associated agent movements. Although the code
invokes manageAll() twice for each loop iteration,
one in line 10 for spawning children and the other
in line 12 for moving all the agents to neighboring
places, manageAll() internally counts these two invo-
cations as one logical time event. This gives users a
simple view of agent dissemination. Finally, main()
can retrieve all the agent travel histories through
graph.callAll(AGENT TRACE GET) (line 14). This
retrieval process internally consolidates all collected
results into a single, cleaned, and sorted AgentHisto-
ryCollection object. It is at this step that parent-data
propagation occurs.
Listing 1: Using MASS agent tracking.
1 import MASS.∗;
2 public class Analysis {
3 public void main(String[] args) {
4 MASS.init();
5 GraphPlaces graph = new GraphPlaces( ... );
6 graph.callAll(places.
AGENT TRACE REGISTER CLASS,
Crawler.class.getName());
7 Agents crawlers = new Agents(‘‘Crawler’’, graph
);
8 while ( crawlers.hasAgents() ) {
9 crawlers.callAll(ClawlerAgent.spawn );
10 crawlers.manageAll();
11 crawlers.callAll(ClawlerAgent.walk );
12 crawlers.manageAll();
13 }
14 AgentHistoryCollection history = graph.callAll(
places.AGENT TRACE GET);
15 MASS.finish();
16 } }
3.3 Forward and Backward
Computation
We have leveraged the MASS library’s interface to
JShell named InMASS (Alghamdi, 2020) for forward
and backward computation.
In conventional data streaming, Spark ad-
dresses forward/backward computation with im-
mutable RDDs that create new versions upon any
transformation applied to them, and thus keeps old
RDDs retrievable with their references. This strat-
egy takes the same effect as checkpointing and roll-
back of computation. To avoid generating too many
snapshots of RDD, Spark carries out lazy evaluation
An Interactive Environment to Support Agent-based Graph Programming
151

of RDD transformations until they really need to be
evaluated for passing their changes to RDD actions
(which produce non-RDD values). In agent-based
graph programming, agents travel or propagate over a
graph as changing each data item. This in turn means
that, if we use the same strategy as Spark’s dataset
immutability, we need to take a snapshot every time
an agent changes each vertex. Furthermore, unlike
Spark’s RDD, (i.e., a collection of data items), a graph
needs more disk space for storing its serialized data
upon a checkpointing and more time for de-serializing
it upon a rollback. Taking these overheads in consid-
eration, we implemented interactive parallelization in
the MASS library as follows:
1. Maintaining only One Snapshot of Computa-
tion: MASS users are supposed to commit their
operations to an in-memory graph once they have
no intention to roll back beyond this checkpoint.
This saves the secondary storage space.
2. Maintaining a History of Previous MASS
Function Calls: The MASS library will keep
recording any MASS functions invoked since the
last snapshot was taken, so that MASS can rebuild
any past graph structure between the snapshot and
the latest graph state.
3. Rolling Back Computation by Re-executing
Functions in History: Upon a user-specified roll-
back, the MASS library will re-apply previous
function calls to the snapshot in a chronological
order all the way to the rollback point. While
this rollback scheme needs a substantial time to
rebuild a past graph, the normal computation can
run faster without continuously taking a snapshot
of ongoing executions onto disk.
At the highest level, InMASS is simply a wrap-
per class that initializes a JShell window and receives
MASS statements from users. The challenges of In-
MASS implementation, however, revolve around (1)
making JShell function properly for all cluster nodes
in a distributed environment and (2) deciding how to
save and reload computation state for checkpoint and
rollback functionality.
To address issue 1, we customized a Java class
loader named InMASSLoader that facilitates distribu-
tion of new classes’ bytecode from the MASS mas-
ter to worker nodes. Once all computing nodes are
aware of the new classes, they use new MASSObject-
InputStream and MASSObjectOutputStream functions
to assist in serialization and deserialization of these
dynamic classes.
To address issue 2, we had Agents and Places in-
herit AgentsInternal and PlacesInternal serializable
classes to facilitate serialization and deserialization of
all agents and places data. Then, each MASS worker
process gathers all hash tables containing all Agents
and Places instances, and holds them in one single
object named MState. This is the object to be saved
and updated on checkpoint and rollback. (Note that
users can choose a checkpoint storage from active
memory, temporary disk location, or a specified file
in disk.) To facilitate user ability to rollback to states
other than the original checkpoint, the MASS master
process prepares the MHistory object to keep a log of
all API calls to Agents and Places and to store their
bytecode to enable re-execution on demand. Conse-
quently, when a user requests rollback to “step 5”, for
example, the original snapshot will be loaded from
MState, and then MHistory will execute the next five
API calls that follow the snapshot.
3.4 Graph and Agent Visualization
To facilitate visualization and validation of agent ac-
tivities over a distributed graph, we have extended
the existing MASS-Cytoscape integration, based on
the following three implementation strategies: (1) al-
lowing users to focus on programming their graph
application, (2) following the OSGi framework to
modularize MASS-related plugins, and (3) allowing
large-scale graphs to be visualized by retrieving par-
tial graphs from MASS.
3.4.1 Usability Enhancement
Figure 4 presents an overview of the MASS-
Cytoscape architecture. We have illustrated the user’s
two points of interaction on the left side of the fig-
ure, with the JShell window for running their code in
MASS and with the MASS Control Panel for manag-
ing their data flow and visualization in Cytoscape.
The MASS Control Panel serves three main func-
tions. First, it provides a single point of interaction for
the user by internally managing the data transfer plu-
gins: import-network, export-network, and import-
agents. Second, it provides the ability to manipu-
late the MASS Configuration tables that inform the
data transfer plugins of how to find the MASS com-
putation and what data to pull back into Cytoscape.
Lastly, it provides the interface and logic for visualiz-
ing agent movement through manipulation of the Cy-
toscape data tables and network view.
In MASS, the CytoscapeListener class must be
started by the user application to open a TCP-based
communication port for MASS-Cytoscape communi-
cation. This listener will then field any requests from
Cytoscape by first parsing the request, then obtaining
reference to the corresponding GraphPlaces method,
and finally invoking that method and returning the re-
sults to the requesting Cytoscape plugin. Internally,
ICAART 2022 - 14th International Conference on Agents and Artificial Intelligence
152
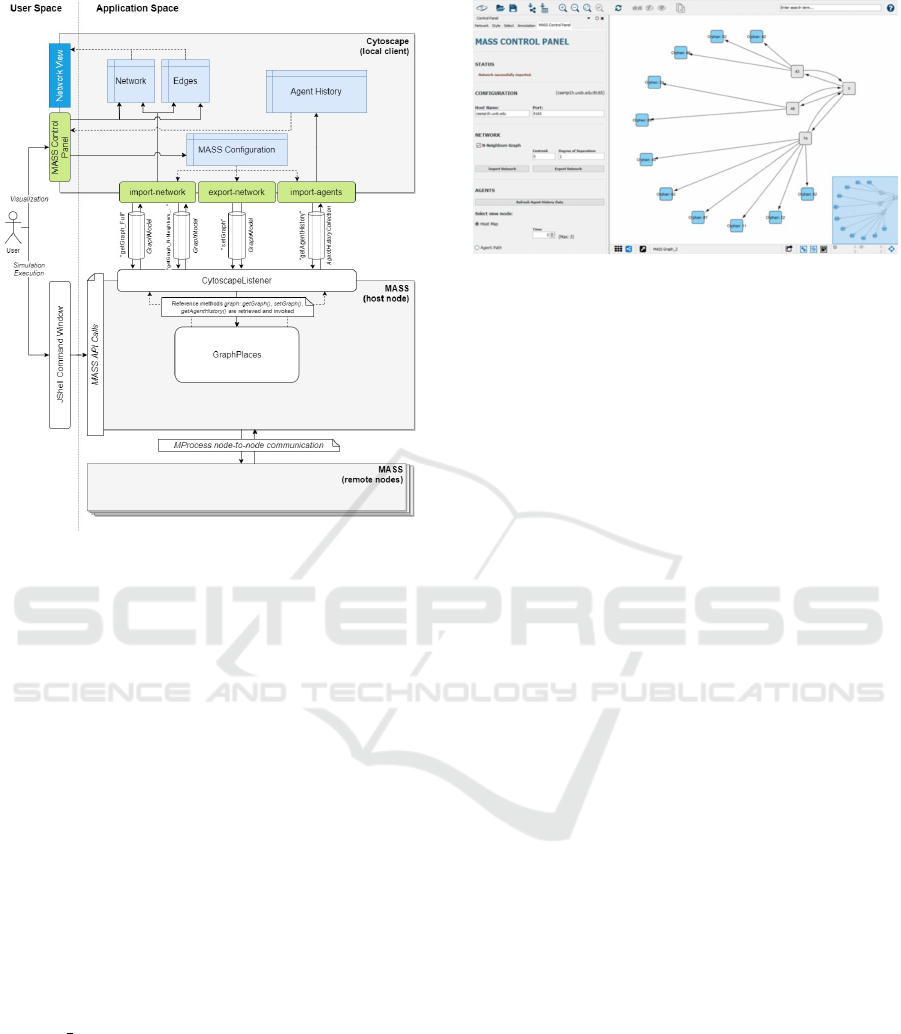
Figure 4: MASS-Cytoscape integrated architecture.
the GraphPlaces methods utilize standard MASS in-
ternal APIs, such as callAll(), to communicate with
the rest of the cluster and set or retrieve the appropri-
ate information.
Visualizations in Cytoscape are all controlled by
two factors: the layout and the network view. While
we utilized the “Circular” layout, (i.e., one of Cy-
toscape’s defaults), we customized the network view
to change edge thickness and vertex color for visual-
izing agent travel histories.
3.4.2 Modularity and Expandability
Cytoscape plugin components must follow OSGi to
modularize them in a bundle. Since each bun-
dle is self-contained, plugin developers are respon-
sible to coordinate bundle invocations and to pro-
vide bundle-to-bundle data communication. We han-
dle this communication using a shared table named
“MASS Configuration table” within the Cytoscape
environment. The table includes fields for the MASS
host name and port as well as other fields used for par-
tial graph streaming. The MASS Control Panel writes
new values to the table after taking inputs from the UI
and the data transfer plugins read in relevant informa-
tion each time a new data transfer task is created. To
tolerate any ordered start-up of bundle, the panel also
maintains a reference to each of the data transfer plu-
gins and the ability to test and reacquire the reference.
Figure 5: N-neighbors retrieval with centroid = 0, DoS = 1.
3.4.3 Graph Scalability
Visualization of a partial graph is important in situa-
tions where the MASS cluster is operating on a graph
too large to be stored in a single machine. To allow
the visualization environment to support the scale of
these graphs, we have implemented an optional “N-
Neighbors” approach to graph retrieval from MASS.
This requires the user to provide a centroid node ID
as well as determine the degrees of separation (DoS)
that should be imported. DoS is interpreted as the
number of neighbor rings that we would like to visu-
alize. Shown in Figure 5, if the user selects “1” DoS
then the graph retrieval will bring back the centroid
node as well as one ring of immediate neighbors.
To manage this request on the MASS side of the
program, the MASS master node first receives the
request, saves centroid and DoS information, and
then invokes GraphPlaces’s getGraphNNeighbors()
method. This method iteratively queries the remote
workers for each DoS requested, passing a list each
time to ensure only the required graph vertices are
sent back. This approach is critical when a given
graph is too large for a single machine.
4 EVALUATION
We evaluated the MASS interactive environment in
the following three criteria: (1) execution perfor-
mance, (2) ease of programming, and (3) usefulness
of visualization. Our evaluation used a cluster of eight
computing nodes, each with an Intel Xeon Gold 6130
CPU at 2.10GHz and 20GB memory.
4.1 Execution Performance
We first compared the execution performance be-
tween the agent-tracking API and the conventional
history-passing technique (i.e., maintaining and pass-
An Interactive Environment to Support Agent-based Graph Programming
153
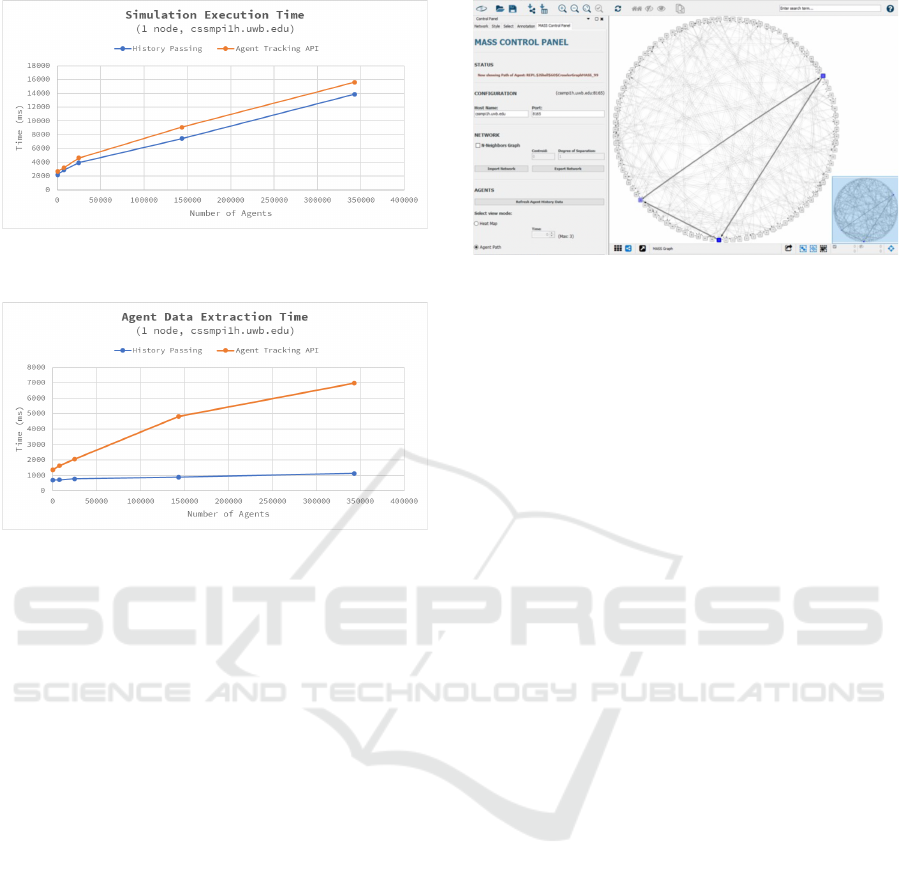
Figure 6: Performance of triangle counting with agent-
tracking API versus history-passing technique.
Figure 7: Agent data extraction overheads incurred by
agent-tracking API and history-passing technique.
ing a travel history from a parent to its children di-
rectly every time new children was spawned). We uti-
lized the agent-based Triangle Counting benchmark
application for this comparison.
Since the agent population increases exponen-
tially when the graph expands, we use the total num-
ber of agents to provide context to our results. Fig-
ure 6 shows Triangle Counting’s execution time as
increasing the number of agents. Note that we calcu-
lated the average of five measurements. Beyond 140K
agents, we observe approximately 1,700ms ( 11-18%)
slower performance when using the agent-tracking
API. This increase in processing time is due to the
added overhead from data capture methods invoked
when agents are spawning and moving. This gap
widens slightly when running in multi-node config-
urations due to network latency, but the correlation
between the two techniques remains consistent.
Figure 7 compares agent-tracking API and the
history-passing technique in their overheads when ex-
tracting agent data. We conversely observe a signifi-
cant gap in performance between the two techniques
regarding agent-data extraction time. This is because
the agent-tracking API returns all agent data from
places and takes additional step to clean, sort, and
propagate the data upon retrieval.
Figure 8: Agent path visualization.
4.2 Programmability Evaluation
The following qualitatively compares the history-
passing technique and the agent-tracking API:
1. History-passing Technique: only works for
agents that are alive upon data extraction and re-
quires the user to have additional understanding
of the MASS library, which resulted in more lines
of code, (i.e., 15 lines)
2. Agent-tracking API: presents history for all reg-
istered agents at any point of execution, can be
initiated and then ignored until needed, which is
more intuitive with 13 lines of code for inexperi-
enced MASS users.
4.3 Graph and Agent Visualization
We have implemented two agent visualizations in Cy-
toscape: Agent Path and Heat Map. Both visualiza-
tions are generated using the MASS Control Panel
and each can be manipulated in the network view.
Agent Path is shown in Figure 8 and provides the
user with the ability to review the complete path of
any individual agent. The more recent movements
are represented with a darker node and thicker edge.
If an agent ever traverses a non-existing edge, then
a dashed line is created to signal the issue to the
user. This view is particularly useful in computation,
such as Triangle Counting, where the pattern of agent
movement determines the success of the application.
The Heat Map visualization, shown in Figure 9,
provides the user a representation of all agents ac-
tive in the simulation at a point in time with darker
nodes representing higher concentrations of agents.
The user is then able to cycle through the time vari-
able of the computation to observe movement patterns
of the entire group. This visualization is best applied
to use cases such as in network centrality analyses, in
which we seek to observe aggregate movement pat-
terns centralized around particular vertices of interest
ICAART 2022 - 14th International Conference on Agents and Artificial Intelligence
154
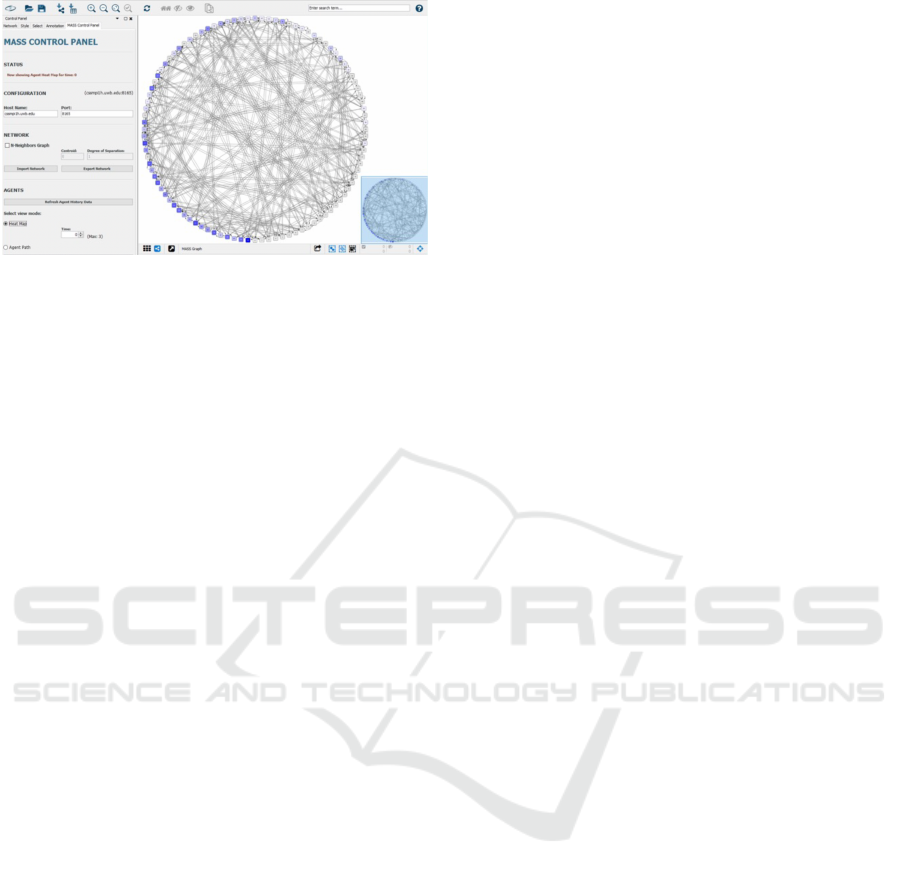
Figure 9: Heat map visualization.
in graph analysis.
In comparison with MASS, Repast Simphony pro-
vides a GUI for both execution and visualization
of graph analysis through their integration with the
Eclipse IDE. This integration also provides plugin
support for 2D/3D visualization of the simulation
“Context”, (which corresponds to MASS Places and
Agents.) The visualizations, known as “Projections”,
(which includes “Network Projections”) are config-
ured through the IDE before starting the simulation
and are strictly synchronized with simulation execu-
tion. Repast Simphony does provide statistics and
logging features for reviewing historical data, but the
simulation itself is limited to only stepping forward
through execution or running the simulation at full
speed.
Contrary to that, MASS separates the execution
and visualization aspects of the system into two win-
dows. Computation is handled through the command-
line interface, which also enables forward and back-
ward stepping through the inclusion of JShell with
checkpointing and rollback features. Visualization is
then managed separately through the Cytoscape GUI
and MASS-specific extensions. Adding support for
agent visualization in this work brings MASS on par
with Repast Simphony as far as what objects can be
visualized, but our visualizations are still limited to
2D views. Most importantly, the separation of view
and execution concerns allows for the visualization to
be completed asynchronously and the visualizations
to be adjusted as desired through the Cytoscape GUI
without the need to pre-configure or restart a compu-
tation.
5 CONCLUSIONS
To enable more rapid development and exploration
when building agent-based graph programs, we intro-
duced new APIs for tracking agent data, incorporated
an interface for forward and backward computation
with JShell, and expanded integration of Cytoscape
for visualization of MASS GraphPlaces and asso-
ciated Agents. Verification using Triangle Counting
showed minimal impact on execution performance,
though increased overheads on agent-data extraction
times.
Our future work is two-fold in Cytoscape ex-
pansion: (1) visualization capabilities of multi-
dimensional arrays and binary/quad trees and (2) fil-
tering capabilities of agents to capture for their graph
traverse, (e.g., those alive at a particular time or
marked as a successful traveler).
REFERENCES
Alghamdi, N. (2020). Supporting Interactive Computing
Features for MASS Library: Rollback and Monitoring
System. Technical report, UW Bothell.
Bic, L. et al. (1996). Distributed Computing Using Au-
tonomous Objects. IEEE Computer, 29(8):55–61.
Davis, D. B. et al. (2018). Data provenance for agent-
based models in a distributed memory. Informatics,
5(2):https://doi.org/10.3390/informatics5020018.
Fukuda, M., Gordon, C., Mert, U., and Sell, M. (2020).
Agent-Based Computational Framework for Dis-
tributed Analysis. IEEE Computer, 53(3):16–25.
Gilroy, J., Paronyan, S., Acoltz, J., and Fukuda, M. (2020).
Agent-Navigable Dynamic Graph Construction and
Visualization over Distributed Memory. In 7th Int’l
Workshop on BigGraphs’20, pages 2957–2966. IEEE.
Lange, D. B. and Oshima, M. (1998). Programming and
Deploying Java Mobile Agents with Aglets. Addison
Wesley Professional.
Malewicz et al. (2010). Pregel: a system for large-scale
graph processing. In Proc. of the 2010 ACM SIG-
MOD, pages 135–146, New York, NY, USA.
Nieplocha, J. et al. (2006). Advances, Applications and Per-
formance of the Global Arrays Shared Memory Pro-
gramming Toolkit. Int’l Journal of High Performance
Computing Applications, Vol.20(No.2):203–231.
O’Madadhain, J. et al. (2003). The JUNG (Java Universal
Network/Graph) Framework. Technical Report UCI-
ICS 03-17, School of ICS, UC Irvine.
Oracle (2017). Java Platform, Standard Edition, Java Shell
User’s Guide, Release 9. Technical Report E87478-
01, Oracle.
Sapaty, P. and Borst, P. (1996). Wave: mobile intelligence in
open networks. In Proc of COM’96, pages 192–195,
Portland, OR.
Wang, X. and Zhang, L. (2017). The research of the roll-
back mechanism in parallel simulation. In 13th IEEE
ISADS, pages 90–95.
Wenger, M., Acoltzi, J., and Fukuda, M. (2021). Comparing
Thread Migration, Mobile Agents, and ABM Simula-
tors in Distributed Data. In PAAMS 2021, pages 328–
340, Salamanca, Spain.
An Interactive Environment to Support Agent-based Graph Programming
155
