
NetVisGame: Mobile Gamified Information Visualization of Home
Network Traffic Data
Marija Schufrin
1 a
, Katharina Kuban
2
, Arjan Kuijper
1,2 b
and J
¨
orn Kohlhammer
1,2 c
1
Fraunhofer IGD, Germany
2
TU Darmstadt, Germany
Keywords:
Cyber-security Literacy, Network Traffic Analysis, Mobile Game, Information Visualization.
Abstract:
The awareness of everyday internet users for cyber security becomes ever more important considering the
ubiquity of the Internet in everyday life. However, people usually lack the necessary understanding of this
topic or the motivation to pay attention to the problem and its possible consequences. In this paper, we present
the novel idea of combining visualization of one’s own personal data related to cyber-security literacy with a
casual gaming approach. We therefore introduce our prototype, NetVisGame, in which we have implemented
the idea for personal network traffic data based on a preliminary user study. The evaluation results of the first
iteration of the user-centered design process supports the assumption that this approach is feasible to raise
interest for and foster understanding of network traffic data and therefore could be a promising approach for
data and technologies related to cyber-security literacy.
1 INTRODUCTION
Users play a significant role in preventing cyber at-
tacks (Bradley et al., 2015). Therefore, approaches to
support cyber-security awareness (Bada et al., 2019)
of average internet users are important. While it is
common practice for experts to periodically monitor
events in the network (Ghafir et al., 2016) or ana-
lyze recent network traffic (Shiravi et al., 2011), most
non-experts do not even think about this possibility
and intruders can remain largely undetected (Feam-
ster, 2010) There are mainly two barriers that a user
is confronted with when it comes to network analy-
sis. First, the concepts and data of network traffic are
abstract and hard to grasp. Second, there is a lack of
motivation to invest time to gain the necessary under-
standing. Recent work applies concepts of informa-
tion visualization to make abstract data more accessi-
ble to users (Shiravi et al., 2011). However, this still
falls short of the second barrier, creating the need for
additional incentives (Schufrin et al., 2018). Our ap-
proach is to embed the visualization of personal data
into a game, following the success of games being
used as educational tools (Alotaibi et al., 2016). Com-
mon game approaches are mostly based on general
a
https://orcid.org/0000-0003-4642-5605
b
https://orcid.org/0000-0002-6413-0061
c
https://orcid.org/0000-0003-1706-8979
explanatory data. We argue that using real-life per-
sonal data as a basis has multiple benefits for raising
awareness. In this paper, we present NetVisGame, our
prototypical mobile application, where we have ap-
plied the novel concept to recorded traffic data from
home networks. We further argue that this approach
is applicable to different types of data and to a wide
range of use cases for improving other areas of cyber-
security awareness. To identify the needs of the tar-
geted user group we conducted a user study with 41
participants and derived three representative personas.
We then used these personas to design NetVisGame
following a UCD process (ISO 9241-210, 2010). Our
contributions are: (1) A novel concept combining a
gaming approach with information visualization for
the exploration of real-world router network data; (2)
The description of the design process for the develop-
ment of a gamified information visualization for real
data related to cyber-security literacy. (3) A set of de-
rived personas based on a preliminary user study as
well as the characterization of the relevant problem
space; (4) NetVisGame: An implemented prototypi-
cal mobile game for gamified network analysis as a
result of the first user-centered design iteration;
Schufrin, M., Kuban, K., Kuijper, A. and Kohlhammer, J.
NetVisGame: Mobile Gamified Information Visualization of Home Network Traffic Data.
DOI: 10.5220/0010778800003124
In Proceedings of the 17th International Joint Conference on Computer Vision, Imaging and Computer Graphics Theory and Applications (VISIGRAPP 2022) - Volume 3: IVAPP, pages
129-138
ISBN: 978-989-758-555-5; ISSN: 2184-4321
Copyright
c
2022 by SCITEPRESS – Science and Technology Publications, Lda. All rights reserved
129

2 RELATED WORK
In this section we show that there is no compara-
ble approach that combines methods from informa-
tion visualization and game design for the exploration
of network data. We first look at general approaches
to increase cyber security awareness, followed by ap-
proaches for the visual analysis of network data and
existing gamified approaches to teach cyber security.
Cyber Security Awareness. The challenge of in-
creasing the awareness for cyber security is not
new (Furnell et al., 2007; Lebek et al., 2014;
Nthala and Flechais, 2018). Different approaches are
known(Abawajy, 2014) ranging from conventional
approaches such as electronic and paper resources,
over instructor-led and online approaches to video-
based, simulation-based and game-based approaches.
There are several studies examining the users’ percep-
tion and attitude towards privacy and security (Fur-
man et al., 2011; Nthala and Flechais, 2018; Busse
et al., 2019). Network security is a relevant sub-
domain of cyber security (Nthala and Flechais, 2018).
This area is especially interesting with respect to the
emerging trend of smart homes and the internet of
things (Barbosa et al., 2020; Cobb et al., 2020).
Visual Analysis of Network Data. Inspecting and
analyzing network traffic data is a common task in
the area of IT and cyber security. Experts, however,
often use the console or powerful analysis tools like
wireshark (Ndatinya et al., 2015) that only provide a
list-based presentation of data, though. Several ap-
proaches aim at applying information visualization
methods (Card et al., 2009) to support the analysis
of network data, as for example summarized by Shi-
ravi et al. (Shiravi et al., 2011) or also newer ap-
proaches such as (Ulmer et al., 2019; Guerra et al.,
2019; Krokos et al., 2018; Arendt et al., 2015; Arendt
et al., 2016). Unfortunately, all of these approaches
are mostly suitable for users with expert knowledge.
As the survey of Huang et al. (Huang et al., 2014)
shows, personal visualizations for cyber security are
quite rare. Nevertheless, there have been attempts to
design information visualization for IT-network anal-
ysis for laypersons, e.g. by Legg et al. (Legg, 2016)
or Ulmer et al. (Ulmer et al., 2018). Unfortunately,
it is not enough to visualize the data, if there is no
motivation to use the visualization in the first place.
Schufrin et al. (Schufrin et al., 2018) therefore ar-
gue for a stronger focus on the user experience de-
sign, when it comes to information visualizations in
context of cyber security for non-experts. They also
presented a comparable approach in (Schufrin et al.,
2020). In contrast to this paper, we propose a com-
bination of information visualization embedded in a
mobile game with a purpose. This type of games are
also known as serious games (D
¨
orner et al., 2016).
Games for Cyber Security Awareness. Serious
games with the goal of behaviour change and user en-
gagement can be found in different contexts. Susi cat-
egorizes them into military, government, educational,
corporate and healthcare (Susi et al., 2007). Our ap-
proach fits into the category educational. There are
especially successful examples for serious games in
the context of fitness and physical activities (Dutz
et al., 2014), as the popularity of Wii Fit seems to
show, which was first released at the end of 2007
(Goble et al., 2014). Looking at the parallels of fitness
or healthcare to personal cyber security, there is much
to be learned from these established approaches. An-
other concept, that is proven to motivate and possi-
bly change behaviour is gamification (Sim
˜
oes et al.,
2013; Deterding et al., 2011; Berengueres et al.,
2013). Gamification aims to apply concepts from
video games to non-gaming contexts. There are in-
deed a number of gaming approaches for the purpose
of increasing awareness for cyber security, which are
summarized by Hendrix et al. (Hendrix et al., 2016)
and Alotaibi et al. (Alotaibi et al., 2016). Some se-
lected recent examples are Passworld (Jayakrishnan
et al., 2020), Anti Phishing Phil (Sheng et al., 2007)
and many others (Tupsamudre et al., 2018; CJ et al.,
2018; Seitz and Hussmann, 2017; Giannakas et al.,
2015; Denning et al., 2013; Thompson and Irvine,
2011). These examples show that a gaming approach
can be applied to different issues related to cyber se-
curity to support users’ engagement and increase the
effectiveness of training. Nevertheless, none of these
approaches use real user data as the educational basis
for the game. Also, none of the approaches present a
combination of information visualization and gaming.
Closest to our work is the approach by Schweitzer and
Brown (Schweitzer and Brown, 2009), in which infor-
mation visualization is actually applied to cyber secu-
rity education. However, it is rather a simulation than
a game, no personal data is used, and the approach is
designed to be used in class rather than as a personal,
let alone mobile, application.
3 USER STUDY
We conducted an online user study with 41 partic-
ipants (16m, 25f) from Germany. The participants
were volunteers who we have invited from different
communities. The main goals of the study were to ex-
IVAPP 2022 - 13th International Conference on Information Visualization Theory and Applications
130

IT‐knowledge general
16
10
1
12
2
none average high
(a) general IT knowledge
16
9
12
2
2
none average high
ITknowledge ‐ privacy
(b) internet privacy
3
7
8
2
21
none average high
(c) IT security
7
19
8
5
1
none average high
(d) network data
performed activities
never
rareley
sometimes
often
very often
Accessed my router's settings
24%
22%
24%
10%
15%
Dealt with network data
37%
34%
17%
7%
2%
Looked up my own IP-address
27%
34%
22%
5%
10%
Looked up the IP-address of another website
63%
20%
10%
2%
2%
Paid attention to the encryption of the website I visited
37%
29%
15%
5%
15%
Used a VPN service
39%
12%
17%
7%
7%
Figure 1: IT knowledge of participants of our preliminary user study (n=41). The bar charts show the self-assessed knowledge
about three aspects of IT. The table shows how often the participants claim to perform certain network-security activities.
amine our hypothesis, that the common internet user
is not concerned with network data, and to find possi-
ble reasons for that behaviour. The study also aimed
at a better understanding of the needs of the targeted
user group to derive appropriate requirements. We
then used the answers to define personas. In the eval-
uated group 56% of the subjects were 20-25 years old
(with an overall average age of 36 years) While this
distribution brings a certain bias into the sample, we
argue that it is adequate to start with such a sample
for the definition of selected personas, as these per-
sonas are definitely part of the targeted groups. IT
Knowledge: The participants were asked to assess
their general IT knowledge and knowledge about in-
ternet privacy, IT security, and network data on a 5-
point Likert scale. Additionally, users were asked to
specify how often they perform activities related to
network communication such as ”I access my router
setup”. Fig.1 (a-d) shows the respective results. It
could be observed that the performed activities gen-
erally matched the knowledge of the subjects. Rea-
sons for Not Dealing with Network Data: Users
answered an open question on why they would or
would not (or rarely) perform the above-mentioned
activities. Users mainly named three reasons: lack of
understanding (18 responses, including multiple an-
swers), lack of necessity (15), lack of interest (7). In-
terestingly, despite the open question, these were the
only stated reasons for not performing such activities.
Internet Usage Habits: We also wanted to gain a
better understanding of the participants’ usual internet
behavior. The results (see Table 1) show that the par-
ticipants are using the Internet for an average of two to
four hours a day, almost all of them on smartphones
(93%) and laptops (80%) All are using it for com-
munication, most for online banking (80%), shopping
(90%), and entertainment (85%). 36 of 41 subjects
share their home network with others. These results
match the CIGI-Ipsos Global Survey on the global be-
havior on the Internet (CIGI-Ipsos, 2019).
Fears, Insecurities and Barriers: We were inter-
ested in fears, insecurities, and barriers that have pre-
vented participants from resolving their open ques-
tions (see Table 2). We asked about what makes users
feel insecure on the Internet to stress the difference
to fear (see Fig. 2b). Our open questions concerned
internet security and the security of own network con-
nections (see Fig. 2c). 54% of the participants have
tried to solve their question, of which 64% success-
fully found an answer. However, the reasons for not
even trying to get answers from the remaining 46%
revealed mostly the following reasons: no necessity
(6), lack of time (4), lack of understanding or inter-
est (4), or fear of complexity (3). The statement of
one participant ”There is so much [information] and
I don’t know ... whom I can trust... In the end I
might have learned wrong information.” represents
well, why the participants were not able to find an
answer to their question. Most were overwhelmed by
the variety of possible answers and the problem to dis-
tinguish wrong and right.
Gaming Habits: To assess our basic idea of design-
ing a game, we asked the participants about their gam-
ing habits. In the group of participants only a quar-
ter (24%) of the subjects claimed to not like play-
ing games at all. The others mentioned games that
NetVisGame: Mobile Gamified Information Visualization of Home Network Traffic Data
131

Table 1: Habits of internet usage (n=41): On which devices do you use the internet? For which activities do you use the
Internet? How many people have access to your WiFi/LAN?
used devices participants %
phone 38 93%
laptop 33 80%
computer 15 37%
tablet 14 34%
TV
10
24%
games console 4 10%
appliances 3 7%
(a) used devices
used for participants %
communication 41 100%
Shopping 37 90%
entertainment 35 85%
online banking 33 80%
social media
28
68%
work 26 63%
(b) used for
# people on network participants %
Just me 5 12%
2-3 people 15 37%
3-5 people 12 29%
5-10 people 8 20%
> 10 people
1
2%
(c) amount of people
vary widely from board over casual mobile to console
games with different themes. While 27% claimed to
not play games at all, 61% said to play little or some-
what and 12% much or very much.
4 DATA-USER-TASK
In this section, we describe the scope of our approach
according to the design triangle of Miksch and Aigner
(Miksch and Aigner, 2014), which we have defined
based on the general idea and the user study.
4.1 User - Personas
We use personas to support the design process and
further specify the users’ needs. We identified three
groups of relevant users and corresponding personas,
making it easier to decide about design ideas and
address emotions and motivations of the subjects.
To create the personas we divided the subjects into
groups based on their characteristics. The personas
are shown in Fig. 2. The first subdivision was
made by general IT knowledge (see Fig. 2a, 2b).
The first group contains subjects with none or little
IT knowledge (11 subjects), represented by Lisa.
Subjects in this group are rather young, as 9 out of the
11 subjects are under 30 years old. The second group
contains subjects with average to good IT knowledge
(30 subjects), represented by Lukas and Andrea,
further differentiated by gender (Fig. 2d, 2c). 14
of the 30 representatives in this group are male, 16
female. Fig. 2d shows that the male subjects are all
under 30; there is a wider range for females, as 69%
are over 45 years old. The assessed IT knowledge
is distributed evenly across gender. The devices
used by these subjects are more diverse than for the
subjects represented by Lisa, and even include home
appliances.
Lisa: Lisa represents the none to low IT knowledge
group of subjects. She has hardly any IT knowledge
apart from doing necessary everyday activities on the
Internet, such as communication via messengers, on-
line banking, or research for university. She some-
times plays games on her phone. The main reason for
her not to deal with network data is her insufficient
knowledge about it. Because of that, she is scared
to try any new technology-related activities and states
not to understand it anyways. If asked what bothers
her when using the Internet, she is concerned about
protecting her data. For the user group represented
by Lisa, an elementary introduction to the topic is re-
quired.
Lukas: The persona Lukas represents rather younger
users who are using the Internet very often, on av-
erage four to six hours per day and are not thinking
much about cyber security. He has good general IT
knowledge and some knowledge about cyber security
and network data as well. Furthermore, he rarely has
open questions regarding IT security, and if he does,
the questions are not important enough for him to in-
vestigate. Thinking his knowledge is sufficient, he has
no motivation to deal with network data and is not
really interested either. He also likes playing video
games.
Andrea: Andrea represents the users with average
general IT knowledge and little knowledge about spe-
cific areas such as cyber security or network data.
She is worried about cyber crime and privacy on the
Internet and tries to answer upcoming questions on
her own. Her main reason for not having dealt with
network data is that she thinks her knowledge is not
enough to do so. In general, she is interested in learn-
ing more about security on the Internet but has diffi-
culties with complex topics. She shares her network
with two other people and is online for two to four
hours a day (this was before Covid-19). The main
question she asks herself regarding this topic is: ”how
secure is my network?”.
4.2 Task
The user study revealed that most users want to stay
safe on the Internet and avoid cyber threats. However,
they are mostly not sure how to achieve this goal and
IVAPP 2022 - 13th International Conference on Information Visualization Theory and Applications
132
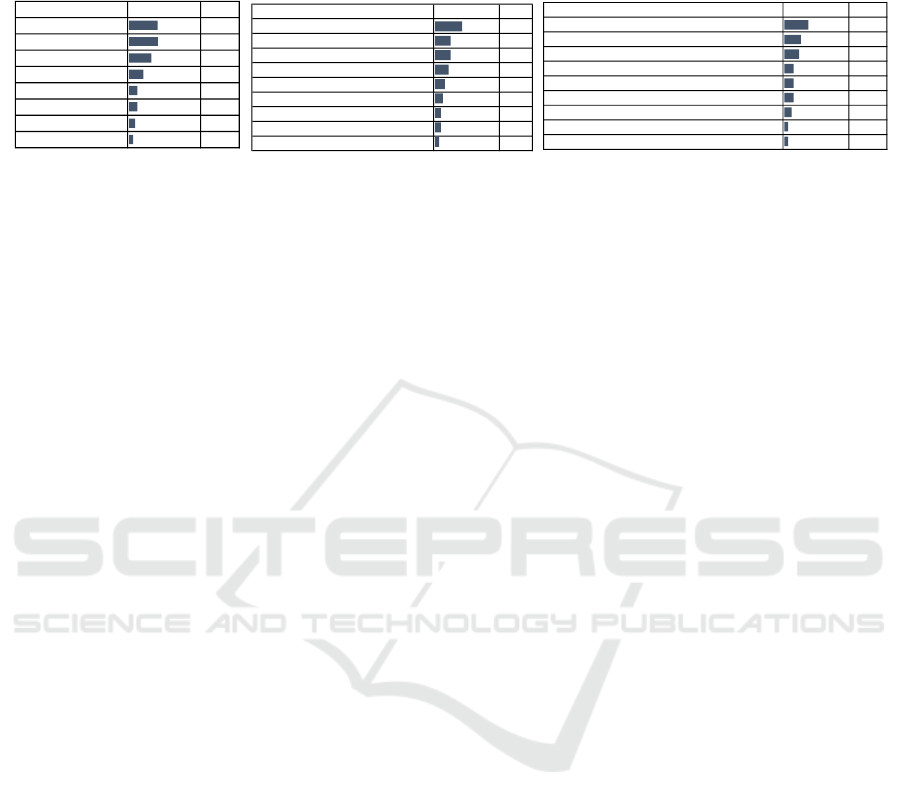
Table 2: Fears and insecurities when using the internet (n=41): What are you afraid of when using the internet? What makes
you feel insecure when using the internet? What questions do you have about security on the internet, in particular the security
of your network connection?
fears
participants
%
None
14
34%
Data theft/Saving
14
34%
Spying
11
27%
Cybercrime
7
17%
Malware
4
10%
Bad usability
4
10%
Privacy
3
7%
Little transparency
2
5%
(a) fears
insecurities
participants
%
Privacy
14
34%
Cybercrime
8
20%
None
8
20%
Own insufficient knowledge
7
17%
Matching online advertising
5
12%
Difficulties to use software
4
10%
Own security vulnerabilities
3
7%
Online banking
3
7%
Public WIFi
2
5%
(b) insecurities
Relevant questions
participants
%
None
13
32%
How secure is my network?
9
22%
How do I secure my network?
8
20%
How do I protect my data?
5
12%
Which data can be accessed from network data?
5
12%
Improve IT-security without much knowledge?
5
12%
Hacking through one device into the network?
4
10%
Reasons for/types of attacks?
2
5%
Which provider is secure?
2
5%
(c) relevant questions
not aware of the risks involved, especially regarding
network data. While they are also not interested in
network data and have no motivation to deal with the
topic, many users think their knowledge is insufficient
to do so, which is actually true in many cases. Mean-
while, useful information on individual cyber secu-
rity is gained by inspecting personal network traffic.
A sharpened eye can therefore help to detect curious
behavior and counteract in time. The purpose of our
game is, thus, to grab the initial attention of casual
users and make them curious about the network anal-
ysis by overcoming the two barriers defined in Sec.1.
Thus, with our approach we aim to address the fol-
lowing main goals:
G1: Promote users’ motivation for home network
traffic analysis
G2: Strengthen users’ understanding of home net-
work traffic analysis
We further differentiate two subgoals of G2. As a
first step (elementary step), users should be provided
with an insight into their own network data. The sec-
ond step (advanced step) is to provide the user with
a deeper understanding of the underlying technology
of network communication. While we do not expect
the user to become an expert after using our game, we
rather aim lower the barrier by providing technologi-
cal details in a playful manner. To inform our visual
design, it is helpful to define the tasks, in which the
visualization should support the user. Based on our
two subgoals, We identify eight tasks that we aim to
support with our prototype. T1-T5 are related to the
elementary step and T6-T8 to the advanced step.
T1: Get overview of all active devices on the net-
work.
T2: Get overview of or inspect (external) IP ad-
dresses
T3: Get overview of established network connections
T4: Explore the communication behaviour of devices
T5: Identify suspicious IP addresses or devices
T6: Learn technical details about network communi-
cation
T7: Discover protocols that are used in the network
T8: Discover similarities or differences of different
connection and protocol types
4.3 Data
In our approach focus on traffic data in a home IT net-
work. This traffic can be recorded by the router result-
ing in a pcap file This file contains detailed informa-
tion about the connections that have been established
within the network during the recorded time span. To
provide an insight into users’ own network (G1 ele-
mentary step) (see sec. 4.2) and connections estab-
lished during the recording, three attributes from the
data are needed: Timestamp or packet number; Source
IP and destination IP, Resolved source IP, and re-
solved destination IP. For the advanced part, namely
exploring the technical mechanics behind the connec-
tions with a focus on different types of protocols, the
following two attributes are used: The protocol that
has been used for the data transmission (restricted to
TCP, UDP, HTTP and TLS); the packet info that con-
tains important information about the packet, includ-
ing the type of data being transferred.
4.4 Requirements
Finally we have defined eight requirements for the
game implementation. The first four requirements re-
late to the functionality that the tool should provide
and the last four to the expected effect on the user.
R1: Users should get an overview of their home net-
work and the possibility to explore it.
R2: Deeper information on technical background of
network communication should be provided.
R3: Visualization and game in general should be
easy to understand.
R4: Information visualization and game design prin-
ciples have to be applied.
R5: The game should raise the awareness for net-
work data and motivate users to deal with net-
work data.
NetVisGame: Mobile Gamified Information Visualization of Home Network Traffic Data
133
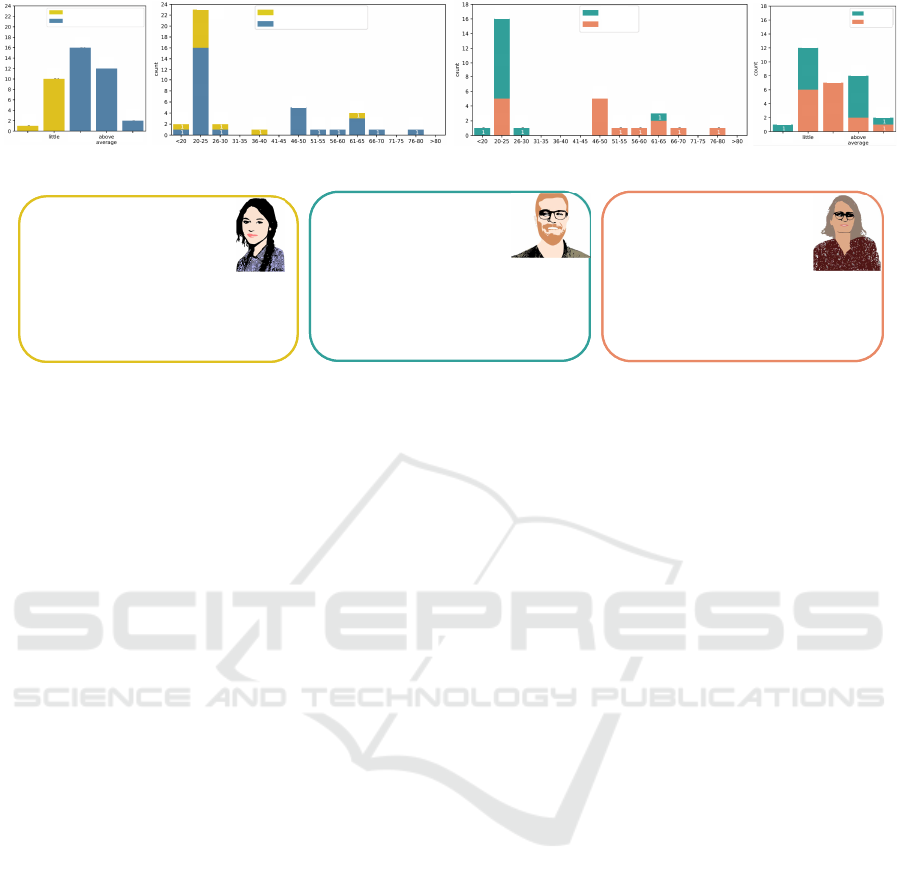
average‐highIT‐knowledge
non/little IT‐knowledge
10
16
12
2
1
none average high
(a) IT knowledge
2 2
1
5
1 1
4
1 1
23
7
16
5
3
average‐highIT‐knowledge
non/little IT‐knowledge
(b) Age
16
1 1
5
1
3
1 1 1
11
5
5
2
female
male
(c) Age
Securityknowledge
12
female
male
7
8
2
1
6
6
7
6
2
none average high
(d) IT security
IT‐knowledge:Hardlyany
Status:Studying
Mainbarrier:Thinksherknowledgeisnot
enoughtounderstandnetworkdata
Internetusage:UsestheInternetforeverydayactivities
Device:mainlyonhersmartphone
Fearsandinsecurities:Worriesmainlyaboutprivacyon
theinternet
Gaming:Sometimesplayscasualgamesonherphone
Question:“HowdoIprotectmydata?“
Lisaf,23
Lukasm,25
IT‐knowledge:GoodIT‐knowledge;
Someknowledgeaboutcybersecurity
Status:Studying
Wifi‐usage:Shareanapartmentwithfiveothers
Mainbarrier:Seesnoreasontodealwithnetworkdata;
Fearsandinsecurities:Notreallyworryingmuchabout
securityissues
Internetusage:Onlineallday
Device:withmultipledevicesinuse
Gaming:Likestoplayvideogames
Question:DoesnothaveanyquestionsregardingIT‐security
Andreaf,50
IT‐knowledge:AverageIT‐knowledge
Status:Working
Wifi‐usage:Sharesnetworkwith
hertwochildren
Mainbarrier:Thinksherknowledgeis
notenoughtodealwithnetworkdata
Fearsandinsecurities:Worriedaboutcybercrime
andinternetprivacy
Internetusage:Searchedtheinternetforanswers
toupcomingIT‐questions
Question:“Howsecureismy(home)network?”
Figure 2: Personas are derived from the preliminary user study (n=41) results by dividing data into subgroups (diagrams). The
first division is made by general IT knowledge resulting in (yellow: hardly any, blue: average to good). The second division,
splits the group with average to good IT knowledge into female (orange) and male (green). Lisa (hardly any IT knowledge),
Lukas (average to good IT knowledge, male) and Andrea (average to good IT knowldge, female).
R6: Playing the game should increase users under-
standing about IT networks
R7: Users’ understanding of data packet transmis-
sion and protocols should increase.
R8: Solution should be perceived as attractive.
5 NetGameVis
Our approach resulted in a mobile jump-and-run
game (see selected screens in Fig.3. To address G1,
i.e. to promote user motivation, we have used two
main factors. The first one is that the approach lets
users explore their own data and thereby provides the
ability to learn something about themselves, primar-
ily addressing two of the basic psychological needs
of meaning and competence (Hassenzahl, 2010). The
second factor is the gaming approach as an engag-
ing mechanism that addresses the psychological need
of stimulation. To address G2, i.e. to increase user
understanding of the relevant concepts, we used in-
formation visualization to make the abstract data of
network traffic records visible for users.
The gameplay of NetVisGame is as follows: First,
users have to load their recorded file (converted to
.csv) into the game ((Fig.3a). As the application is not
connected to a server, this file (containing sensitive
data) never leaves the users’ network during the game.
All following scenes in the game are generated based
on this file. At the start of the game, users see the net-
work visualization with all devices that have been ac-
tive during the recorded time span (Fig.3b). The view
represents the users’ home network with the router in
the middle and the other devices arranged around it.
The device map acts as the navigation menu. At first,
all devices except one are locked. In the next step,
users select an unlocked device. The users are then
asked to rename the device and to select an appropri-
ate iconic representation. Having done this, the scene
changes to the level map (Fig. 3c) showing all com-
munications of the selected device during the record-
ing. The application selects up to four random con-
nections for the next level. They are highlighted in
bold. The other connections can be explored with the
Zoom view (Fig. 3d interactively and independent of
the game flow. Again, all connections are locked ex-
cept for one. Users select the unlocked connection
by clicking on the corresponding circle and move to
the jump-and-run view of the game (Fig. 3e). The
jump-and-run level is constructed with information of
the protocol-related data from the pcap file. In par-
ticular, the packets which have been sent during the
selected connection are used. The exchange of pack-
ets is metaphorically represented by a package de-
livery service. THe users have to deliver the pack-
ets of the connection to the right destination. Dur-
ing the game, users are supported by explanatory and
encouraging displays (Fig. 3f). At the end of each
level, the next connection is unlocked. After finish-
ing all connections of one device, the next device is
unlocked. Unlocked levels can be played again. The
goal is to discover all devices. Unlocking a device re-
sults in seeing the corresponding IP address as well as
its connections. Thus, users can explore the details of
their home network step by step and additionally learn
about the technical background of network communi-
cation.
IVAPP 2022 - 13th International Conference on Information Visualization Theory and Applications
134

5.1 Game Design
As the user study confirmed, many users are not will-
ing to invest much time and effort to look at their own
network traffic. Therefore, a casual game (Kultima,
2009) has been chosen to not demand much time from
the user. According to Schell (Schell, 2008) a game
can be characterized by four basic elements: technol-
ogy, aesthetics, mechanics, and story. In the current
version the story is simply following the metaphor of
a delivery service.
Technology: To provide easy accessibility and given
that many users use a mobile phone as their primary
device, we designed a mobile game. However, it is
also playable on a desktop PC. The (2D) game was
implemented with Unity3D.
Aesthetics: The metaphor of a delivery service sup-
ports the mental model for packet transportation. Aes-
thetics are kept simple in a minimalist design (Nealen
et al., 2011) with a small set of colors, simple iconic
representations of the objects and familiar interac-
tions (jump, move left and right).
Game Mechanics and Dynamics: For the game me-
chanics, primarily levels and challenges have been
used. Praise has also been integrated with congrat-
ulation messages. By using the personal data records,
the desire of self expression is included through the
possibility to reveal the personal details as an achieve-
ment (e.g., the next unlocked device). The challenge
is to unlock each connection and each device (includ-
ing the actual IP address or name) by mastering jump-
and-run tasks of increasing difficulty.
5.2 InfoVis Design
Network Visualization. To cover the tasks T1-T5
and goal G2, we use a network visualization (nodes
and links) in the main view of the tool. Node-link di-
agrams are a common representation of networks, so
that most users are familiar with that representation
and understand the analogy (Saket et al., 2014). The
network visualizations serve as the navigation map for
the game. The devices and IP addresses are mapped
to points, while the type of device is represented by
icons (shapes) and IP addresses by circles. This map-
ping supports T1 and T2. Connections between IP ad-
dresses and devices are represented as lines and relate
to T3. Details are given on demand Fig. 3(d)), which
supports the inspection and exploration of external IP
addresses (T4) in more detail and allows the identifi-
cation of suspicious addresses and devices (T5).
Levels. To support T6-T8 and G2 we use a jump-
and-run (Nealen et al., 2011) game that is based on
the metaphor of a delivery service, where the packets
have to be transported from one building to another
(see Fig. 3 (e)). To increase the understanding of
the technical basics of network communication, users
are forced to pay attention to details of the connection
and the differences between them. The connections
of different protocols are deconstructed into packets
that are represented as different icons depending on
the type of the packet. The type of protocol and pack-
ets are directly related to the selected connection, as
they are derived from the real data. In one run, the se-
quence of the appropriate packages has to be collected
for a specific type of protocol (e.g., for a TCP connec-
tion SYN, SYN ACK, and ACK packets). Source and
destination are metaphorically depicted as buildings.
6 EVALUATION
We conducted a qualitative evaluation of the current
state of the prototype. Seven subjects (5m,2f) with
different levels of IT knowledge were involved in the
evaluation. The evaluation was conducted remotely
with the participants’ own data. The subjects liked
the overall game concept and implementation, includ-
ing the visualization and user interface. Addition-
ally, gameplay aspects such as collecting items were
positively received. Five participants liked playing
the game and four would recommend the game to a
friend. The results of the AttrakDiff questionnaire
(Hassenzahl et al., 2003) showed an average rating
of about 5 for all measured attributes (attractiveness,
pragmatic quality, hedonic quality stimulation, and
hedonic quality identity). Five subjects (with aver-
age or good IT knowledge) found the game easy to
understand, while the game should be improved to
also meet the needs of users with poorer IT knowl-
edge. The statement of a participant of type Lisa
”With some support I would be willing to play it
again and then I think I will understand it much bet-
ter.” motivates to improve the user guidance in the
game. The open questions show that we were able
to trigger some interest. A participant of type Lisa
stated: ”How complex the data transfer is; I knew
less about it than I thought”. Five subjects agreed
that they could indeed get an overview of their home
network. The open questions showed that the game
gave a realistic picture of what the users know about
their network. While the visualization met the expec-
tation of four participants, the other participants dis-
covered that there were many more devices or con-
nections than expected. Five said they improved their
understanding somewhat, one even to a great extent.
The subjects also learned about the transmission of
packets between devices and servers. Several users
NetVisGame: Mobile Gamified Information Visualization of Home Network Traffic Data
135
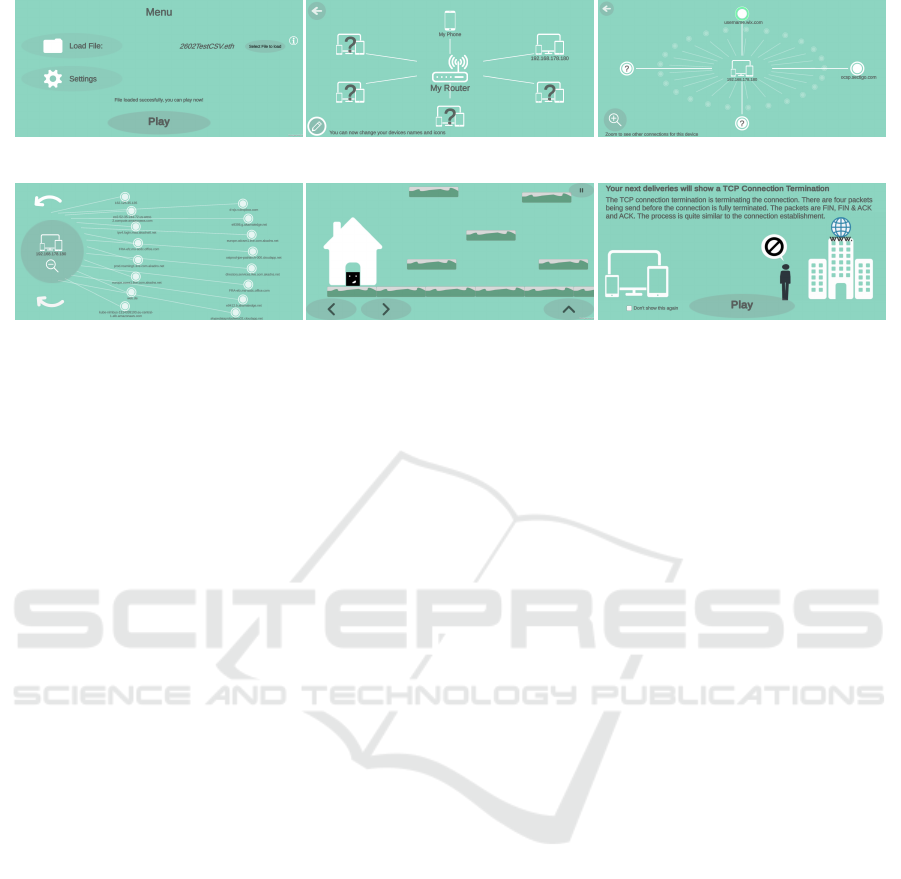
(a) Start menu (b) Device map (c) Level map
(d) Zoom view (e) Level view (f) Explanations and feedback
Figure 3: NetVisGame - Selected screenshots: (a) start menu to select and upload the data file, (b) device map of all devices
in the network. The next device is unlocked when the previous level is finished. (c) level map of the connections of the
selected device. Each bold connection represents a playable level. (d) Zoom view for a deeper exploration of the displayed
connections. (e) level view shows the avatar (black square) that has to deliver packets from one building to another. (f) the
user is supported by animations and textual explanations.
realized that network data contains a massive amount
of data. Six subjects mentioned the game improved
their general understanding of the communication be-
tween devices in the home network and the steps this
includes.
7 DISCUSSION AND
CONCLUSION
The evaluation of the first iteration confirmed that the
overall idea to combine information visualization and
game concepts to let users explore their own cyber
security related data is promising. However, improve-
ments in game design are necessary to increase users’
engagement. Some selected aspects regarding future
work are discussed in this section.
High Entry Barrier: The process to record and to
preprocess one’s own network traffic data is required
for the game and is probably a high entry barrier, es-
pecially for users with no or average IT knowledge.
To alleviate this problem we can follow two direc-
tions. The first direction is to facilitate the record-
ing process of the data, which to our knowledge is
not available from all router types. Depending on the
router model, the process to record the data is com-
plex. Recording the data directly from the game inter-
face would be a good solution, which depends on the
availability of an API provided by the router software.
Even more interesting, but less likely, is an integration
of the game into the router software. The second di-
rection is to replace the preprocessing of the pcap file
with a better solution. We could implement a pcap
parser for the client side, which creates dependency
on the client hardware. A direct server connection,
on the other hand, creates additional problems with
GDPR and raises privacy concerns.
Scalable and Generalizable Approach: While we
have applied our gamified visualization approach to
a concrete use case with data that could have proba-
bly been easily obtained by a common internet user,
the range of possible application use cases is wide.
While the presented game NetVisGame is designed
to be played foremost to grab users’ initial attention
for the topic in general, the approach can also be ap-
plied for specific security awareness and literacy cam-
paigns, or long-term learning.
Stronger Expert Knowledge in Ccybersecurity:
With the presented approach we mainly cover the aim
to increase the awareness of users that their internet
activity is not necessarily invisible and can be tracked,
visualized and analyzed. We see this as a crucial step
for more deliberate and informed interaction with the
Internet. However, to satisfy the actual users’ need to
have explicit answers on how to increase their secu-
rity, more expert knowledge should be integrated.
In this paper, we have presented the concept of ap-
plying information visualization and game design to
real-world personal data related to cybersecurity with
the goal to increase users’ awareness of cybersecu-
rity. We have described a user study (n=41) that we
have used to derive the requirements for our imple-
mentation as well as the three personas. We have pre-
sented our implemented prototype NetVisGame and
selected promising evaluation results (n=7). We ar-
gue, that this approach is applicable to a wide range
IVAPP 2022 - 13th International Conference on Information Visualization Theory and Applications
136

of use cases and data and can even be extended to pro-
vide deeper IT knowledge than the current work.
ACKNOWLEDGEMENTS
This research work has been funded by the German
Federal Ministry of Education and Research and the
Hessian Ministry of Higher Education, Research, Sci-
ence and the Arts within their joint support of the
National Research Center for Applied Cybersecurity
ATHENE.
REFERENCES
Abawajy, J. (2014). User preference of cyber security
awareness delivery methods. Behaviour & Informa-
tion Technology, 33(3):237–248.
Alotaibi, F., Furnell, S., Stengel, I., and Papadaki, M.
(2016). A review of using gaming technology
for cyber-security awareness. Int. J. Inf. Secur.
Res.(IJISR), 6(2):660–666.
Arendt, D., Best, D., Burtner, R., and Paul, C. L. (2016).
Cyberpetri at cdx 2016: Real-time network situation
awareness. In 2016 IEEE Symposium on Visualization
for Cyber Security (VizSec), pages 1–4. IEEE.
Arendt, D. L., Burtner, R., Best, D. M., Bos, N. D., Gersh,
J. R., Piatko, C. D., and Paul, C. L. (2015). Ocelot:
user-centered design of a decision support visualiza-
tion for network quarantine. In 2015 IEEE Symposium
on Visualization for Cyber Security (VizSec), pages 1–
8. IEEE.
Bada, M., Sasse, A. M., and Nurse, J. R. (2019). Cyber
security awareness campaigns: Why do they fail to
change behaviour? arXiv preprint arXiv:1901.02672.
Barbosa, N. M., Zhang, Z., and Wang, Y. (2020). Do pri-
vacy and security matter to everyone? quantifying
and clustering user-centric considerations about smart
home device adoption. In Sixteenth Symposium on
Usable Privacy and Security ({SOUPS} 2020), pages
417–435.
Berengueres, J., Alsuwairi, F., Zaki, N., and Ng, T. (2013).
Gamification of a recycle bin with emoticons. In 2013
8th ACM/IEEE International Conference on Human-
Robot Interaction (HRI), pages 83–84. IEEE.
Bradley, N., Alvarez, M., Kuhn, J., and McMillen, D.
(2015). Ibm 2015 cyber security intelligence index.
Busse, K., Sch
¨
afer, J., and Smith, M. (2019). Replication:
no one can hack my mind revisiting a study on ex-
pert and non-expert security practices and advice. In
Fifteenth Symposium on Usable Privacy and Security
({SOUPS} 2019).
Card, S., Mackinlay, J., and Shneiderman, B. (2009). Infor-
mation visualization. Human-computer interaction:
Design issues, solutions, and applications, 181.
CIGI-Ipsos (2019). 2019 cigi-ipsos global survey on in-
ternet security and trust. https://www.cigionline.org/
internet-survey-2019. Accessed: 2021-02-25.
CJ, G., Pandit, S., Vaddepalli, S., Tupsamudre, H., Ba-
nahatti, V., and Lodha, S. (2018). Phishy-a seri-
ous game to train enterprise users on phishing aware-
ness. In Proceedings of the 2018 annual symposium
on computer-human interaction in play companion ex-
tended abstracts, pages 169–181.
Cobb, C., Surbatovich, M., Kawakami, A., Sharif, M.,
Bauer, L., Das, A., and Jia, L. (2020). How risky
are real users’{IFTTT} applets? In Sixteenth Sym-
posium on Usable Privacy and Security ({SOUPS}
2020), pages 505–529.
Denning, T., Lerner, A., Shostack, A., and Kohno, T.
(2013). Control-alt-hack: the design and evaluation
of a card game for computer security awareness and
education. In Proceedings of the 2013 ACM SIGSAC
conference on Computer & communications security,
pages 915–928.
Deterding, S., Dixon, D., Khaled, R., and Nacke, L. (2011).
From game design elements to gamefulness: defin-
ing” gamification”. In Proceedings of the 15th inter-
national academic MindTrek conference: Envisioning
future media environments, pages 9–15.
D
¨
orner, R., G
¨
obel, S., Effelsberg, W., and Wiemeyer, J.
(2016). Serious Games. Springer.
Dutz, T., Hardy, S., Kn
¨
oll, M., G
¨
obel, S., and Steinmetz,
R. (2014). User interfaces of mobile exergames. In
International Conference on Human-Computer Inter-
action, pages 244–255. Springer.
Feamster, N. (2010). Outsourcing home network security.
In Proceedings of the 2010 ACM SIGCOMM work-
shop on Home networks, pages 37–42.
Furman, S., Theofanos, M. F., Choong, Y.-Y., and Stanton,
B. (2011). Basing cybersecurity training on user per-
ceptions. IEEE Security & Privacy, 10(2):40–49.
Furnell, S. M., Bryant, P., and Phippen, A. D. (2007). As-
sessing the security perceptions of personal internet
users. Computers & Security, 26(5):410–417.
Ghafir, I., Prenosil, V., Svoboda, J., and Hammoudeh, M.
(2016). A survey on network security monitoring sys-
tems. In 2016 IEEE 4th International Conference on
Future Internet of Things and Cloud Workshops (Fi-
CloudW), pages 77–82. IEEE.
Giannakas, F., Kambourakis, G., and Gritzalis, S. (2015).
Cyberaware: A mobile game-based app for cyber-
security education and awareness. In 2015 Interna-
tional Conference on Interactive Mobile Communica-
tion Technologies and Learning (IMCL), pages 54–58.
IEEE.
Goble, D. J., Cone, B. L., and Fling, B. W. (2014). Using the
wii fit as a tool for balance assessment and neuroreha-
bilitation: the first half decade of “wii-search”. Jour-
nal of neuroengineering and rehabilitation, 11(1):1–
9.
Guerra, J. L., Veas, E., and Catania, C. A. (2019). A study
on labeling network hostile behavior with intelligent
interactive tools. In 2019 IEEE Symposium on Visual-
ization for Cyber Security (VizSec), pages 1–10. IEEE.
Hassenzahl, M. (2010). Experience design: Technology for
all the right reasons. Synthesis lectures on human-
centered informatics, 3(1):1–95.
Hassenzahl, M., Burmester, M., and Koller, F.
(2003). Attrakdiff: Ein fragebogen zur messung
NetVisGame: Mobile Gamified Information Visualization of Home Network Traffic Data
137

wahrgenommener hedonischer und pragmatischer
qualit
¨
at. In Mensch & computer 2003, pages 187–196.
Springer.
Hendrix, M., Al-Sherbaz, A., and Bloom, V. (2016). Game
based cyber security training: are serious games suit-
able for cyber security training? International Journal
of Serious Games, 3(1).
Huang, D., Tory, M., Aseniero, B. A., Bartram, L., Bate-
man, S., Carpendale, S., Tang, A., and Woodbury, R.
(2014). Personal visualization and personal visual an-
alytics. IEEE Transactions on Visualization and Com-
puter Graphics, 21(3):420–433.
ISO 9241-210 (2010). Iso 9241-210: Ergonomics of
human-system interaction –part 210: Human-centred
design for interactive systems.
Jayakrishnan, G. C., Sirigireddy, G. R., Vaddepalli, S., Ba-
nahatti, V., Lodha, S. P., and Pandit, S. S. (2020). Pass-
world: A serious game to promote password aware-
ness and diversity in an enterprise. In Sixteenth Sym-
posium on Usable Privacy and Security ({SOUPS}
2020), pages 1–18.
Krokos, E., Rowden, A., Whitley, K., and Varshney, A.
(2018). Visual analytics for root dns data. In 2018
IEEE Symposium on Visualization for Cyber Security
(VizSec), pages 1–8. IEEE Computer Society.
Kultima, A. (2009). Casual game design values. In Pro-
ceedings of the 13th international MindTrek confer-
ence: Everyday life in the ubiquitous era, pages 58–
65.
Lebek, B., Uffen, J., Neumann, M., Hohler, B., and Bre-
itner, M. H. (2014). Information security awareness
and behavior: a theory-based literature review. Man-
agement Research Review.
Legg, P. A. (2016). Enhancing cyber situation awareness for
non-expert users using visual analytics. In 2016 Inter-
national Conference On Cyber Situational Awareness,
Data Analytics And Assessment (CyberSA), pages 1–
8. IEEE.
Miksch, S. and Aigner, W. (2014). A matter of time: Ap-
plying a data–users–tasks design triangle to visual an-
alytics of time-oriented data. Computers & Graphics,
38:286–290.
Ndatinya, V., Xiao, Z., Manepalli, V. R., Meng, K., and
Xiao, Y. (2015). Network forensics analysis using
wireshark. International Journal of Security and Net-
works, 10(2):91–106.
Nealen, A., Saltsman, A., and Boxerman, E. (2011). To-
wards minimalist game design. In Proceedings of the
6th International Conference on Foundations of Digi-
tal Games, pages 38–45.
Nthala, N. and Flechais, I. (2018). Informal support net-
works: an investigation into home data security prac-
tices. In Fourteenth Symposium on Usable Privacy
and Security ({SOUPS} 2018), pages 63–82.
Saket, B., Simonetto, P., Kobourov, S., and B
¨
orner, K.
(2014). Node, node-link, and node-link-group dia-
grams: An evaluation. IEEE Transactions on Visual-
ization and Computer Graphics, 20(12):2231–2240.
Schell, J. (2008). The art of game design: A book of lenses.
2008. Burlington, MA: Elsevier.
Schufrin, M., Sessler, D., Reynolds, S. L., Ahmad, S.,
Mertz, T., and Kohlhammer, J. (2020). Information
visualization interface on home router traffic data for
laypersons. In Proceedings of the International Con-
ference on Advanced Visual Interfaces, pages 1–3.
Schufrin, M., Ulmer, A., Sessler, D., and Kohlhammer,
J. (2018). Towards bridging the gap between visual
cybersecurity analytics and non-experts by means of
user experience design. In 2019 IEEE Symposium on
Visualization for Cyber Security (VizSec).
Schweitzer, D. and Brown, W. (2009). Using visualization
to teach security. Journal of Computing Sciences in
Colleges, 24(5):143–150.
Seitz, T. and Hussmann, H. (2017). Pasdjo: quantifying
password strength perceptions with an online game.
In Proceedings of the 29th Australian Conference on
Computer-Human Interaction, pages 117–125.
Sheng, S., Magnien, B., Kumaraguru, P., Acquisti, A., Cra-
nor, L. F., Hong, J., and Nunge, E. (2007). Anti-
phishing phil: the design and evaluation of a game that
teaches people not to fall for phish. In Proceedings of
the 3rd symposium on Usable privacy and security,
pages 88–99.
Shiravi, H., Shiravi, A., and Ghorbani, A. A. (2011). A
survey of visualization systems for network secu-
rity. IEEE Transactions on visualization and computer
graphics, 18(8):1313–1329.
Sim
˜
oes, J., Redondo, R. D., and Vilas, A. F. (2013). A social
gamification framework for a k-6 learning platform.
Computers in Human Behavior, 29(2):345–353.
Susi, T., Johannesson, M., and Backlund, P. (2007). Serious
games: An overview.
Thompson, M. and Irvine, C. (2011). Active learning with
the cyberciege video game.
Tupsamudre, H., Wasnik, R., Biswas, S., Pandit, S., Vad-
depalli, S., Shinde, A., Gokul, C., Banahatti, V., and
Lodha, S. (2018). Gap: A game for improving aware-
ness about passwords. In Joint International Confer-
ence on Serious Games, pages 66–78. Springer.
Ulmer, A., Schufrin, M., L
¨
ucke-Tieke, H., Kannanayikkal,
C. D., and Kohlhammer, J. (2018). Towards visual
cyber security analytics for the masses. In EuroVA@
EuroVis, pages 55–59.
Ulmer, A., Sessler, D., and Kohlhammer, J. (2019). Net-
capvis: Web-based progressive visual analytics for
network packet captures. In 2019 IEEE Symposium
on Visualization for Cyber Security (VizSec), pages 1–
10. IEEE.
IVAPP 2022 - 13th International Conference on Information Visualization Theory and Applications
138
