
Noise in Datasets: What Are the Impacts on Classification Performance?
Rashida Hasan
a
and Cheehung Henry Chu
b
Center for Advanced Computer Studies, University of Louisiana at Lafayette, Lafayette, Louisiana, U.S.A.
Keywords:
Machine Learning, Classifiers, Learning From Noisy Data, Class Noise, Attribute Noise.
Abstract:
Classification is one of the fundamental tasks in machine learning. The quality of data is important in con-
structing any machine learning model with good prediction performance. Real-world data often suffer from
noise which is usually referred to as errors, irregularities, and corruptions in a dataset. However, we have no
control over the quality of data used in classification tasks. The presence of noise in a dataset poses three major
negative consequences, viz. (i) a decrease in the classification accuracy (ii) an increase in the complexity of
the induced classifier (iii) an increase in the training time. Therefore, it is important to systematically explore
the effects of noise in classification performance. Even though there have been published studies on the effect
of noise either for some particular learner or for some particular noise type, there is a lack of study where the
impact of different noise on different learners has been investigated. In this work, we focus on both scenar-
ios: various learners and various noise types and provide a detailed analysis of their effects on the prediction
performance. We use five different classifiers (J48, Naive Bayes, Support Vector Machine, k-Nearest Neigh-
bor, Random Forest) and 10 benchmark datasets from the UCI machine learning repository and three publicly
available image datasets. Our results can be used to guide the development of noise handling mechanisms.
1 INTRODUCTION
In machine learning, classification is a supervised
learning approach in which the model learns from the
data given to it and makes new observations or pre-
dicts the class. The maximum prediction accuracy of
a classifier depends on two factors (i) quality of the
training data and (ii) the inductive bias of the algo-
rithm(Zhu and Wu, 2004). But real-world datasets are
not perfect and may suffer from noise. It is referred
to as meaningless, erroneous, or corrupted data in a
dataset.
In the data collection process, issues such as mea-
surement errors, incomplete, corrupted, wrong, or
distorted examples may be introduced (Libralon et al.,
2009). This may result in errors in the values of the
attributes or the class label(Nettleton et al., 2010).
Noisy data may bias the learning process and make
it difficult for the learner to build accurate models.
Over the last few years, many algorithms have been
developed to learn from noisy environments (Nazari
et al., 2018). But the existence of noise can still in-
troduce negative impacts. Therefore, it is important
to develop some data preprocessing mechanisms that
a
https://orcid.org/0000-0002-6231-8116
b
https://orcid.org/0000-0002-5817-8798
can effectively and efficiently deal with these types
of data. In order to deal with real-world datasets,
the algorithm requires an existing preprocessing mod-
ule that will determine the impact of noise. Unfortu-
nately, very few works have been conducted to inves-
tigate the impact of noise. This work investigates the
impact of various noise types on different classifiers.
Our aims are to extract information about the effect
of different types and degrees of noise on these clas-
sifiers by systematically evaluating the effects of dif-
ferent types and degrees of noise in different learning
paradigms. Our study investigates (i) is the perfor-
mance of a classifier is hampered by noise? (ii) what
is the impact of noise on the classifier if the training
dataset is large enough? (iii) is there any robust clas-
sifier for noisy environments? (iv) class noise vs at-
tribute noise: which one is more detrimental to the
classification performance?
We aim at studying the performance of five classi-
fiers including J48, Naive-Bayes (NB), Support Vec-
tor Machine (SVM), k Nearest Neighbor (k-NN), and
Random Forest (RF). In our experiments, we em-
ploy linear classifiers as well as non-linear classifiers.
Firstly, random class noise with different degrees is
analyzed. Then we analyze the impact of attribute
noise. Our work also aims to find a robust classifier
Hasan, R. and Chu, C.
Noise in Datasets: What Are the Impacts on Classification Performance?.
DOI: 10.5220/0010782200003122
In Proceedings of the 11th International Conference on Pattern Recognition Applications and Methods (ICPRAM 2022), pages 163-170
ISBN: 978-989-758-549-4; ISSN: 2184-4313
Copyright
c
2022 by SCITEPRESS – Science and Technology Publications, Lda. All rights reserved
163

that is less sensitive to noise. One of the key attrac-
tions is that we take into account different characteris-
tics of the dataset to provide a broader aspect of noise
impacts. The results enable us to highlight the strong
and weak classifiers in the presence of noise.
The rest of the paper is organized as follows. Sec-
tion 2 discusses the related work. In Section 3, we
differentiate between class and attribute noise as well
as present our noise injection methodology. Section 4
reports the experimental results. Finally, we conclude
the paper in Section 5.
2 RELATED WORK
Our work as described in Section 1 is motivated by
the observation that while previous work have fo-
cused on the effect of class noise (Zhu and Wu, 2004),
(Nazari et al., 2018), (Pelletier et al., 2017), (Al-
gan and Ulusoy, 2020), there is limited attention to
the impact of attribute noise in a dataset. The main
limitation of some of these approaches is that they
conducted experiments only for specific applications
such as land cover mapping dataset (Nazari et al.,
2018) or image dataset(Algan and Ulusoy, 2020). In
the few studies that include different datasets, they
consider only attribute noise (Nettleton et al., 2010),
(da Costa et al., 2016), (Rolnick et al., 2017), (Saseen-
dran et al., 2019). Little has been done to measure
the impact of both types of noise such as attribute
noise and class noise. Few works investigated the im-
pact of both types of noises but for a specific learner
(Zhu and Wu, 2004). The comparisons of the effect
of noise on different learning paradigms have been
neglected (Nazari et al., 2018), (Algan and Ulusoy,
2020), (da Costa et al., 2016), (Saseendran et al.,
2019).
Few studies have reported the sensitivity of ma-
chine learning algorithms against noise. Most exist-
ing algorithms aim to learn directly from noisy data
(Rolnick et al., 2017). Zhu and Wu (Zhu and Wu,
2004) showed that with an increase in the attribute
noise, the accuracy of the classifier decreases linearly.
They also demonstrated that eliminating instances
containing class noise will likely enhance classifica-
tion performance. However, their experiments were
limited to a specific learner such as C4.5. Nettleton et
al (Nettleton et al., 2010) also pointed out the impact
of class noise and attribute noise. Their experimental
results suggest that NB was more robust to noisy data
and SVM was the weakest one. The drawback of their
study is that they consider only binary classes. Even
if the dataset contained multi-class, they transformed
them into 2-class data sets. This could prevent the
learners from truly uncovering the impact of noise.
We note that some other papers analyze how class
noise can hamper the performance of some state-of-
the-art classification models. Their results showed
that classification performance is directly hampered
in the presence of class noise (Zhu and Wu, 2004),
(Nazari et al., 2018), (Pelletier et al., 2017), (Kala-
panidas et al., 2003). Nevertheless their experiments
did not include the impact of attribute noise. More-
over, they only focus on specific datasets such as im-
age datasets, and land cover mapping datasets (Nazari
et al., 2018), (da Costa et al., 2016).
3 METHODOLOGY
The quality of a dataset can be characterized by its
attributes and class labels (Nazari et al., 2018). This
section discusses two categories of noise and a brief
discussion about the classifiers we used in our exper-
iments.
3.1 Class Noise
Class noise is known as labeling errors when an in-
stance is incorrectly labeled. There are several causes
for class noise such as subjectivity during the labeling
process, data entry errors, or inadequacy of the infor-
mation used to label each example. There are two
types of class noise:
• Contradictory examples: Some examples appear
more than once with different class labels.
• Misclassifications: Some examples are labeled in-
correctly.
3.2 Attribute Noise
Attribute noise refers to corruption in the value of one
or more attributes. There are three types of attribute
noise:
• Erroneous attribute: The attribute with a wrong
value
• Missing attribute values: The value of an attribute
is unknown. Generally, it is represented as a “?”
sign.
• Don’t care values: The value of the attribute does
not affect the rest of the values in the example
3.3 Noise Injection
In the following we describe how we introduce noise
in class labels and attributes. It is difficult to have real-
datasets where attribute and class noise are clearly
ICPRAM 2022 - 11th International Conference on Pattern Recognition Applications and Methods
164

Table 1: UCI Dataset Characteristics.
Dataset Instances Attributes Class Missing values Dataset characteristics Attribute characteristics Balanced?
Credit card 690 15 2 37 Multivariate Categorical, Integer, Real No
Iris 150 4 3 None Multivariate Real Yes
Spect 267 22 2 None Multivariate Categorical No
Glass 214 10 7 None Multivariate Real No
Wdbc 569 32 2 None Multivariate Real No
Wine 178 13 3 None Multivariate Integer,Real No
Dermatology 366 33 6 8 Multivariate Categorical, Integer No
Ecoli 336 8 8 None Multivariate Real No
Segmentation 2310 19 7 None Multivariate Real Yes
Yeast 1484 8 10 None Multivariate Real No
identified (Pelletier et al., 2017). To overcome such
limitations, we inject artificial noise into our datasets.
3.3.1 Attribute Noise Injection
We generate the attribute noise in the training data set
using Gaussian noise. Therefore, the values that the
noise can take on are Gaussian distributed. The prob-
ability density function of a Gaussian random variable
ζ is given by
p(ζ) =
1
σ
√
2π
e
−(ζ−µ)
2
.
2σ
2
(1)
where µ is the mean of the distribution and σ is the
standard deviation.
3.3.2 Class Noise Injection
We followed the random noise model for class noise
injection. The percentage of noisy levels varies from
10% to 50%, with an interval of 10%. The class label
is changed from its current value to one of the other
possibly one, randomly. For instance, if there are 300
examples in a dataset, then adding a noise level of
10% implies that 30 labels will change randomly.
3.4 Choice of Classifiers
In the literature, there is a lack of work to analyze
the impact of noise on different types of classifiers.
Therefore, we select five classifiers for our experi-
ments. We divide our selected classifiers into two cat-
egories (i) Linear classifiers: NB and SVM, and (ii)
Non-linear classifiers: J48, RF, and k-NN.
The rationale for choosing the classifiers based on
their characteristics are three-fold: (i) Firstly, J48, k-
NN, and RF are non-linear classifiers that are useful
for problems that are linearly non-separable; i.e., the
class boundaries cannot be approximated well with
a planar surface. These boundaries can suffer from
overfitting. While there are methods such as prun-
ing in decision trees designed to reduce the chance
that the trees are overfitting (Quinlan, 2014), a nat-
ural question is how sensitive they are to noise in
data. Secondly, NB is a linear model for classifica-
tion which leads to a linear decision boundary that
has been found effective in many problem domains.
Thirdly, each classifier has its own inherent noise han-
dling mechanism. It allows us a better understanding
of the results of the impact of noise on them. For ex-
ample, the NB algorithm assumes each attribute is in-
dependent of each other. This could provide an added
advantage when noise is introduced to the dataset.
SVM when used to find a linear boundary in the fea-
ture space (such as by using a polynomial kernel with
degree 1) can be considered to optimize the boundary
to be equally distant from the closest points of either
class. A comparison of NB with the linear SVM can
reveal whether the optimized boundary of the SVM
improves the handling of noise.
4 EXPERIMENTS AND RESULTS
A study on either class noise or attribute noise alone
cannot provide enough information about classifier
behaviors against noise. Accordingly, a study of dif-
ferent types of noise on different learners is required
to achieve a meaningful conclusion while evaluating
classifier behavior in noisy environments. Keeping
this in mind, we conduct our experiments (i) in pres-
ence of class noise and attribute noise (ii) use differ-
ent classifiers (iii) large training datasets (iv) different
characteristics of datasets. Our results provide an in-
sightful view of classification performance in noisy
environments. In the following, we describe the main
aspects of the experimental results of this study.
4.1 Datasets
The experiments carried out in this paper are based
on 13 datasets of which 10 datasets are collected from
the UCI machine learning repository (Dua and Graff,
2017) and 3 publicly available image datasets. Table 1
summarizes the dataset characteristics from UCI and
Table 2 presents the details of the image datasets.
Noise in Datasets: What Are the Impacts on Classification Performance?
165

The reason for choosing different datasets is to
investigate if the classification performance is ham-
pered by the characteristics of the dataset. For in-
stance, missing values in a dataset are a common form
of attribute noise. Therefore, we deliberately choose
some datasets with missing values. It would be worth
experimenting to see how classifiers behave in such
a scenario. In addition, we focus on imbalanced data
sets. In such data sets, the distribution can vary from a
slight bias to a severe imbalance where there could be
one example in the minority class for hundreds, thou-
sands, or millions of examples in the majority of the
class or classes. For instance, the class distribution of
the wdbc data set is 62.74% for the positive class and
37.26% for the negative class. In imbalanced data,
the minority class is more sensitive than the majority
class. Therefore, we include both balanced and imbal-
anced datasets in our experiments. Fig. 1 illustrates
the class distribution for each UCI dataset included in
our experiments.
We also include large training datasets such as
CIFAR-10, MNIST, and Fashion-MNIST. As an ex-
ample, the training data for CIFAR-10 is 60,000.
Table 2: Characteristics of Image Datasets.
Dataset Training set Testing set class Balanced?
MNIST 60000 10000 10 No
Fashion-MNIST 60000 10000 10 Yes
CIFAR-10 50000 10000 10 Yes
4.2 Experimental Setup
In our experimental setup, we divide the UCI datasets
into three categories:
• Balanced dataset: Each class has equal distribu-
tion (iris, and segmentation dataset)
• Slightly balanced dataset: The distribution of
classes is uneven by a small amount. In our set-
ting, if the majority class to minority class ratio is
between 1:1 to 1:69, we define it as a slightly im-
balanced dataset (credit card, spect, glass, wdbc,
wine, and dermatology dataset)
• Highly imbalanced dataset: The distribution of
classes is uneven by a large amount. In our set-
ting, if the majority class to minority class ratio is
greater than 1:70, we define it as a highly imbal-
anced dataset (ecoli, and yeast dataset)
To evaluate the performance of noise on classifica-
tion performance, we use 2 different evaluation met-
rics :
• AUROC: The AUROC computes the area under
the ROC curve. The ROC curve plots the true pos-
itive rate vs false positive rate at various threshold
settings. In our experiments, we use AUROC for
balanced and slightly imbalanced datasets. This is
because the AUROC gives the same result regard-
less of what the class probabilities are.
• AUPRC: AUPRC is defined as the average of pre-
cision scores calculated for each recall threshold.
We use AUPRC for highly imbalanced datasets as
it focuses mainly on the positive class.
In the case of image datasets, we use the loss func-
tion to evaluate the performance of the deep neural
network. The loss function we use in our experiments
is categorical cross-entropy.
We split our dataset into training and test sets. To
preserve the percentage of samples for each class, we
use a variation of K-fold named stratified K-fold. The
value for K is set to 10 because the low values of K
will result in a noisy estimate of model performance
and a very large value will result in a less noisy esti-
mate of model performance.
When simulating class noise, the training dataset
is corrupted with varying degrees of noise while keep-
ing the test dataset clean. It allows us to evaluate the
true performance of the classifier. In the case of class
noise, random noises are injected with rates of 10%,
20%, 30%, 40%, and 50%. We restrict our noise level
up to 50% of the original dataset because in realistic
situations only certain types of classes are likely to
be mislabeled. For attribute noise, we use Gaussian
noise with zero mean and 2 different variance values
of 0.5 and 0.7. In image datasets, we vary the value
of variance from 0.1 to 0.9. The reason is that with a
small variance a noisy image can still have good per-
formance and the distortion level will be minimum.
Hence, we want to observe the performance with dif-
ferent variances of noise. For image datasets, we cor-
rupted the training data with Gaussian noise and eval-
uated it with test data.
For class noise evaluation, we use the Weka tool
(Eibe et al., 2016). It is a free software tool for data
mining tasks. In the case of attribute noise evalua-
tion, we implemented the noise injection model and
the classifiers in Python 3.5. The parameter settings
for five classifiers are as follows: J48 (confidence
factor C=0.25), NB (bacthSzie=100, useKernelEsti-
mator=False), SVM (kernel: polynomial kernel with
degree 1, tolerance parameter=0.001), k-NN (k=1,
distance: euclidean distance) and RF (bagSizePer-
cent=100, maxDepth=0, numIterations=100). All the
experiments were run on Mac OS Big Sur with a 3.1
GHz CPU and 8GB memory.
ICPRAM 2022 - 11th International Conference on Pattern Recognition Applications and Methods
166
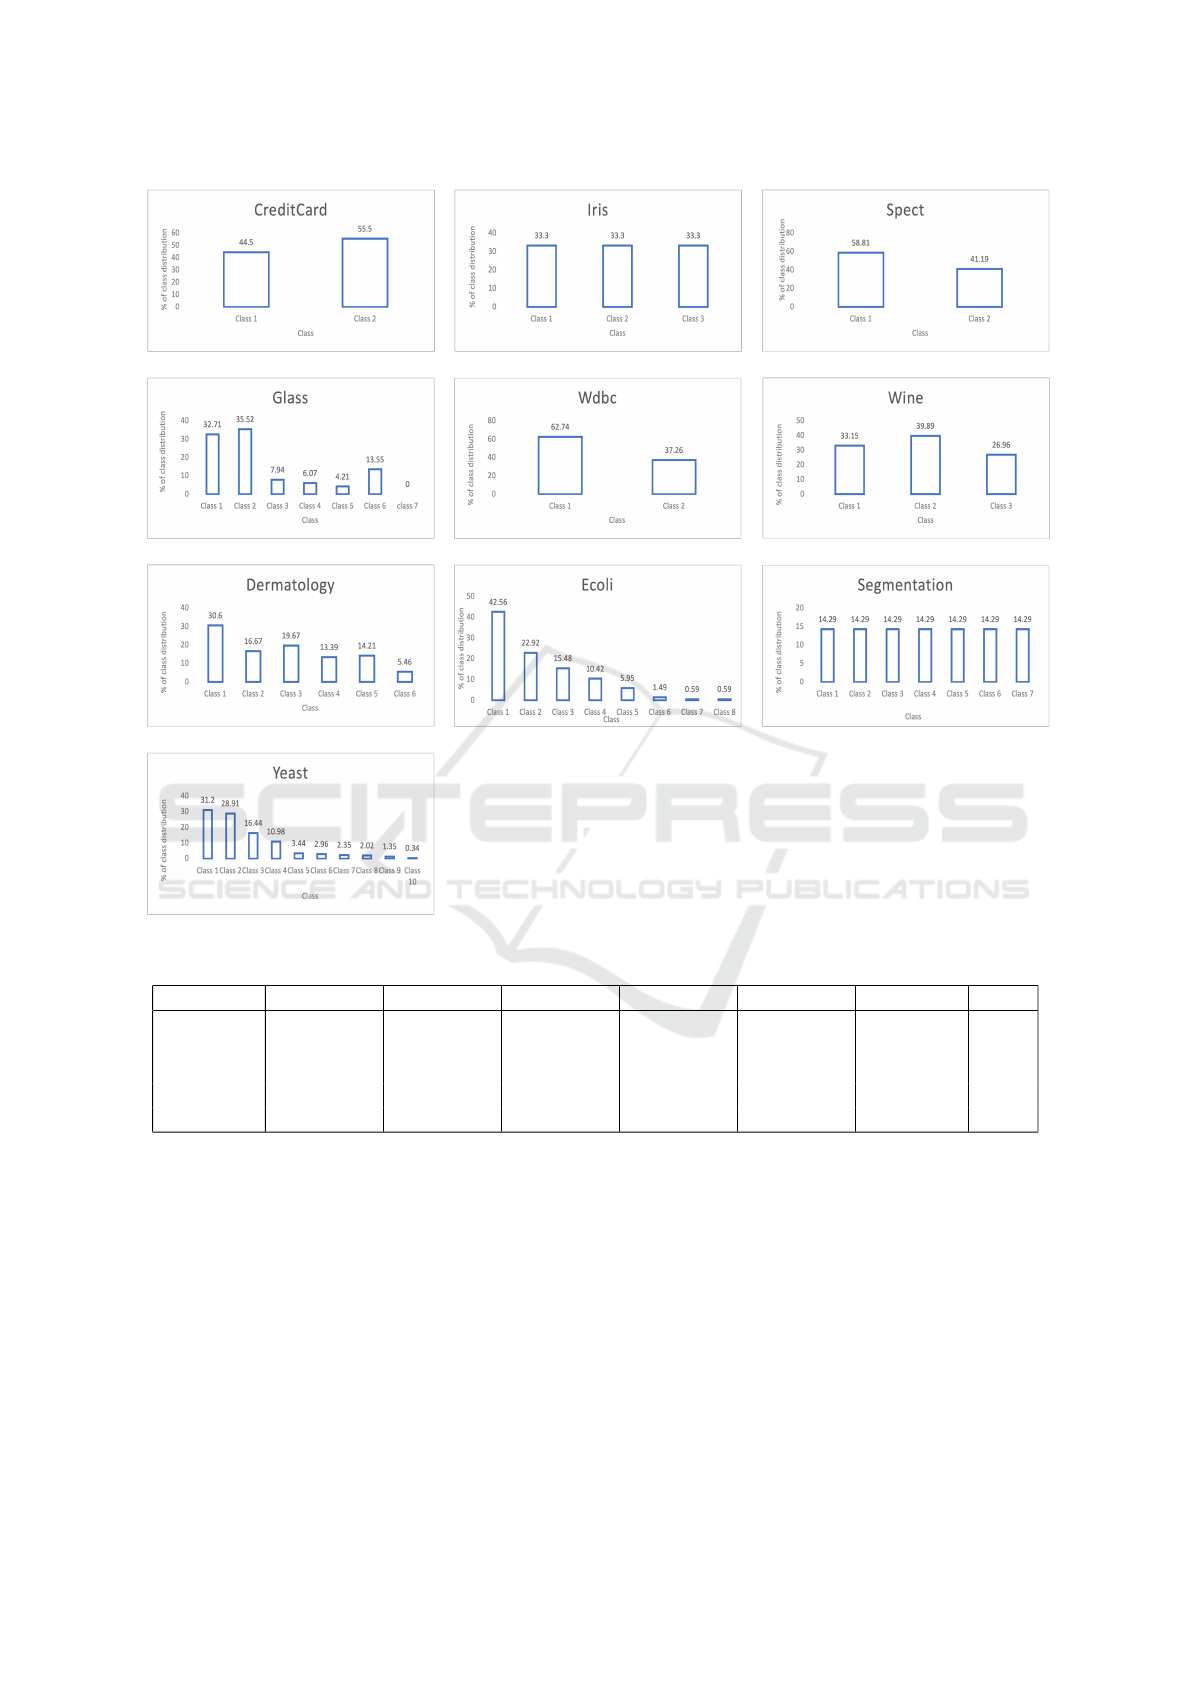
Figure 1: Class Distribution of UCI Datasets.
Table 3: Rank of Classifiers.
Classifiers 10% Noise 20% Noise 30% Noise 40% Noise 50% Noise Avg Score Rank
J48 0.74 0.66 0.56 0.50 0.46 0.58 4
NB 0.79 0.71 0.64 0.57 0.50 0.64 2
SVM 0.76 0.68 0.61 0.54 0.49 0.61 3
K-NN 0.70 0.61 0.54 0.49 0.45 0.56 5
RF 0.81 0.73 0.64 0.57 0.51 0.65 1
4.3 Results
We evaluated our experimental results in presence of
attribute noise and class noise. For each type of noise,
we use the same five classifiers. The following sub-
section presents the results of various experiments.
4.3.1 Effects of Class Noise
In our first analysis, we compare the performance of
different classifiers in the presence of varying degrees
of class noise. We use the same classifiers for each
of the settings. The datasets used in this setting are
from the UCI repository. They have been testified
to be appropriate in many algorithms in the litera-
ture(Libralon et al., 2009). The typical assumption is
that these datasets are clean and noise-free(Libralon
et al., 2009). But there are missing values in these
datasets. In our experiments, we replace all miss-
ing values for nominal and numeric attributes in a
dataset with the modes and means from the training
data. Firstly, we train and test each dataset using our
selected five classifiers. Then we gradually increase
the noise level to test how these classifiers behave.
Noise in Datasets: What Are the Impacts on Classification Performance?
167
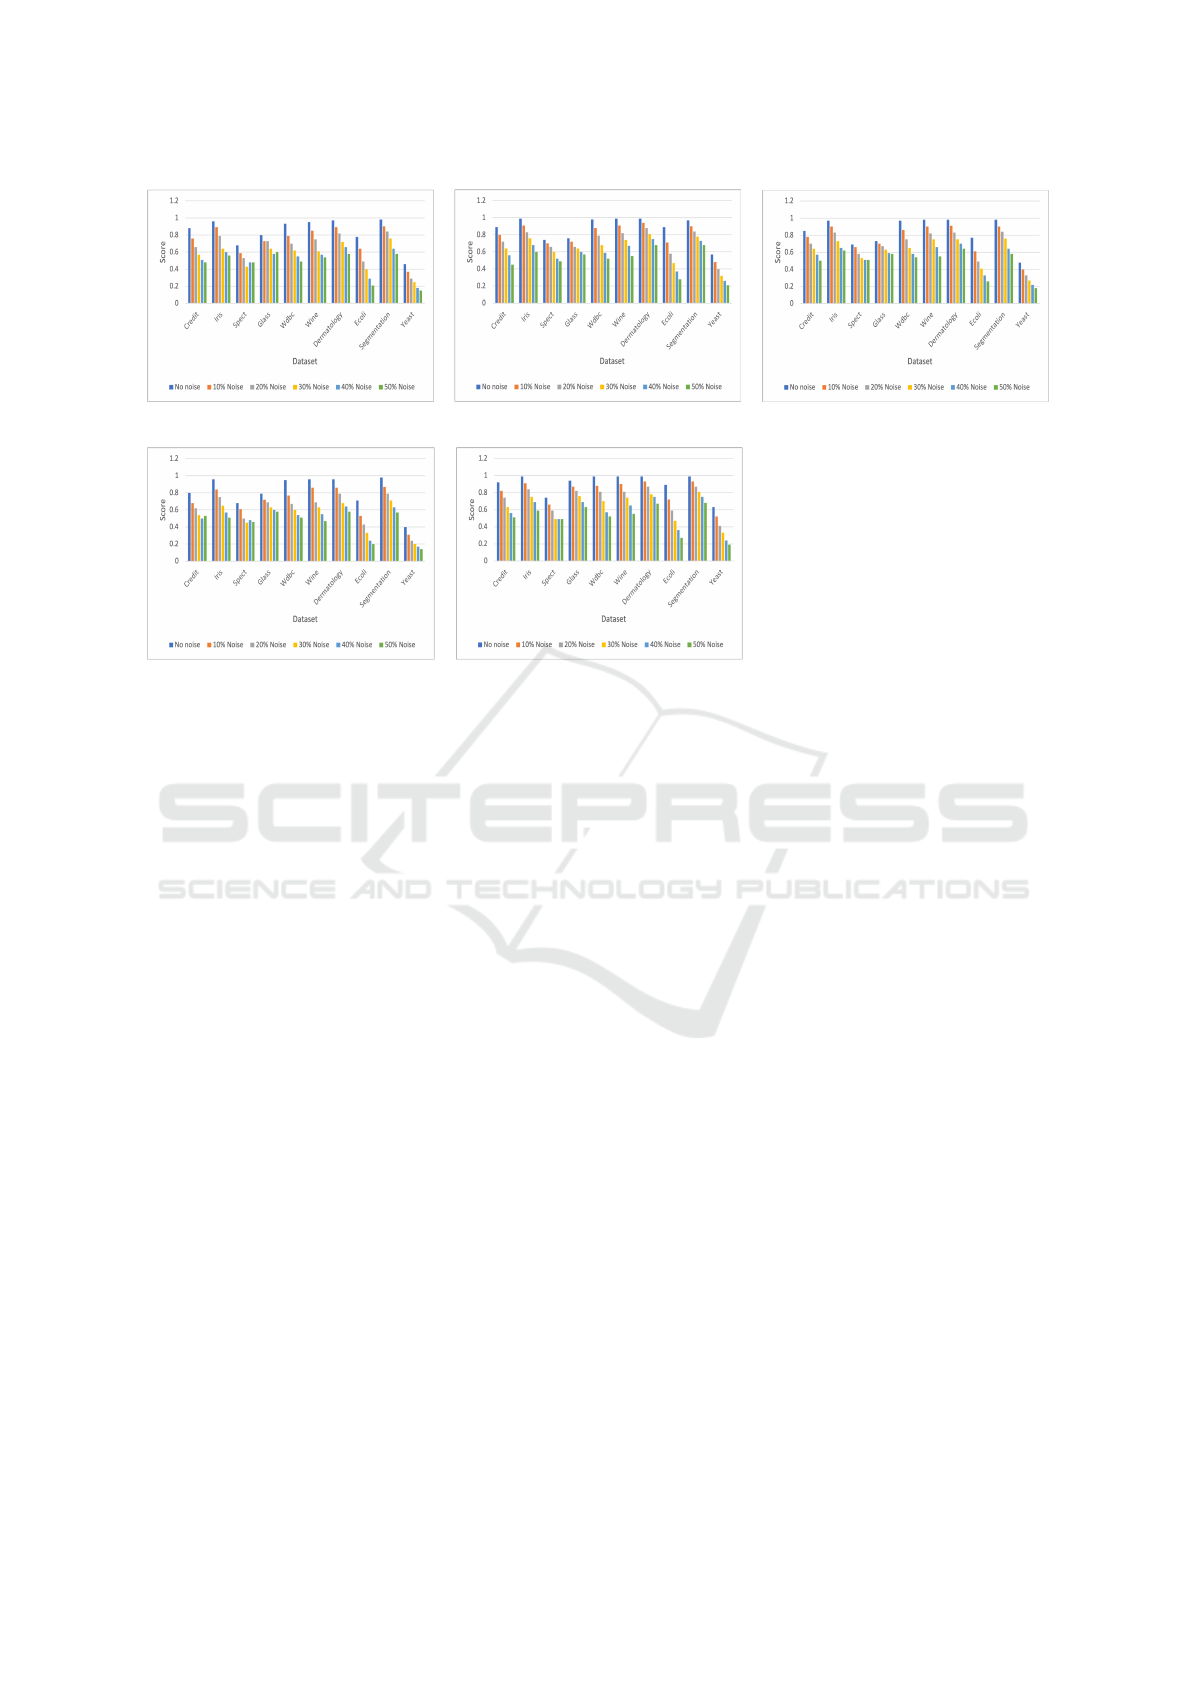
(a) J48 (b) NB (c) SVM
(d) K-NN (e) RF
Figure 2: Effects of class noise on different classifiers. The y axis represents the AUROC score except for Ecoli and Yeast.
AUPRC score is reported for Ecoli and Yeast dataset. Six color bar represents the prediction accuracy when six different noise
labels are applied for each dataset.
Fig. 2 shows the classification results obtained by
J48, NB, SVM, k-NN, and RF. As can be seen from
the figures, the classification performance drops sig-
nificantly with an increase in noise. We observed that
this statement is true for all classifiers in spite of the
classifiers’ inherent noise handling mechanisms. One
key observation is that: when analyzing the situa-
tion with high levels of noise, the classifiers fail to
learn from the data and make the classification task
difficult. For example, when the degree of noise is
50%, we see a significant drop in the prediction per-
formance. The score is below 60% for almost all of
the datasets. However, this is expected behavior since
it is harder to classify the data due to high levels of
noise. However, from Fig. 2, it is also clear that even
in the presence of a little noise, the performance of
each classifier is hampered.
We also computed the average rank of each clas-
sifier. Firstly, we computed the average score of each
classifier. For instance, the average score of J48 clas-
sifier in different noise levels are 0.74(10% noise),
0.66(20% noise), 0.56(30% noise), 0.50(40% noise)
and 0.46(50% noise). We rank the learners accord-
ing to the prediction score. The highest value of
prediction score ranks first. With a reference to Ta-
ble 3, RF ranks first while the last rank belongs to
k-NN. It is important to notice that in the case of low
noise(10%), the rank remains the same but with a high
level of noise(50%) NB performs very well compared
to the other classifiers except RF. However, k-NN al-
ways demonstrates the worst performance in every
setting. Another important observation is that the per-
formance of linear classifiers (average score is 0.63)
is better than non-linear classifiers ( average score is
0.60)
4.3.2 Effects of Attribute Noise
To evaluate the impact of attribute noise, we use
the same datasets used for class noise evaluation.
The prediction score obtained without noise and with
noise are illustrated in Fig. 3. In presence of attribute
noise, on 7 out of 10 datasets, the prediction perfor-
mance degrades for each classifier. The exception
is for wine, dermatology, and segmentation dataset
when we use NB and RF classifier model. It is impor-
tant to note that the performance degrades very little
when we increase the variance from 0.5 to 0.7. We
also presented a ranking of classifiers in Table 4. We
followed the similar ranking procedure described in
the previous paragraph. The highest prediction score
comes from the classifier RF and the lowest from k-
NN. We also observe that the performance of linear
classifiers (average score is 0.74) is better than non-
linear classifiers (average score is 0.70).
ICPRAM 2022 - 11th International Conference on Pattern Recognition Applications and Methods
168
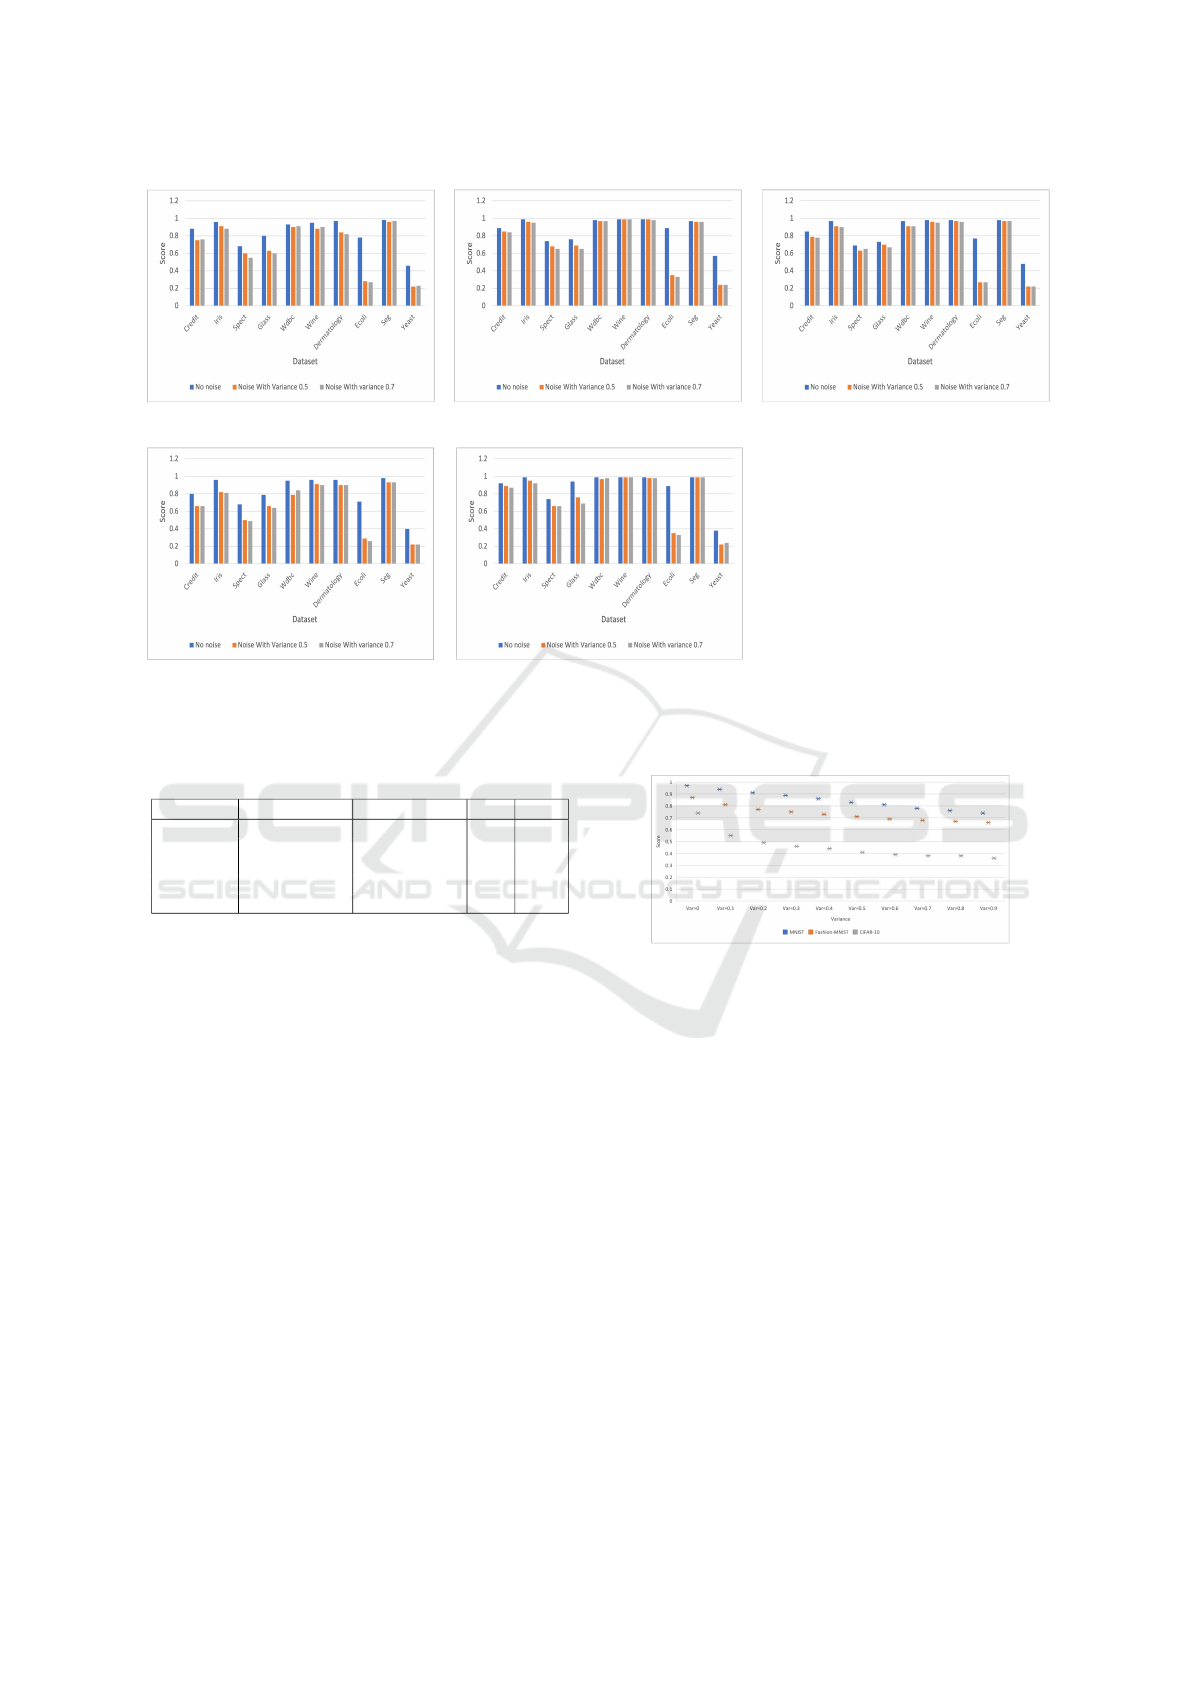
(a) J48 (b) NB (c) SVM
(d) K-NN (e) RF
Figure 3: Effects of attribute noise on different classifiers. The y axis represents the AUROC score except for Ecoli and Yeast.
AUPRC score is reported for Ecoli and Yeast dataset.
Table 4: Rank of Classifiers.
Classifiers Noise(σ
2
=0.5) Noise(σ
2
=0.7) Avg Rank
J48 0.69 0.68 0.69 4
NB 0.76 0.75 0.76 2
SVM 0.73 0.72 0.73 3
K-NN 0.66 0.66 0.66 5
RF 0.77 0.76 0.77 1
4.3.3 Effects of Noise in Deep Learning
We conduct another set of experiments to evaluate the
impacts of noise on deep neural networks for multi-
classification tasks. Deep neural networks are capa-
ble of generalizing from training data(Nazar
´
e et al.,
2017). So, our goal of this experiment is: can
deep neural networks still be able to generalize af-
ter training on noisy data? Fig. 4 demonstrates the
results obtained from three image datasets: MNIST,
Fashion-MNIST, and CIFAR-10. We inject Gaussian
noise in each of the datasets with a variance ranging
from 0.1 to 0.9. We use Convolution Neural Net-
work (CNN) with the following parameter settings:
(i) model: sequential (ii) activation function: relu, and
softmax (iii) loss function: categorical cross-entropy
and (iv)optimizer:adam. From Fig. 4, we can see that
the performance drops in case of low variance as well
as high variance. Therefore, we can conclude that
deep neural networks fail to generalize in presence of
noise.
Figure 4: Effect of noise on MNIST, Fashion-MNIST and
CIFAR-10 dataset.
4.3.4 Key Takeaways from Our Results
We observe some interesting facts from our results.
The key observations from our experiments are
• Class noise degrades the classification perfor-
mance
• The attribute noise is also harmful and could bring
severe problems to classifiers
• Class noise is more dangerous than attribute noise
• Random forest is more resilient to noise and k-NN
is the weakest one
• Linear classifiers are more tolerant to noise than
non-linear classifiers
• Deep neural network finds difficulty to generalize
after training on massively noisy data
Noise in Datasets: What Are the Impacts on Classification Performance?
169

5 CONCLUSIONS
This paper investigated the impacts of noise on var-
ious classifiers in various environment settings. We
analyzed how attribute noise and class noise affect the
quality of the models. The five well-known classifiers
including J48, NB, SVM, k-NN, SVM, and RF have
been compared with different noise levels. The gen-
eral results show that both types of noise have adverse
effects on each classifier. The simple observation is
that RF is the best learner and k-NN gives the worst
performance in a noisy environment. Another obser-
vation is that deep neural networks are not robust to
noise. Our experimental results may serve either as a
guideline for the selection of appropriate classifiers in
noisy environments or for developing noise handling
mechanisms.
ACKNOWLEDGMENTS
This work is supported by the U.S. National Science
Foundation under grant number OIA-1946231 and
the Louisiana Board of Regents for the Louisiana Ma-
terials Design Alliance (LAMDA).
REFERENCES
Algan, G. and Ulusoy, I. (2020). Label noise types
and their effects on deep learning. arXiv preprint
arXiv:2003.10471.
da Costa, G. B. P., Contato, W. A., Nazare, T. S., Neto, J. E.,
and Ponti, M. (2016). An empirical study on the ef-
fects of different types of noise in image classification
tasks. arXiv preprint arXiv:1609.02781.
Dua, D. and Graff, C. (2017). UCI machine learning repos-
itory. Accessed 10 September 2021.
Eibe, F., Hall, M. A., and Witten, I. H. (2016). The WEKA
workbench. Online appendix for data mining: practi-
cal machine learning tools and techniques. Morgan
Kaufmann.
Kalapanidas, E., Avouris, N., Craciun, M., and Neagu, D.
(2003). Machine learning algorithms: a study on noise
sensitivity. In Proc. 1st Balcan Conference in Infor-
matics, pages 356–365.
Libralon, G. L., de Leon Ferreira, A. C. P., Lorena, A. C.,
et al. (2009). Pre-processing for noise detection in
gene expression classification data. Journal of the
Brazilian Computer Society, 15(1):3–11.
Nazar
´
e, T. S., da Costa, G. B. P., Contato, W. A., and Ponti,
M. (2017). Deep convolutional neural networks and
noisy images. In Iberoamerican Congress on Pattern
Recognition, pages 416–424. Springer.
Nazari, Z., Nazari, M., Sayed, M., and Danish, S. (2018).
Evaluation of class noise impact on performance of
machine learning algorithms. IJCSNS Int. J. Comput.
Sci. Netw. Secur, 18:149.
Nettleton, D. F., Orriols-Puig, A., and Fornells, A. (2010).
A study of the effect of different types of noise on the
precision of supervised learning techniques. Artificial
intelligence review, 33(4):275–306.
Pelletier, C., Valero, S., Inglada, J., Champion, N.,
Marais Sicre, C., and Dedieu, G. (2017). Effect
of training class label noise on classification perfor-
mances for land cover mapping with satellite image
time series. Remote Sensing, 9(2):173.
Quinlan, J. R. (2014). C4. 5: programs for machine learn-
ing. Elsevier.
Rolnick, D., Veit, A., Belongie, S., and Shavit, N. (2017).
Deep learning is robust to massive label noise. arXiv
preprint arXiv:1705.10694.
Saseendran, A., Setia, L., Chhabria, V., Chakraborty,
D., and Barman Roy, A. (2019). Impact of
noise in dataset on machine learning algorithms.
10.13140/RG.2.2.25669.91369.
Zhu, X. and Wu, X. (2004). Class noise vs. attribute noise:
A quantitative study. Artificial intelligence review,
22(3):177–210.
ICPRAM 2022 - 11th International Conference on Pattern Recognition Applications and Methods
170
