
Using ConvNet for Classification Task in Parallel Coordinates
Visualization of Topologically Arranged Attribute Values
Piotr Artiemjew
1 a
and Sławomir K. Tadeja
2 b
1
Faculty of Mathematics and Computer Science, University of Warmia and Mazury in Olsztyn, Poland
2
Institute of Applied Computer Science, Jagiellonian University in Krak
´
ow, Poland
Keywords:
Classification, Parallel Coordinates, Convnet, Pattern Recognition.
Abstract:
In this work, we assess the classification capability of visualized multidimensional data used in the decision-
making process. We want to investigate if classification carried out over a graphical representation of the
tabular data allows for statistically greater efficiency than the dummy classifier method. To achieve this, we
have used a convolutional neural network (ConvNet) as the base classifier. As an input into this model, we used
data presented in the form of 2D curves resulting from the Parallel Coordinates Plot (PCP) visualization. Our
initial results show that the topological arrangement of attributes, i.e., the shape formed by the PCP curves
of individual data items, can serve as an effective classifier. Tests performed on three different real-world
datasets from the UCI Machine Learning Repository confirmed that classification efficiency is significantly
higher than in the case of dummy classification. The new method provides an interesting approach to the
classification of tabular data and offers a unique perspective on classification possibilities. In addition, we
examined relevant information content potentially helpful in building hybrid classification models, e.g., in the
classifier committee model. Moreover, our method can serve as an enhancement of the PCP visualization
itself. Here, we can use our classification technique as a form of double-checking for the pattern identification
task performed over PCP by the users.
1 INTRODUCTION
The amount of data we currently encounter is vast and
growing. Moreover, these datasets are continuously
increasing in terms of the total number of items con-
tained within them and the number of dimensions per
item. Consequently, there is an increasing need for
swift and effective tools to process complex, multi-
variate datasets.
A widely used approach for data analysis is
preparing an appropriate data visualization to un-
ravel new insights about a given dataset. In the case
of highly-dimensional data, we can use well-known
and popular
1
Parallel Coordinates Plot (PCP) (Insel-
berg, 1985; Inselberg, 2009; Heinrich and Weiskopf,
2013). PCP allows to simultaneously present the en-
tire dataset without the need of using dimension re-
duction (van der Maaten and Hinton, 2008) for 2D/3D
visualization. In PCP, each multidimensional data
a
https://orcid.org/0000-0001-5508-9856
b
https://orcid.org/0000-0003-0455-4062
1
As of 11 May 2021, the Google Scholar search of PCP
results in more than 2 million entries.
item is presented as a curve composed of line seg-
ments connecting values of attributes in each dimen-
sion marked on parallel axes (see Fig. 1).
A typical task that we want to carry out when us-
ing PCP is to identify patterns understood as a group-
ing of similar data items across all the dimensions
(see Fig. 1) as judged by the user (Tadeja et al., 2019;
Tadeja et al., 2021). However, the PCP visualization
has its own caveats. For instance, the readability of
the PCP decreases with the number of visualized data
items. For instance, a high concentration of data may
cause visual clutter, obfuscation, or occlusion on the
main plot (Artero et al., 2004; Dang et al., 2010). As
such, a range of enhancements was proposed to at
least partially remedy this issue. These methods in-
clude stacked, density and frequency versions of the
PCP (Artero et al., 2004; Dang et al., 2010) or their
translation into 3D immersive environments (Tadeja
et al., 2019; Tadeja et al., 2021).
In this context, we propose to reformulate the pat-
tern recognition task as a form of classification. From
this perspective, we can apply machine learning clas-
sification on visualized tabular data presented as PCP.
Artiemjew, P. and Tadeja, S.
Using ConvNet for Classification Task in Parallel Coordinates Visualization of Topologically Arranged Attribute Values.
DOI: 10.5220/0010793700003116
In Proceedings of the 14th International Conference on Agents and Artificial Intelligence (ICAART 2022) - Volume 3, pages 167-171
ISBN: 978-989-758-547-0; ISSN: 2184-433X
Copyright
c
2022 by SCITEPRESS – Science and Technology Publications, Lda. All rights reserved
167

Figure 1: (a) Parallel Coordinates visualization of the Australian Credit dataset split into (b) class 0, and (c) class 1 respec-
tively. Bottom plots in (b) and (c) show one item from each class that, for readability, was not scaled to the PCP window.
As such, we evaluate the effectiveness of convolu-
tional neural network (ConvNet) with visualized tab-
ular data represented in the form of individual PCP
data items (see Fig. 1). Our goal was to validate the
efficacy of visual classification using a graphical rep-
resentation of the tabular data. We wanted to ascer-
tain if it would allow for greater efficiency than the
dummy classifier method.
This work is also a first step towards designing
potential enhancement of the PCP technique, further
uncovering its full potential for multidimensional data
visualization.
2 ARCHITECTURE
Figure 2: The LeNet (LeNail, 2019) architecture of our
ConvNet.
Our primary aim was to verify the experimental
effectiveness of classification based on tabular data
visualized as a topological arrangement of attribute
values using PCP. We show the architecture of the
used network in Fig. 2. As a reference classifier we
have chosen the LeNet (Lecun et al., 1998; Good-
fellow et al., 2016; Almakky et al., 2019) type Con-
vNet (Goodfellow et al., 2016; Lou and Shi, 2020).
The visualization of results was performed using
Matplotlib (Hunter, 2007) library. We scaled images
to 400 × 600 pixels to ensure the same size of the
input for the network. We also randomly divided
datasets into training and testing sets in an 80/20 ra-
tio. We fed the three-layered network with data after
two alternating convolutional and max-pooling steps.
We used max-pooling because it is the most effec-
tive technique for reducing the sizes of images, which
works well with neural network models. Such an ap-
proach turned out to be better in practice than average
pooling (Brownlee, 2019). The convolutional layers
extract features from images before they are fed into
the network.
The activation function of hidden layers was
ReLU, and the output layer had raw values. The loss
function took the form of categorical cross-entropy.
Thus, it could be higher than one. These layers can be
seen in Fig. 2. To train the neural network, we used
RGB color channels and applied the Adam optimizer
(Kingma and Ba, 2015). We carried out the train-
ing for Australian Approval Credit and Heart Disease
datasets over 20 epochs. The batch size was 50, and
the learning rate was 0.001. For the Diabetes dataset,
we used 30 epochs, batch size equal to 10, and a learn-
ing rate of 0.0001. We fitted the above parameters
experimentally.
3 EXPERIMENTS
In the experimental part, we wanted to verify whether
the geometric arrangement of attribute values with
PCP can be successfully used in the classification pro-
cess using real decision systems. This type of so-
lution for symbolic attributes is possible after con-
verting their values to dummy variables. As the data
characteristics allowed us to, we treated attributes as
numeric in our tests. We prepared the data for PCP
visualization using the StandardScaler tool from the
sklearn.preprocessing library. For the experiments,
we selected three distinctly different datasets from
the UCI repository (Dua and Graff, 2017) containing
mainly numerical data:
(i) Australian Credit (dims.: 15, items: 690);
(ii) Heart Disease (dims.: 14, items: 270);
(iii) Pima Indians Diabetes (dims.: 9, items: 768).
ICAART 2022 - 14th International Conference on Agents and Artificial Intelligence
168
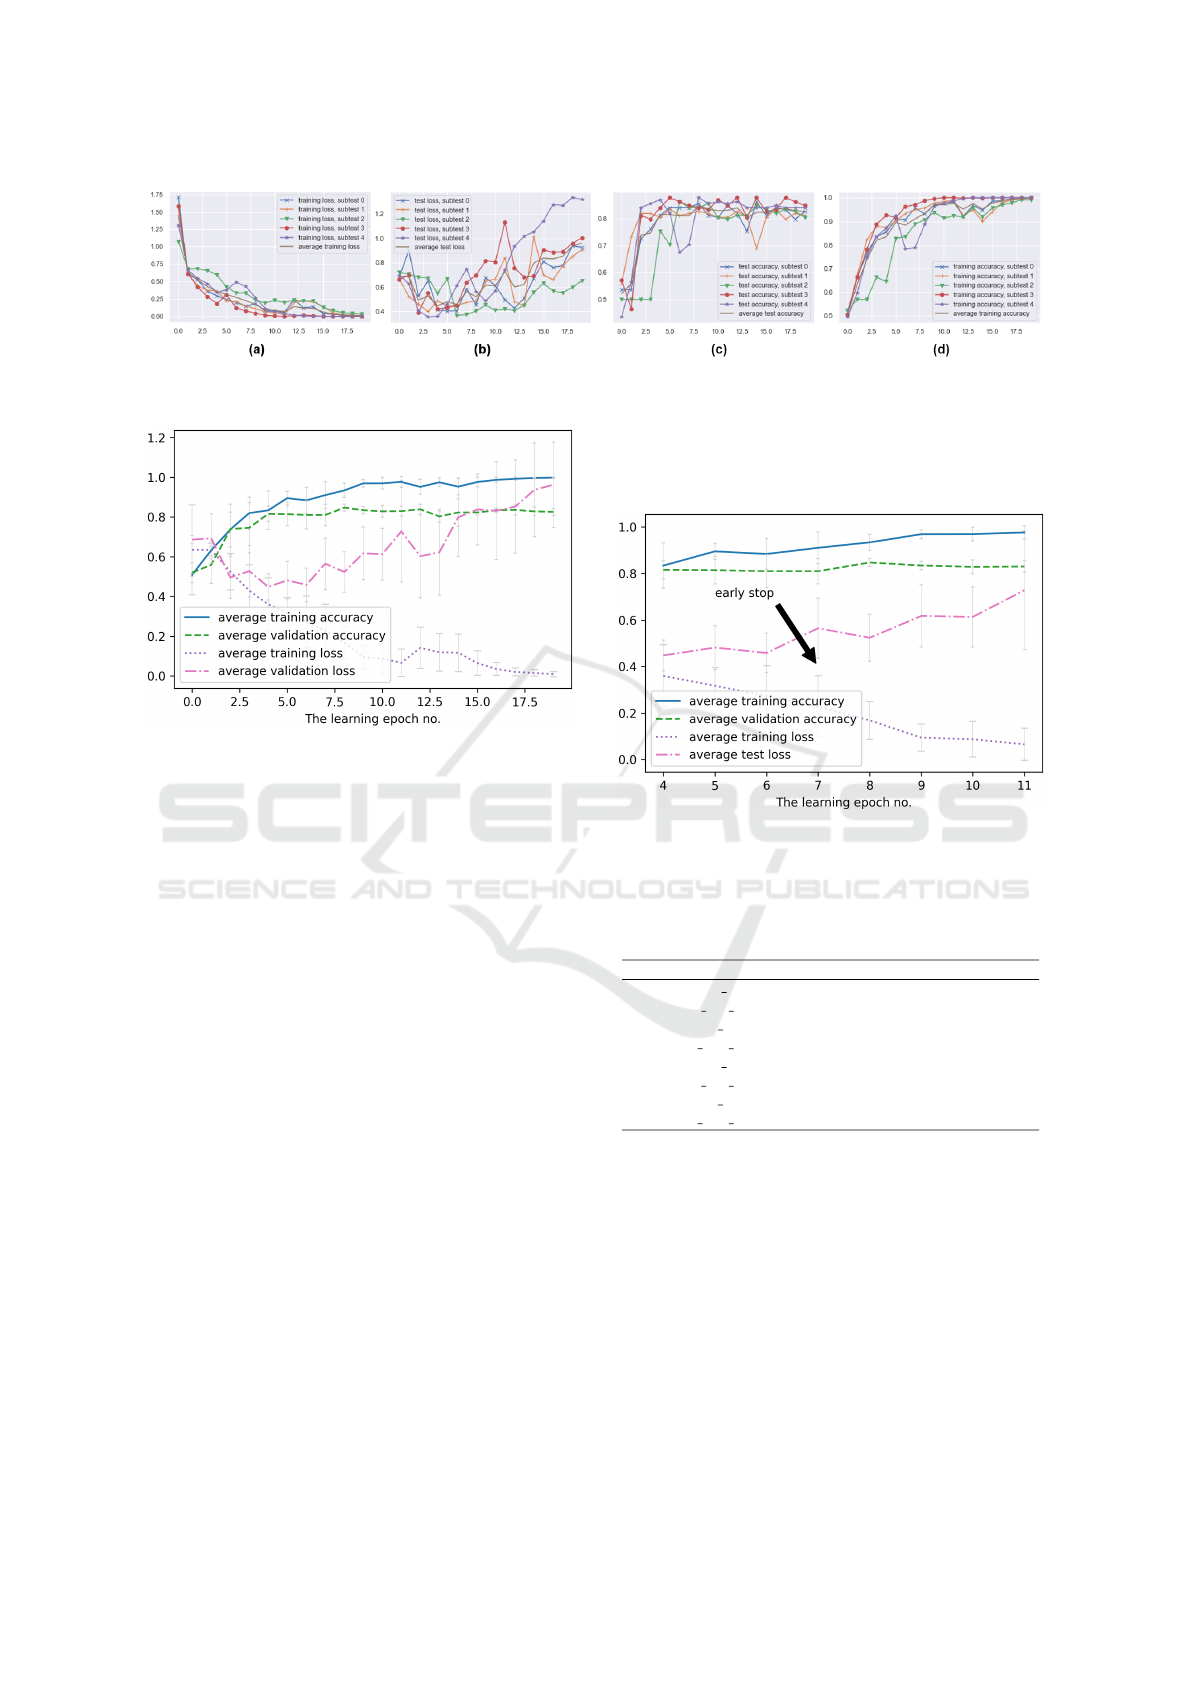
Figure 3: Accuracy for 20 iterations of ConvNet training and corresponding cross-entropy loss for the Australian Credit
dataset.
Figure 4: Summary of average results for 20 iterations over
the (i) Australian Credit Approval dataset.
Fig. 1 shows PCP-based visualization of the two
classes contained in the Australian Credit Approval
dataset. One of the classes denotes credit approval,
whereas the other marks rejected cases.
We used a LeNet-type ConvNet (Lecun et al.,
1998; Goodfellow et al., 2016; Almakky et al., 2019)
as a reference classifier. In the deep neural network
classification experiments, we divided the image sets
into a training subset and the validation test set with
an 80/20 split. To estimate the quality of the classifi-
cation, we used the Monte Carlo Cross Validation (Xu
and Liang, 2001; Goodfellow et al., 2016) technique
(MCCV5, i.e., five times train and test), presenting
average results. In the experiments, the test (vali-
dation) system is applied in a given iteration to the
model to check the final efficiency and observe the
overfitting level. By evaluating in each iteration of
learning an independent validation set (not affecting
the network’s learning process), we can determine the
degree of generalization of the model. The result is
objective when there is no process of overtraining,
i.e., a clear discrepancy between the loss during net-
work training and that resulting from testing the val-
idation set. In evaluating experiments, accuracy in a
balanced version is often recommended, i.e., the aver-
age accuracy of all classes classified (Brodersen et al.,
2010). Such an approach addresses the problem of
unbalanced classes. In our experiments, we use the
Coss Entropy Loss version, which can exceed a value
of 1, to clearly indicate where the model is malfunc-
tioning.
Figure 5: A close-up of the area of iterations where the
model begins to overlearnfor the (i) Australian Approval
Credit dataset.
Table 1: Detailed average accuracy results corresponding to
the Fig. 5 and (i) Australian Approval Credit. dataset.
parameter ep5 ep6 ep7 ep8 ep9
training acc 0.895 0.884 0.911 0.934 0.970
training acc sd 0.035 0.066 0.068 0.035 0.019
training loss 0.318 0.273 0.229 0.169 0.094
training loss sd 0.077 0.130 0.132 0.081 0.059
validation acc 0.814 0.810 0.810 0.848 0.835
validation acc sd 0.059 0.071 0.054 0.017 0.018
validation loss 0.482 0.459 0.565 0.524 0.618
validation loss sd 0.095 0.084 0.130 0.102 0.133
4 RESULTS
We performed all the experiments in a similar fash-
ion. Thus, our results show how the MCCV5 method
works in each learning epoch and present the results
of five internal tests and the average result.
The accuracy of classification and entropy loss of
a given variant–for five subtests–is shown for the Aus-
tralian Credit Approval dataset in Fig. 3. We also offer
the combined average results by adding the standard
deviation in the form of vertical lines in individual
Using ConvNet for Classification Task in Parallel Coordinates Visualization of Topologically Arranged Attribute Values
169
epochs in Fig. 4. We calculated the standard devia-
tion from individual subtests of the MCCV5 method.
Finally, we present a close-up of the area where we
propose the stopping point of the learning process for
each dataset (i-iii) in Fig. 5, 6 and 7. We omit detailed
results for systems (ii) and (iii). However, we have
left a close-up of the areas of learning of most interest
to us (see Fig. 5, 6 and 7).
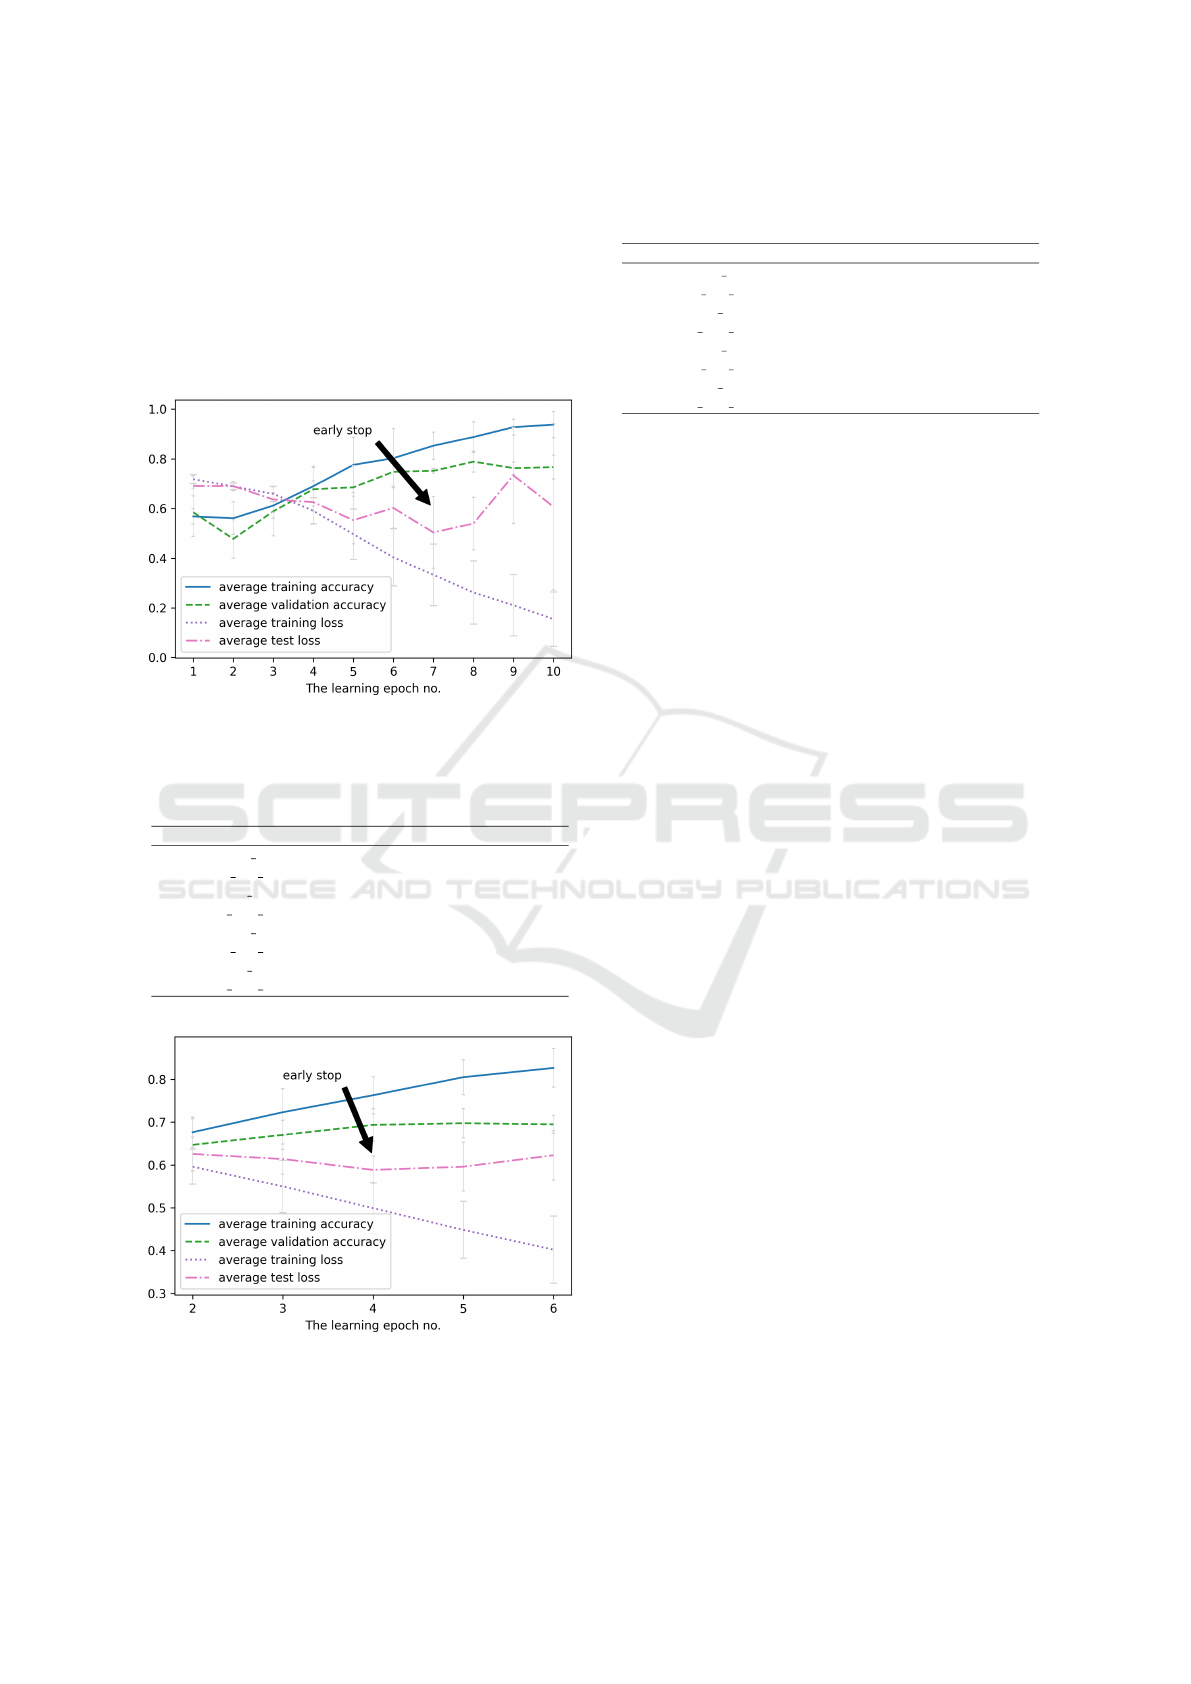
Figure 6: A close-up of the area of iterations where the
model begins to overlearnfor the (ii) Heart Disease dataset.
Table 2: Detailed average accuracy results corresponding to
the Fig. 6 and (ii) Heart Disease dataset.
parameter ep5 ep6 ep7 ep8 ep9
training acc 0.776 0.803 0.853 0.888 0.928
training acc sd 0.111 0.119 0.055 0.061 0.031
training loss 0.497 0.403 0.333 0.262 0.211
training loss sd 0.101 0.115 0.124 0.127 0.123
validation acc 0.685 0.748 0.752 0.789 0.763
validation acc sd 0.088 0.058 0.009 0.042 0.025
validation loss 0.553 0.603 0.504 0.540 0.734
validation loss sd 0.096 0.082 0.144 0.105 0.192
Figure 7: A close-up of the area of iterations where the
model begins to overlearnfor the (iii) Pima Indians Diabetes
dataset.
Table 3: Detailed average accuracy results corresponding to
the Fig. 7 and the (iii) Pima Indians Diabetes dataset.
parameter ep2 ep3 ep4 ep5 ep6
training acc 0.677 0.723 0.763 0.805 0.826
training acc sd 0.036 0.055 0.043 0.041 0.045
training loss 0.596 0.550 0.499 0.448 0.402
training loss sd 0.041 0.061 0.059 0.066 0.078
validation acc 0.647 0.670 0.694 0.697 0.695
validation acc sd 0.061 0.034 0.038 0.034 0.021
validation loss 0.626 0.614 0.588 0.596 0.623
validation loss sd 0.039 0.035 0.032 0.057 0.058
5 DISCUSSION
We conducted two classification tests: based on ran-
domly arranged attributes and with axes sorted with
respect to the correlation with the decision attribute.
The results were comparable, and we tentatively con-
clude that the order of the attributes does not mat-
ter when classifying PCP-visualized items using Con-
vNet. However, complete verification requires testing
a selected group of combinations without repeating
the attribute arrangement and multiple testing with
statistical confirmation.
For all the datasets we show the scores narrowed
to the areas where models started to overlearn in Fig.
5, 6, and 7 together with accompanying Tab. 1, 2,
and 3 respectively. Based on this outcome, we can
conclude that the classification based on PCP visu-
alization gives significantly different results from the
performance of the dummy classifier (i.e., random ef-
fectiveness). We further verified the stability of the
results by presenting the standard deviations of the re-
sults. Furthermore, we can successfully halt the mod-
els using the early stop method, as shown in Fig. 5, 6
and 7. Moreover, conducted tests suggest that for our
method, the order of the attributes does not matter as
conducted tests with varying arrangements yield com-
parable efficiency. The technique allows us to use the
topological arrangement of attributes to capture vi-
sual features that are prototypical patterns of learned
classes. These results will have to be further extended
to test the properties of the developed methodology in
detail.
6 CONCLUSION
In this ongoing work, we verified that the topolog-
ical arrangement of the attribute values of a tabular
decision system could allow effective classification
using deep neural networks. We used a ConvNet of
the LeNet type (Lecun et al., 1998; Goodfellow et al.,
2016; Almakky et al., 2019) as a reference network.
ICAART 2022 - 14th International Conference on Agents and Artificial Intelligence
170

As an efficiency evaluation model, we applied the
Monte Carlo Cross-Validation (MCCV5) method (Xu
and Liang, 2001; Goodfellow et al., 2016).
To conduct the experiments, we selected three real
datasets from the UCI Repository (Dua and Graff,
2017). Our results indicate that classification using
a visual representation of tabular decision systems–
in our case, PCP visualization–is possible and does
not differ significantly from a classic form of deci-
sion systems. This work opens new research avenues
and promises a potentially handy enhancement of the
PCP technique itself.
In the future, we plan to investigate how a com-
mittee of classifiers based on the researched technique
behaves. Furthermore, we will also test other methods
for a visual representation of multidimensional deci-
sion systems in terms of classification and try our ap-
proach on 3D PCP. Other threads we are planning are
to see which transformations of the original PCP visu-
alization positively impact classification. Finally, we
will also consider the application of model explain-
ability techniques by determining which visual fea-
tures influence the classification process.
REFERENCES
Almakky, I., Palade, V., and Ruiz-Garcia, A. (2019). Deep
convolutional neural networks for text localisation in
figures from biomedical literature. In 2019 Interna-
tional Joint Conference on Neural Networks (IJCNN),
pages 1–5.
Artero, A., de Oliveira, M., and Levkowitz, H. (2004). Un-
covering clusters in crowded parallel coordinates vi-
sualizations. In IEEE Symposium on Information Vi-
sualization, pages 81–88.
Brodersen, K. H., Ong, C. S., Stephan, K. E., and Buhmann,
J. M. (2010). The balanced accuracy and its posterior
distribution. In Proceedings of the 2010 20th Interna-
tional Conference on Pattern Recognition, ICPR ’10,
page 3121–3124, USA. IEEE Computer Society.
Brownlee, J. (2019). A gentle introduction to deep learn-
ing for face recognition. Deep Learning for Computer
Vision.
Dang, T. N., Wilkinson, L., and Anand, A. (2010). Stack-
ing graphic elements to avoid over-plotting. IEEE
Transactions on Visualization and Computer Graph-
ics, 16(6):1044–1052.
Dua, D. and Graff, C. (2017). UCI machine learning repos-
itory.
Goodfellow, I., Bengio, Y., and Courville, A. (2016). Deep
Learning. MIT Press.
Heinrich, J. and Weiskopf, D. (2013). State of the Art of
Parallel Coordinates. In Sbert, M. and Szirmay-Kalos,
L., editors, Eurographics 2013 - State of the Art Re-
ports. The Eurographics Association.
Hunter, J. D. (2007). Matplotlib: A 2d graphics environ-
ment. Computing in Science Engineering, 9(3):90–95.
Inselberg, A. (1985). The plane with parallel coordinates.
The Visual Computer, 1(2):69–91.
Inselberg, A. (2009). Parallel coordinates: Visual multidi-
mensional geometry and its applications. ACM SIG-
SOFT Software Engineering Notes, 35(3).
Kingma, D. P. and Ba, J. (2015). Adam: A method for
stochastic optimization. CoRR, abs/1412.6980.
Lecun, Y., Bottou, L., Bengio, Y., and Haffner, P. (1998).
Gradient-based learning applied to document recogni-
tion. Proceedings of the IEEE, 86(11):2278–2324.
LeNail, A. (2019). Nn-svg: Publication-ready neural net-
work architecture schematics. J. Open Source Softw.,
4:747.
Lou, G. and Shi, H. (2020). Face image recognition based
on convolutional neural network. China Communica-
tions, 17(2):117–124.
Tadeja, S., Kipouros, T., and Kristensson, P. O. (2019). Ex-
ploring parallel coordinates plots in virtual reality. In
Brewster, S. and Fitzpatrick, G., editors, CHI EA’19
: extended abstracts of the 2019 CHI Conference on
Human Factors in Computing Systems. Association
for Computing Machinery, New York.
Tadeja, S., Kipouros, T., Lu, Y., and Kristensson, P. O.
(2021). Supporting decision making in engineering
design using parallel coordinates in virtual reality.
AIAA Journal, pages 1–15.
van der Maaten, L. and Hinton, G. (2008). Visualizing data
using t-sne. Journal of Machine Learning Research,
9(86):2579–2605.
Xu, Q.-S. and Liang, Y.-Z. (2001). Monte carlo cross vali-
dation. Chemometrics and Intelligent Laboratory Sys-
tems, 56(1):1–11.
Using ConvNet for Classification Task in Parallel Coordinates Visualization of Topologically Arranged Attribute Values
171
