
Table-structure Recognition Method
Consisting of Plural Neural Network Modules
Hiroyuki Aoyagi
1
, Teruhito Kanazawa
2
, Atsuhiro Takasu
2
, Fumito Uwano
1
and Manabu Ohta
1
1
Okayama University, Okayama, Japan
2
National Institute of Informatics, Tokyo, Japan
Keywords:
Table-structure Recognition, Neural Network, PDF, XML.
Abstract:
In academic papers, tables are often used to summarize experimental results. However, graphs are more
suitable than tables for grasping many experimental results at a glance because of the high visibility. Therefore,
automatic graph generation from a table has been studied. Because the structure and style of a table vary
depending on the authors, this paper proposes a table-structure recognition method using plural neural network
(NN) modules. The proposed method consists of four NN modules: two of them merge detected tokens in a
table, one estimates implicit ruled lines that are necessary to separate cells but undrawn, and the last estimates
cells by merging the tokens. We demonstrated the effectiveness of the proposed method by experiments using
the ICDAR 2013 table competition dataset. Consequently, the proposed method achieved an F-measure of
0.972, outperforming those of our earlier work (Ohta et al., 2021) by 1.7 percentage points and of the top-
ranked participant in that competition by 2.6 percentage points.
1 INTRODUCTION
The spread of academic paper databases such as
Google Scholar
1
, DBLP
2
and CiNii
3
has allowed
us to collect papers more easily. In academic pa-
pers, tables are often used to show some data, statis-
tics, and experimental results. Table recognition is
an important issue not only to generate graphs au-
tomatically but also to search and compare such ex-
perimental results. Therefore, Ohta et al. pro-
posed a cell-detection-based table-structure recogni-
tion method (Ohta et al., 2019), and they improved
it introducing neural networks (NNs) (Ohta et al.,
2021).
The method proposed in (Ohta et al., 2021) intro-
duced two NN modules: one estimates implicit ruled
lines (IRLs) and the other generates cells by merg-
ing tokens in a table. They analyzed 156 tables in
the ICDAR 2013 table-structure competition dataset
(G
¨
obel et al., 2013) for which the resultant recall, pre-
cision, and F-measure values for measuring adjacency
relation between cells were 0.951, 0.960, and 0.955,
respectively. These results marginally outperformed
1
https://scholar.google.com
2
https://dblp.org
3
https://ci.nii.ac.jp
those of the top-ranked participant Nurminen (Nur-
minen, 2013) in that competition. The method, how-
ever, had some room for improvement in its process-
ing flow and NN modules.
In this paper, we propose an improved method
of (Ohta et al., 2021) by introducing NN-based hor-
izontal and vertical token mergers and by sophisti-
cating input features for the NN modules. The pro-
posed method also has two NN modules for IRL es-
timation and cell generation. In addition, it merges
horizontally adjacent tokens before estimating IRLs
and merges vertically adjacent tokens after the esti-
mation. We demonstrate the effectiveness of the pro-
posed method by experiments using the ICDAR 2013
table competition dataset. Note that the proposed
method analyzes the structure of born-digital tables
in PDF documents and not of table images because of
the high availability of recent born-digital tables on
the Internet. Also note that the method currently does
not detect tables in PDF documents and we manually
locate them.
This paper is structured as follows. We introduce
related work on table-structure recognition in Section
2 and explain our proposed method and its four NN
modules in detail in Section 3. Then, we describe
experiments using the ICDAR 2013 table competi-
tion dataset in Section 4, showing that our method
542
Aoyagi, H., Kanazawa, T., Takasu, A., Uwano, F. and Ohta, M.
Table-structure Recognition Method Consisting of Plural Neural Network Modules.
DOI: 10.5220/0010817700003122
In Proceedings of the 11th International Conference on Pattern Recognition Applications and Methods (ICPRAM 2022), pages 542-549
ISBN: 978-989-758-549-4; ISSN: 2184-4313
Copyright
c
2022 by SCITEPRESS – Science and Technology Publications, Lda. All rights reserved
achieved the best results compared to several existing
methods. Finally, we conclude this paper and provide
some future directions in Section 5.
2 RELATED WORK
Chi et al. proposed a graph neural network model for
recognizing the structure of tables in PDF files, named
GraphTSR (Chi et al., 2019). Their method takes a ta-
ble in PDF format as input and first obtains cell con-
tents and its corresponding bounding box. Then, it
recognizes the table structure by predicting the rela-
tions among the obtained cells. They evaluated the
GraphTSR with the ICDAR 2013 table competition
dataset and achieved recall, precision, and F-measure
values of 0.860, 0.885, and 0.872, respectively. They
also constructed a large-scale table dataset collected
from scientific papers, named SciTSR
4
. This dataset
includes 12,000 tables for training and 3,000 tables
for evaluation. They demonstrated that GraphTSR
was highly effective for complicated tables. Their
method as well as our method is designed for born-
digital tables.
Paliwal et al. proposed TableNet (Paliwal et al.,
2019) that is an end-to-end deep learning model
which exploits the inherent interdependence between
the twin tasks of table detection and table structure
identification for table images. This model consists
of two decoders: one segmentates the table region
and the other segmentates the columns in the table.
In addition, they employed a rule-based row extrac-
tion to extract the contents in cells. They evaluated
the effectiveness of their method on the ICDAR 2013
table competition dataset. As a result, their method
achieved an F-measure value of 0.915 for the table-
structure recognition and data extraction task, which
outperformed that of a deep neural network-based
method, DeepDeSRT (Schreiber et al., 2017), by 0.07
percentage points. Their method analyzes the struc-
ture of table images; however, it is not tailored to han-
dle born-digital tables in PDF documents.
Zhong et al. proposed an attention-based encoder-
dual-decoder (EDD) architecture (Zhong et al., 2020)
for table-structure recognition of table images. The
EDD consists of an encoder, a structure decoder, and
a cell decoder. The encoder captures visual features
of the image of a table. The structure decoder re-
constructs the table structure so that the cell decoder
can recognize the contents in cells. They used Pub-
TabNet
5
for the model training and evaluation. They
4
https://github.com/Academic-Hammer/SciTSR
5
https://github.com/ibm-aur-nlp/PubTabNet
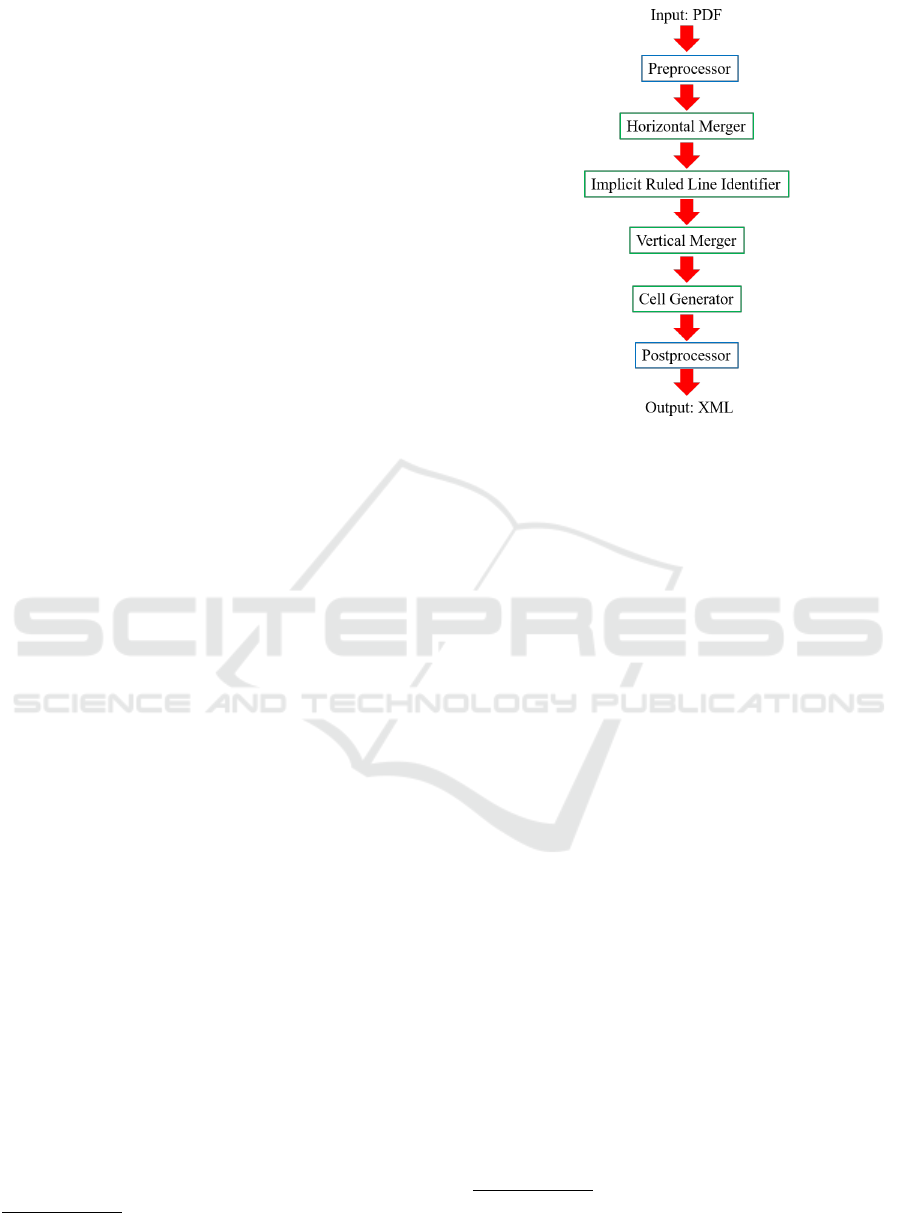
Figure 1: Outline of the proposed method.
employed tree-edit-distance-based similarity (TEDS)
(Pawlik and Augsten, 2016) as the metric for table
recognition. Their method achieved a TEDS score
of 0.912 for simple tables and 0.854 for complex ta-
bles. These TEDS scores outperformed those of WY-
GIWYS (Deng et al., 2017) by 9.5 percentage points
and 9.9 percentage points, respectively. Their method
is also designed for table images and not for born-
digital tables.
3 TABLE-STRUCTURE
RECOGNITION
3.1 Outline of the Proposed Method
The input of the proposed method is tables in docu-
ments in PDF format. The region of the tables are lo-
cated manually before given as the input. The output
is the tables with their estimated structural informa-
tion marked up in XML format.
Figure 1 shows the outline of the proposed
method. It first extracts tokens in a table by converting
the table in PDF to its XML file using pdfalto
6
as pre-
processing. It also detects ruled lines by PDFMiner
7
and OpenCV
8
. Next, it merges horizontally adjacent
tokens recursively and then estimates IRLs by the IRL
identifier. Using explicit and implicit ruled lines and
token features, it merges vertically adjacent tokens re-
6
https://github.com/kermitt2/pdfalto
7
https://github.com/pdfminer/pdfminer.six
8
https://opencv.org
Table-structure Recognition Method Consisting of Plural Neural Network Modules
543
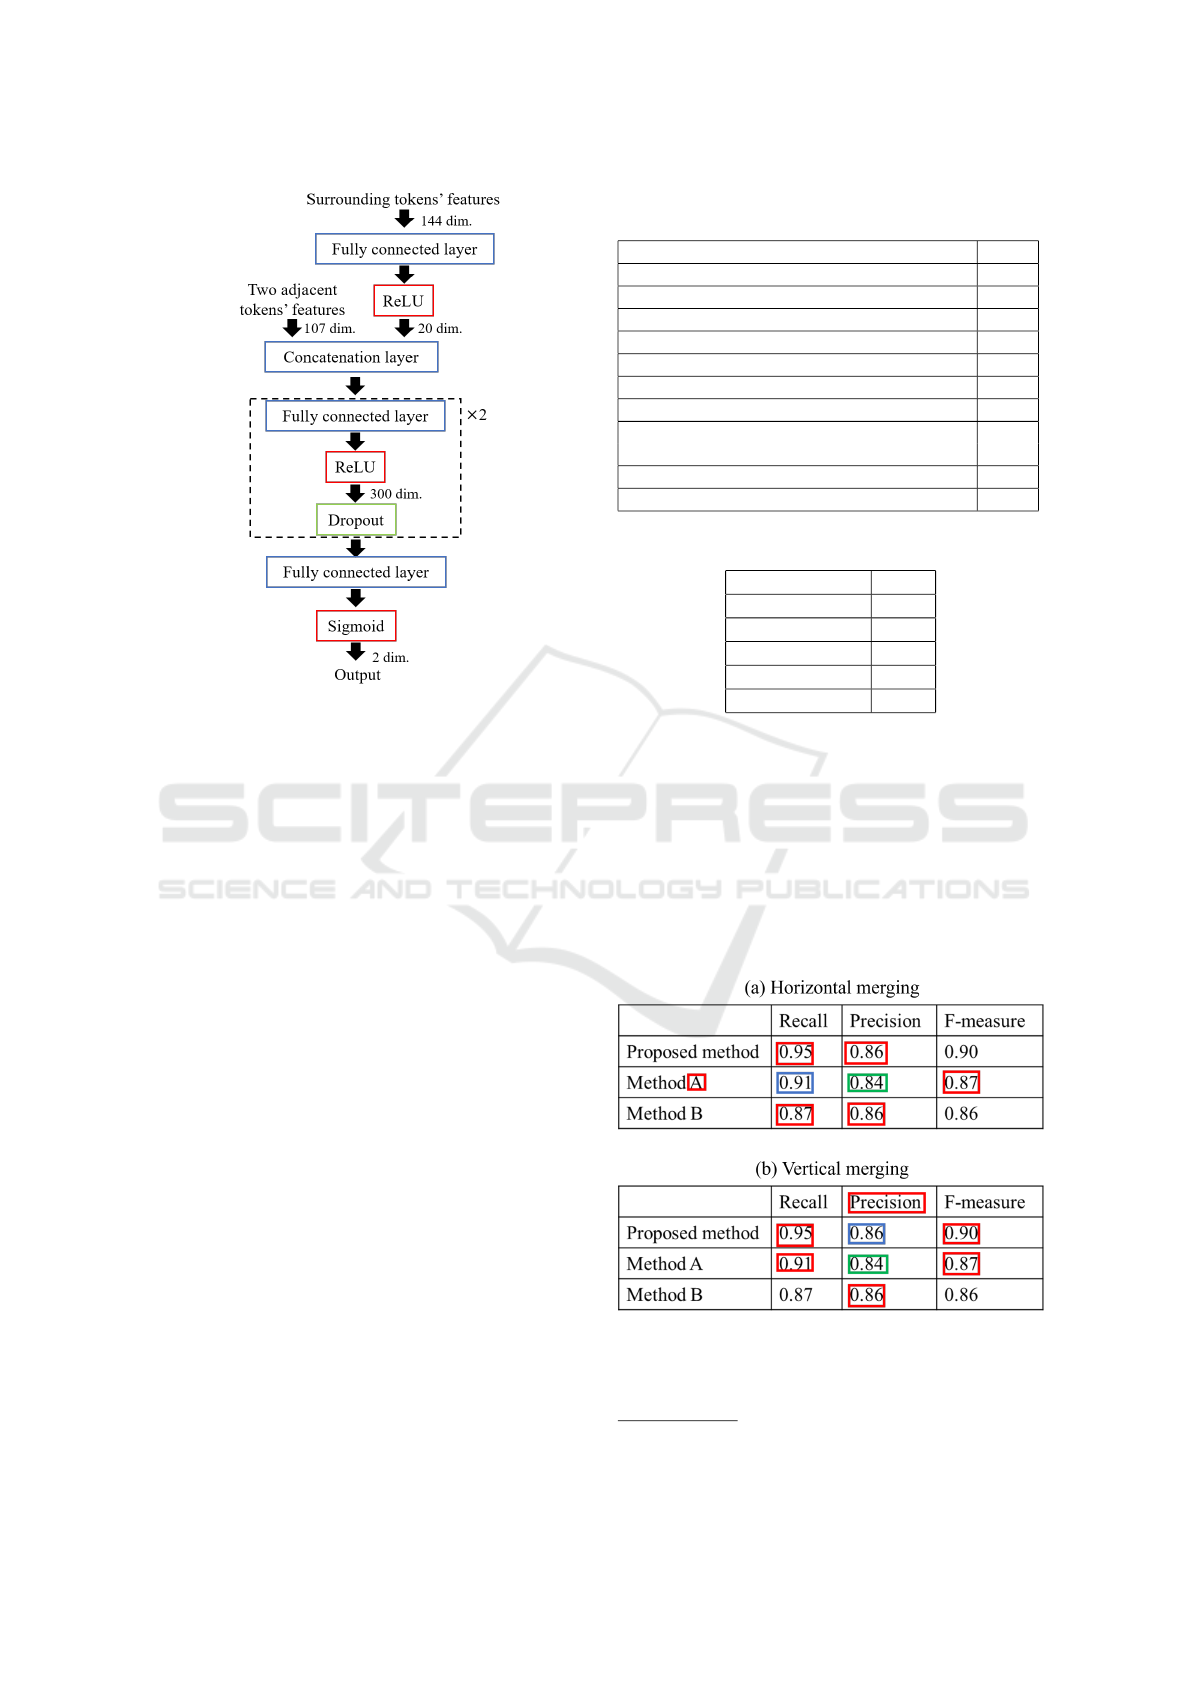
Figure 2: Model of the horizontal merger.
cursively and then generates cells by merging adja-
cent tokens horizontally and vertically in turns. As
postprocessing, it identifies rows and columns includ-
ing multicolumn/multirow cells in the same way as
(Ohta et al., 2021).
3.2 Horizontal Merger
3.2.1 Outline
The horizontal merger continues to merge horizon-
tally adjacent tokens using their features and the sur-
rounding tokens’ features until there remain no to-
ken pairs to be merged. Its model is shown in Fig-
ure 2. The inputs of this model are 107-dimensional
two adjacent tokens’ features and 144-dimensional
surrounding tokens’ features. This model outputs
whether the adjacent tokens are to be merged. We use
the Sigmoid function as the activation of the output
layer and ReLU as the activation of the other layers.
We also use binary cross entropy as the loss function
and Adam (Kingma and Ba, 2015) as the optimizer.
We set the learning rate as 0.01 and the dropout rate
as 0.2.
3.2.2 Input Features of the Horizontal Merger
Table 1 shows two adjacent tokens’ features for the
horizontal merger, and Table 2 shows each surround-
ing token’s features.
Table 1: Two adjacent tokens’ features for the horizontal
merger.
Feature Dim.
Distance between two adjacent tokens 1
Same font or not 1
Same style or not 1
Font size (left and right tokens) 2
Numeric or not (left and right tokens) 2
Merging position 2
Table Size (height and width) 2
# of tokens in the same row and column 2
as the left token
Part of speech (POS) of left and right tokens 94
Total 107
Table 2: Each surrounding token’s features.
Feature Dim.
Position 2
Width 1
Height 1
Numeric or not 1
Total 5
In Table 1, the distance between two adjacent to-
kens is that between the right edge of the left token
and the left edge of the right token. If the token con-
sists of digits, “.,” “-,” “%,” “$,” “greater,” “smaller,”
“more,” or “less,” feature “Numeric or not” is set as 1,
and otherwise as 0. The merging position is the coor-
dinates of the middle point of the two adjacent tokens.
The table size is defined by its height and width. We
obtain the part of speech (POS) of the two tokens by
the Natural Language Toolkit
9
.
Figure 3: Surrounding tokens in (a) horizontal and (b) ver-
tical merging.
9
https://www.nltk.org
ICPRAM 2022 - 11th International Conference on Pattern Recognition Applications and Methods
544
Figure 4: Example of point clusters.
We define a token and its upper, lower, left, and
right tokens as its surrounding tokens and have two
tokens for merging, giving a total of 5 × 2 = 10 sur-
rounding tokens. Figure 3 (a) shows an example of
surrounding tokens in horizontal merging, where the
blue and green tokens are two adjacent tokens to be
inputted and the red tokens are their neighboring to-
kens. Thus, we use the five features in Table 2 for the
ten surrounding tokens, and also use POS information
of the leftmost and rightmost surrounding tokens, i.e.,
“A” and “0.87” in Figure 3 (a). We define the POS
information as a 47-dimensional one-hot vector and
thus use 5 × 10 + 47 + 47 = 144-dimensional vectors
to represent the surrounding tokens’ features.
3.3 Implicit Ruled Line Identifier
3.3.1 Outline
The proposed method estimates IRLs using tokens’
features and layout. In fact, IRLs are aligned points
determined around each token, which we call point
clusters. We collect six types of point sets: the left
and right edges of a token and the middle point of
horizontally adjacent tokens for vertical IRLs, and the
upper and lower edges of a token and the middle point
of vertically adjacent tokens for horizontal IRLs. Fig-
ure 4 shows an example of such point clusters. In this
figure, green points represent the left or right points,
yellow points represent the upper or lower points, and
blue points represent the middle points between two
adjacent tokens. We then generate point clusters from
each type of point sets by the method of elastic center.
Figure 5 shows the model of the IRL identifier.
The inputs of this model are 13-dimensional vectors
(cluster feature) and 100-dimensional word vectors
that are the average of the word distributed represen-
tations of the tokens related to the points in a cluster.
This word vector is acquired by word2vec (Mikolov
et al., 2013) and we use English News (2016) in
Lipzig Copora
10
for training the word2vec. This
model outputs whether each point cluster should be an
10
https://wortschatz.uni-leipzig.de/en/download
Figure 5: Model of the IRL identifier.
Table 3: Features of point clusters for IRL estimation (Ohta
et al., 2021).
Feature Dim.
# of points constituting a cluster 1
# of horizontally or vertically aligned tokens 1
in a table
Existence of a ruled line 1
Direction of the alignment of points in a cluster 1
Cluster type 6
Overlap with other tokens 1
Position of a cluster 1
(relative y- or x-coordinate values)
Table size (height or width) 1
Total 13
IRL. We use the same activation functions, loss func-
tion, and optimizer as those for the horizontal merger.
We set the learning rate as 0.01 and the dropout rate
as 0.2.
3.3.2 Input Features of the Implicit Ruled Line
Identifier
Table 3 shows the features of point clusters originally
determined in (Ohta et al., 2021). In Table 3, feature
“# of horizontally or vertically aligned tokens in a ta-
ble” indicates the number of horizontally (resp. verti-
cally) aligned tokens in horizontal (resp. vertical) IRL
estimation. Feature “Overlap with other tokens” is set
as 1 if the extension of an estimated IRL passes over
other tokens that are irrelevant to the estimated IRL.
Table-structure Recognition Method Consisting of Plural Neural Network Modules
545
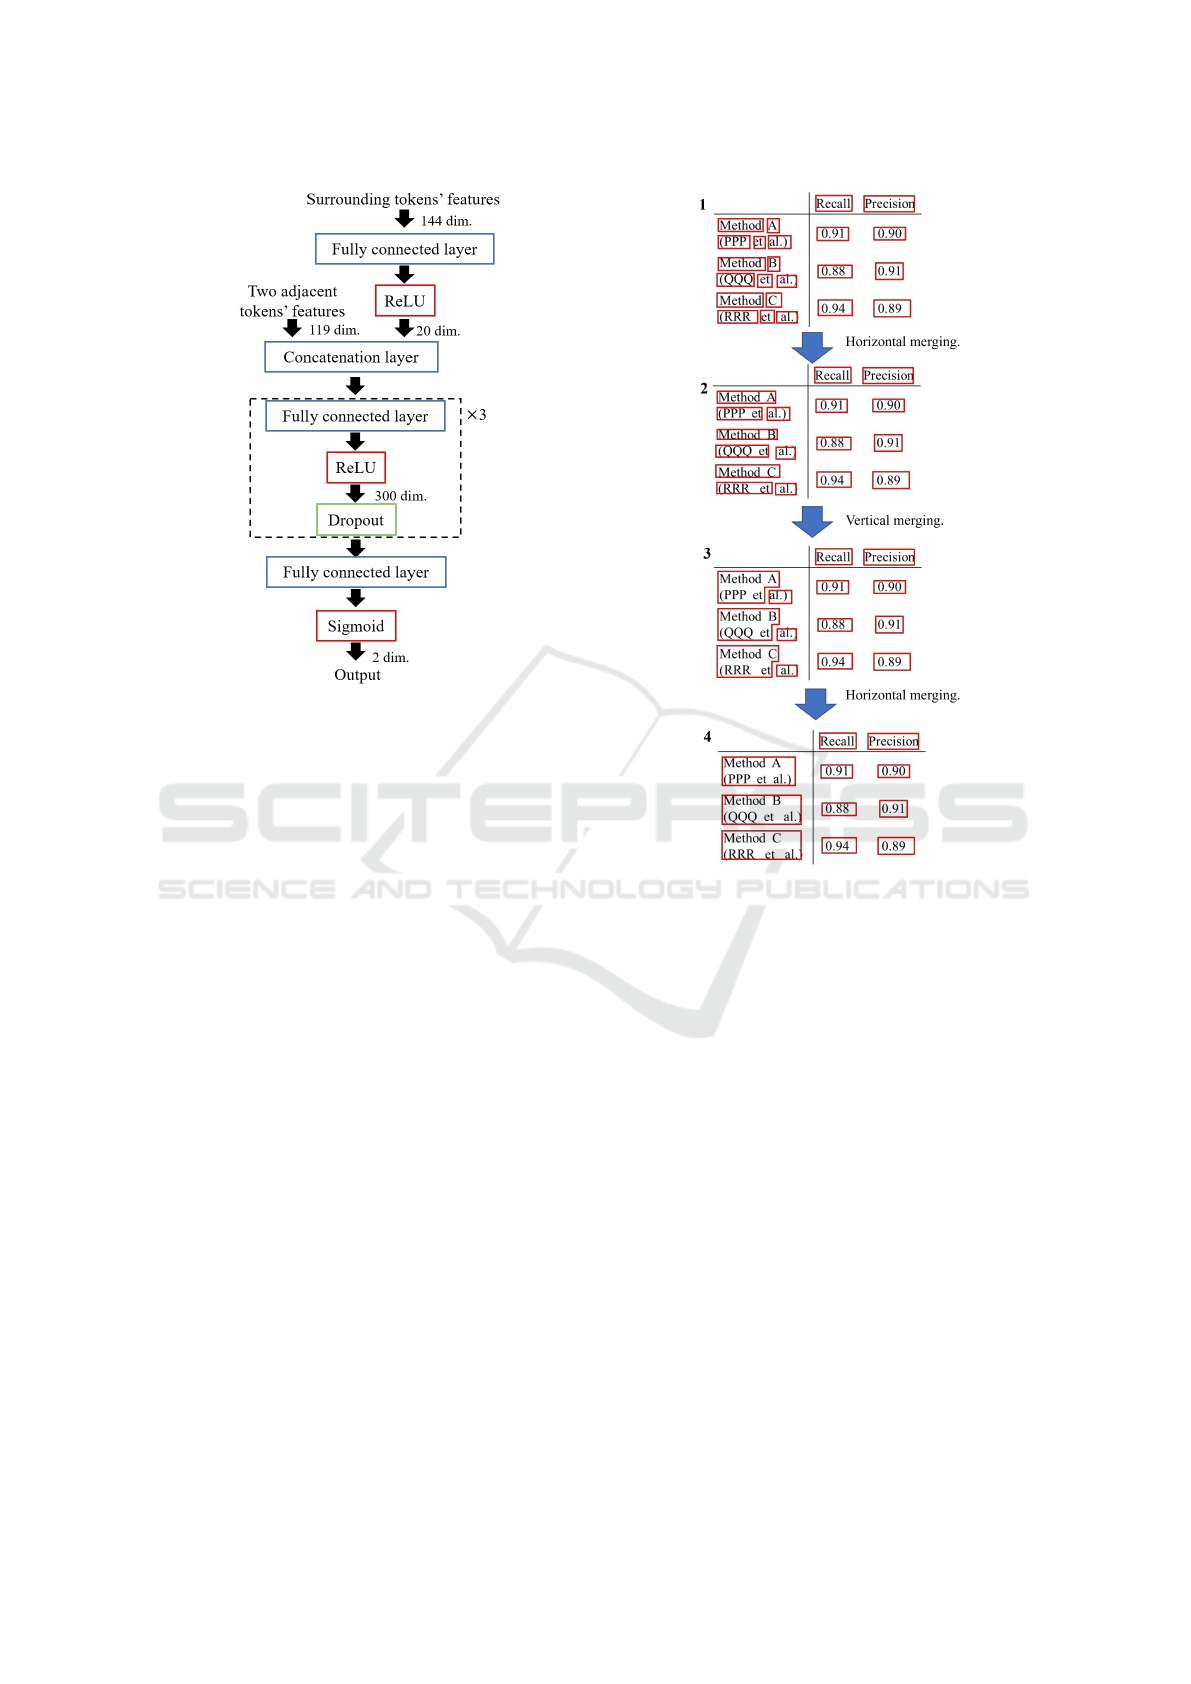
Figure 6: Model of the vertical merger and the cell genera-
tor.
3.4 Vertical Merger
3.4.1 Outline
After the IRL estimation, the vertical merger shown
in Figure 6 continues to merge vertically adjacent
tokens using their features and the surrounding to-
kens’ features until there remain no token pairs to
be merged. Figure 3 (b) shows an example of such
two tokens and their neighboring tokens. The inputs
of this model are 119-dimensional two adjacent to-
kens’ features and 144-dimensional surrounding to-
kens’ features. This model outputs whether the adja-
cent tokens are to be merged. We use the same acti-
vation functions, loss function, and optimizer as those
for the horizontal merger. We set the learning rate as
0.01 and the dropout rate as 0.2.
3.4.2 Input Features of the Vertical Merger
We use the two adjacent tokens’ features shown in
Table 1 for vertical token merging where “left” and
“right” are substituted with “upper” and “lower,” re-
spectively. Moreover, we add the “merging direc-
tion,” “# of points constituting IRLs that exist be-
tween the two adjacent tokens,” and “textual similar-
ity between the two tokens” to those presented in Ta-
ble 1. We calculate the textual similarity by a Python
library called difflib. We use the same features of sur-
Figure 7: Cell estimation by the cell generator.
rounding tokens as presented in Table 2 for vertical
token merging.
3.5 Cell Generator
The cell generator continues to merge horizontally
and vertically adjacent tokens in turns using two adja-
cent tokens’ features and surrounding tokens’ features
until there remain no token pairs to be merged. The
resultant merged tokens are estimated cells. We use
the same model as that of the vertical merger shown
in Figure 6 and the same features described in Section
3.4.2 for cell generation. Note, however, that the cell
generator uses the features of left and right tokens in
horizontal merging and those of upper and lower to-
kens in vertical merging.
Figure 7 shows an example how cells are gener-
ated by the cell generator, in which red rectangles rep-
resent tokens that were not merged by the horizontal
merger nor by the vertical merger. As shown, hori-
zontally adjacent tokens such as “(PPP” and “et” are
firstly merged into one token. Then, vertically adja-
cent tokens such as “Method A” and “(PPP et” are
ICPRAM 2022 - 11th International Conference on Pattern Recognition Applications and Methods
546
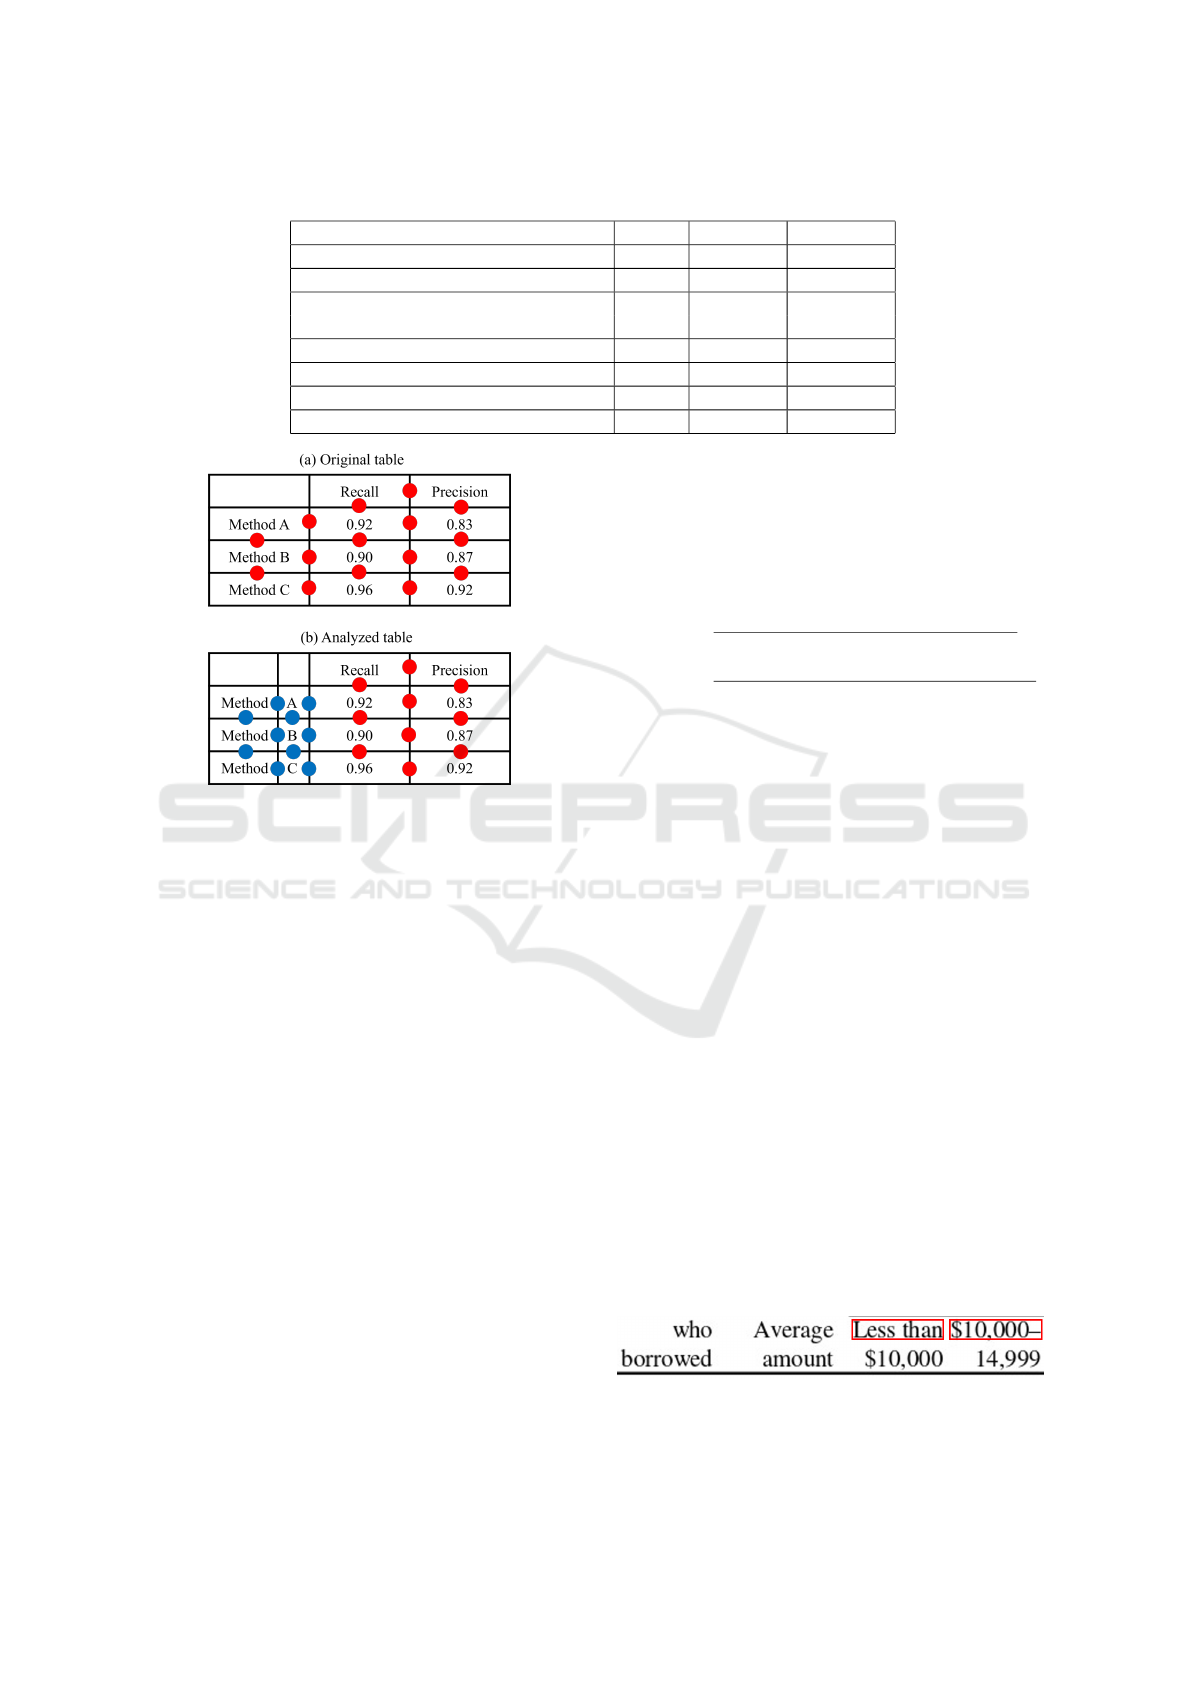
Table 4: Results on the ICDAR 2013 table competition dataset (G
¨
obel et al., 2013).
Method Recall Precision F-measure
Proposed method 0.967 0.977 0.972
Ohta et al. (Ohta et al., 2021) 0.951 0.960 0.955
Nurminen (Nurminen, 2013) 0.941 0.951 0.946
1st ranked (G
¨
obel et al., 2013)
Shigarov et al. (Shigarov et al., 2016) 0.923 0.950 0.936
GraphTSR (Chi et al., 2019) 0.860 0.885 0.872
2nd ranked (G
¨
obel et al., 2013) 0.640 0.614 0.627
3rd ranked (G
¨
obel et al., 2013) 0.481 0.570 0.522
Figure 8: Adjacency relation between cells.
merged into one token. Finally, two horizontally ad-
jacent tokens such as “Method A (PPP et” and “al.)”
are merged.
4 EXPERIMENTS
4.1 Dataset and Metrics
For evaluating the method performance, we used the
ICDAR 2013 table competition dataset (G
¨
obel et al.,
2013) extracted from collected PDF documents pub-
lished by the US government and the European Union
(EU). This dataset comprised 80 tables extracted from
US documents and 76 tables extracted from EU doc-
uments, giving a total of 156 tables.
For training all the four NN models, i.e., the hori-
zontal and vertical mergers, the IRL identifier, and the
cell generator, we used the same dataset as in (Ohta
et al., 2021). It consists of 209 tables, about half of
which are from the ICDAR 2013 practice dataset and
the rest are from collected research papers. Note that
we train each NN module independently.
We evaluated the table-structure recognition re-
sults based on adjacency relations between cells in
tables adopted in the ICDAR 2013 table competition
(G
¨
obel et al., 2012). Figure 8 shows an example of
adjacency relation between cells. In this figure, the
red circles indicate correct adjacency relations while
the blue ones indicate incorrect adjacency relations.
We can calculate recall and precision measures, as de-
fined by the following equations.
Recall =
Correct adjacency relations
All adjacency relations in the ground truth
Precision =
Correct adjacency relations
All adjacency relations in the analyzed result
4.2 Experimental Results
Table 4 shows the results of table-structure recogni-
tion. As shown, the proposed method achieved the re-
call, precision, and F-measure values of 0.967, 0.977,
and 0.972, respectively, which outperforms those of
(Ohta et al., 2021) by 1.6, 1.7, and 1.7 percentage
points, respectively, and also outperforms the other
methods. Note also that the proposed method out-
performs the top-ranked participant (Nurminen) in
the ICDAR 2013 table competition by 2.6 percentage
points in F-measure.
Table 5 shows the results of the horizontal merger
at the first iteration. As presented in the table, there
were 3,039 horizontally adjacent token pairs to be
merged and 85 pairs not to be merged. The pairs
to be merged were much more than those not to be
merged because we set a relatively small threshold for
the distance between them when selecting the initial
token pairs. As seen here, the horizontal merger could
merge 3,031 out of 3,039 token pairs that should be
merged while it mistakenly merged 19 out of 85 to-
ken pairs that should not be merged.
Figure 9 shows a part of an incorrectly analyzed
table by the horizontal merger where “Less than” and
Figure 9: Failed example of horizontal token merging in the
dataset (G
¨
obel et al., 2013).
Table-structure Recognition Method Consisting of Plural Neural Network Modules
547
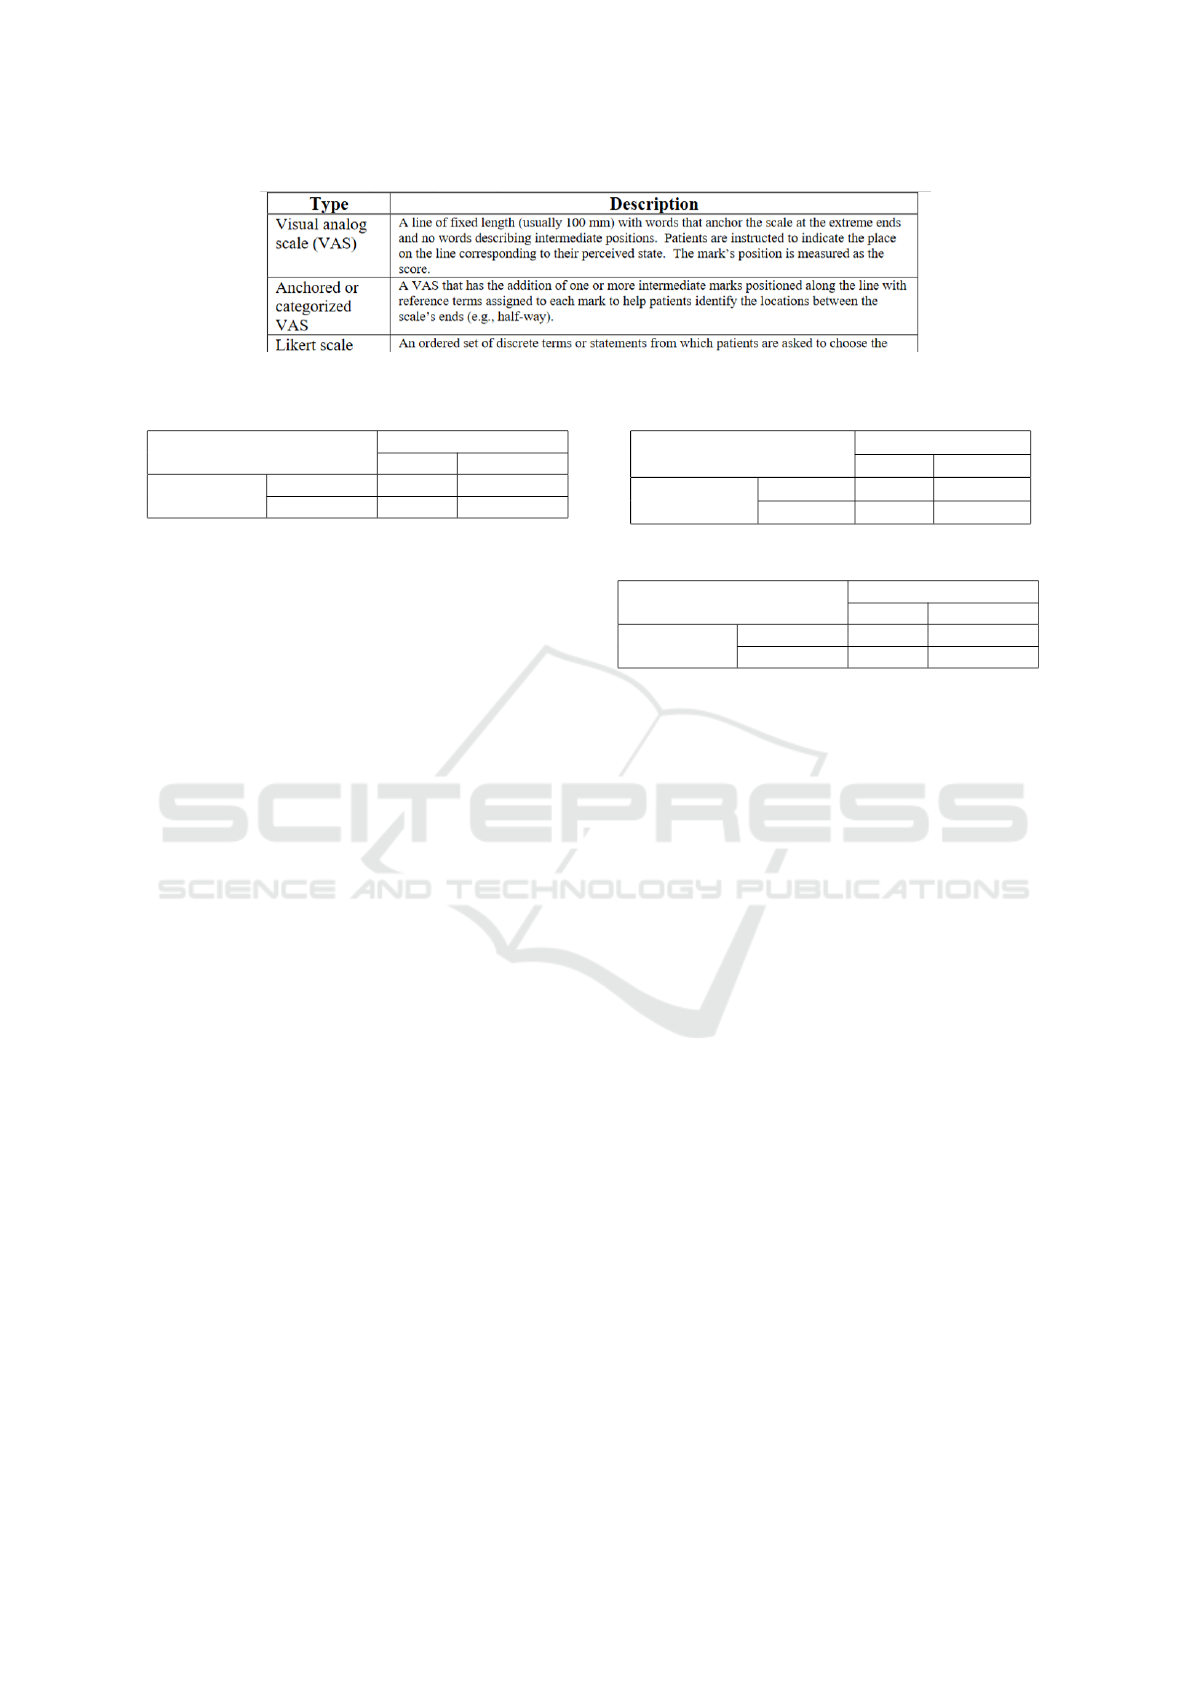
Figure 10: Successfully analyzed table in the dataset (G
¨
obel et al., 2013).
Table 5: Results of merging horizontally adjacent tokens.
Predicted
Merged Not merged
Ground truth Merged 3,031 8
Not merged 19 66
“$10,000-” were mistakenly merged into one token
because the distance between them is very small and
“Less than $10,000-” appears to make sense. Note
that “Less than” is a token generated by correctly
merging “Less” and “than.”
Table 6 shows the results of IRL estimation. As
shown, there were 13,132 IRL point clusters and
5,000 non-IRL point clusters. Because the non-
IRL samples were fewer than the IRL samples, the
non-IRL samples were augmented by SMOTEENN
(Batista et al., 2004), when training the IRL identi-
fier. The errors where the non-IRL point clusters were
mistakenly estimated as IRLs were more than the er-
rors where the IRL point clusters were mistakenly es-
timated as non-IRLs.
Table 7 shows the results of the cell generator at
the first iteration. In contrast to Table 5, there were
much more token pairs not to be merged (25,539) than
those to be merged (1,656) in Table 7 partly because
these tokens were remained tokens after both horizon-
tal and vertical token merging. Note also that these
token pairs consist of both horizontally and vertically
adjacent token pairs found in the identical token set
generated by the vertical merger. As seen in Table 7,
less than one-fifteenth of the pairs should be merged
and the rest should not, being also imbalanced. How-
ever, we did not adjust the imbalance of samples be-
cause the errors where the token pairs to be merged
are mistakenly not merged are not critical compared
with the errors where the token pairs not to be merged
are mistakenly merged. As presented in the table, the
number of mistakenly merged token pairs was only
55, i.e., 0.22% of 25,539 token pairs not to be merged
while the number of token pairs failing to be merged
was 376, i.e., 23% of 1,656 token pairs to be merged.
Figure 10 shows a part of a correctly analyzed ta-
ble by the proposed method where the table has plural
large cells filled with a long passage. In analysis of
this kind of tables, the horizontal merger is especially
Table 6: Results of IRL estimation.
Predicted
IRL Non-IRL
Ground truth IRL 12,564 568
Non-IRL 880 4,120
Table 7: Results of merging tokens by the cell generator.
Predicted
Merged Not merged
Ground truth Merged 1,280 376
Not merged 55 25,484
effective in correct IRL estimation because each word
is usually recognized as a token, thereby generating
many non-IRL point clusters around it unless these
horizontally adjacent tokens are merged. The hori-
zontal merger successfully merged horizontally adja-
cent tokens in the table repeatedly before IRL estima-
tion, which led to correct cell estimation by the cell
generator.
5 CONCLUSION
We proposed a table-structure recognition method us-
ing plural NN modules in this paper. The proposed
method consists of four NN modules: one merges to-
kens in a table horizontally and one vertically, one es-
timates IRLs that are necessary to separate cells but
undrawn, and the last finally estimates cells by merg-
ing the tokens. We analyzed 156 tables in the ICDAR
2013 table-structure competition dataset, for which
the resultant recall, precision, and F-measure values
were 0.967, 0.977, and 0.972, respectively. These
results outperformed those of our previous method
(Ohta et al., 2021) in every metric and by 1.7 per-
centage points in F-measure, vastly outperforming the
other methods, including the top-ranked participant
Nurminen (Nurminen, 2013) in that competition.
In future work, we plan to apply our table-
structure recognition method to other datasets such as
SciTSR (Chi et al., 2019) and to table image anal-
ysis problems tackled at ICDAR 2019 (Gao et al.,
2019). We also plan to introduce a table region detec-
tion module into our method by using state-of-the-art
ICPRAM 2022 - 11th International Conference on Pattern Recognition Applications and Methods
548

table detection algorithms such as (Riba et al., 2019)
and (Prasad et al., 2020). Moreover, we want to de-
velop an automatic graph generation application us-
ing the tables analyzed by our method.
ACKNOWLEDGEMENTS
This work was supported by a JSPS Grant-in-Aid
for Scientific Research (C) (18K11989), the Cross-
ministerial Strategic Innovation Promotion Program
(SIP) Second Phase, “Big-data and AI-enabled Cy-
berspace Technologies” by NEDO, and ROIS NII
Open Collaborative Research 2021 (21FC04).
REFERENCES
Batista, G., Prati, R., and Monard, M. (2004). A study
of the behavior of several methods for balancing ma-
chine learning training data. SIGKDD Explor. Newsl.,
6(1):20–29.
Chi, Z., Huang, H., Xu, H., Yu, H., Yin, W., and Mao,
X. (2019). Complicated table structure recognition.
CoRR, abs/1908.04729.
Deng, Y., Kanervisto, A., Ling, J., and Rush, M. A. (2017).
Image-to-markup generation with coarse-to-fine at-
tention. In 34th International Conference on Machine
Learning (ICML), volume 70, pages 980–989.
Gao, L., Huang, Y., D
´
ejean, H., Meunier, J.-L., Yan, Q.,
Fang, Y., Kleber, F., and Lang, E. (2019). ICDAR
2019 competition on table detection and recognition
(cTDaR). In 2019 15th International Conference on
Document Analysis and Recognition (ICDAR), pages
1510–1515.
G
¨
obel, M., Hassan, T., Oro, E., and Orsi, G. (2013). IC-
DAR 2013 table competition. In 2013 12th Interna-
tional Conference on Document Analysis and Recog-
nition (ICDAR), pages 1449–1453.
G
¨
obel, M., Hassan, T., Oro, E., and Orsi, G. (2012). A
methodology for evaluating algorithms for table un-
derstanding in pdf documents. In ACM Symposium
on Document Engineering 2012 (DocEng ’12), pages
45–48.
Kingma, P. D. and Ba, J. (2015). Adam: A method for
stochastic optimization. In 3rd International Confer-
ence on Learning Representations (ICLR ’15).
Mikolov, T., Chen, K., Corrado, G., and Dean, J. (2013).
Efficient estimation of word representations in vector
space. In the Workshop at 1st International Confer-
ence on Learning Representations.
Nurminen, A. (2013). Algorithmic extraction of data in ta-
bles in pdf documents. Master’s thesis, Tampere Uni-
versity of Technology.
Ohta, M., Yamada, R., Kanazawa, T., and Takasu, A.
(2019). A cell-detection-based table-structure recog-
nition method. In ACM Symposium on Document En-
gineering 2019 (DocEng ’19), Article 27, 4 pages.
Ohta, M., Yamada, R., Kanazawa, T., and Takasu, A.
(2021). Table-structure recognition method using neu-
ral networks for implicit ruled line estimation and cell
estimation. In ACM Symposium on Document Engi-
neering 2021 (DocEng ’21), Article 23, 7 pages.
Paliwal, S., Vishwanath, D., Rahul, R., Sharma, M., and
Vig, L. (2019). Tablenet: Deep learning model for
end-to-end table detection and tabular data extraction
from scanned document images. In 2019 15th Interna-
tional Conference on Document Analysis and Recog-
nition (ICDAR), pages 128–133.
Pawlik, M. and Augsten, N. (2016). Tree edit distance:
Robust and memory-efficient. Information Systems,
56:157–173.
Prasad, D., Gadpal, A., Kapadni, K., Visave, M., and Sul-
tanpure, K. (2020). CascadeTabNet: An approach for
end to end table detection and structure recognition
from image-based documents. In 2020 IEEE/CVF
Conference on Computer Vision and Pattern Recog-
nition Workshops (CVPRW), pages 2439–2447.
Riba, P., Dutta, A., Goldmann, L., Forn
´
es, A., Ramos,
O., and Llad
´
os, J. (2019). Table detection in invoice
documents by graph neural networks. In 2019 15th
International Conference on Document Analysis and
Recognition (ICDAR), pages 122–127.
Schreiber, S., Agne, S., Wolf, I., Dengel, A., and Ahmed,
S. (2017). Deepdesrt: Deep learning for detection and
structure recognition of tables in document images. In
2017 14th IAPR International Conference on Docu-
ment Analysis and Recognition (ICDAR), volume 1,
pages 1162–1167.
Shigarov, A., Mikhailov, A., and Altaev, A. (2016). Con-
figurable table structure recognition in untagged pdf
documents. In ACM Symposium on Document Engi-
neering 2016 (DocEng ’16), pages 119–122.
Zhong, X., ShafieiBavani, E., and Yepes, J. A. (2020).
Image-based table recognition: Data, model, and eval-
uation. In 16th European Conference on Computer
Vision (ECCV ’20), pages 564–580.
Table-structure Recognition Method Consisting of Plural Neural Network Modules
549
