
Optimal Models for Distributing Vaccines in a Pandemic
Md Yeakub Hassan
1,2
, Mahzabeen Emu
2
, Zubair Md Fadlullah
1,2
and Salimur Choudhury
2
1
Thunder Bay Regional Health Research Institute, Thunder Bay, Ontario, Canada
2
Department of Computer Science, Lakehead University, Thunder Bay, Ontario, Canada
Keywords:
Pandemic, ILP, Vaccine Distribution, Operational Research, Policy Making.
Abstract:
Distributing vaccines among a massive population is one of the challenging tasks in a pandemic. Therefore,
health care organizations need to optimize the assignment of vaccination appointments for people while con-
sidering their priorities and preferences. In this paper, we propose two optimal vaccine distribution models
as Integer Linear Programming (ILP) models; namely, Priority-based Model (PM) and Priority & Preference-
based Model (PPM), to maximize the distribution of vaccines among a given population. In PM, we divide
the people among several priority groups and ensure maximum vaccine distribution among the higher priority
groups. However, along with the priority groups, PPM also considers a list of preferred vaccine distribution
centers and time slots for each person. Thus, this model maximizes vaccine distribution among the higher
priority groups by assigning appointments in their desired location and time. We analyzed the performance
of our proposed models on a randomly generated dataset. In addition, we also performed a case study for
our proposed models on the COVID-19 vaccination dataset from Thunder Bay, Canada. In both experiments,
we show that PPM outperforms PM in full-filling people’s preferences while maximizing the distribution of
vaccines among the higher priority groups.
1 INTRODUCTION
A pandemic creates massive challenges for health
care organizations, including inadequate capacity, fi-
nancial loss, and resource management. Recently,
the COVID-19 pandemic shows us how a pandemic
can cause an array of acute challenges, from provid-
ing enough protective equipment to adjusting hospi-
tal’s capacity by reducing financial loss (Ali and Al-
harbi, 2020; Xiong et al., 2020; Nicole et al., 2020).
As of September 2021, more than 230 million cases
are reported worldwide, along with 4.7 million deaths
(Worldometers, 2021). Health care specialists are
urging people to get vaccinated to get over the pan-
demic. However, as most countries have already
started to vaccinate people, it becomes challenging to
distribute vaccines among a massive population with
limited resources. People can have different prefer-
ences of locations and timing for getting their vac-
cines; moreover, our vaccine distribution centers have
limited capacity. Therefore, assigning appointments
for vaccination becomes challenging for health care
organizations. Mahzabeen et al. (Emu et al., 2021)
propose several vaccines distributing models using
Constraint Satisfaction Programming (CSP). These
models do not consider people’s preferences for set-
ting up appointments in their preferred vaccine distri-
bution centers at their preferred time.
In this paper, we propose two optimal vaccine dis-
tribution models, namely,
• Priority based Model (PM)
• Priority & Preference based Model (PPM),
to optimize the distribution of vaccines in a given
geographical region. We formulate both models as
Integer Linear Programming (ILP) models and show
that these problems are NP-hard. In PM, our goal is
to maximize the distribution of vaccines among the
people with higher priority and maximize the mini-
mum resource utilization of any distribution centers
among all vaccine distribution centers. In PPM, we
aim to maximize the number of vaccinated people
with higher priority assigned to one of their preferred
vaccine distribution centers and time slots. We also
aim to maximize the minimum resource utilization of
any distribution center among all distribution centers.
We perform a random experiment and a case study
on these models and show how these models provide
the most optimal vaccine distribution. For the case
study, we use COVID-19 vaccination data obtained
from Thunder Bay, Ontario, Canada. Our experimen-
tal analysis shows that PPM assigns most people to
Hassan, M., Emu, M., Fadlullah, Z. and Choudhury, S.
Optimal Models for Distributing Vaccines in a Pandemic.
DOI: 10.5220/0010819600003117
In Proceedings of the 11th International Conference on Operations Research and Enterprise Systems (ICORES 2022), pages 337-344
ISBN: 978-989-758-548-7; ISSN: 2184-4372
Copyright
c
2022 by SCITEPRESS – Science and Technology Publications, Lda. All rights reserved
337

their preferred distribution centers and time slot. Our
models also maximize the minimum resource utiliza-
tion of any distribution centers among all distribution
centers. Our vaccine distribution models can opti-
mally distribute vaccines or any medical equipment
among a massive population.
The rest of the paper is organized the follows. In
Section 2, we discuss the related works in the litera-
ture. The system model and optimal vaccine distribu-
tion models are discussed in Section 3 and 4, respec-
tively. Section 5 discusses the experimental analysis
on our proposed models. Finally, we conclude the pa-
per in Section 6.
2 RELATED WORKS
Vaccines are one of the most effective ways to pre-
vent a sudden outbreak and develop immunity against
certain infectious diseases (Tan et al., 2012). The
overall supply chain of vaccines can be categorized
into four broad categories: product, production, al-
location, and distribution (Duijzer et al., 2018). The
importance of strategic spatiotemporal vaccine distri-
bution to control the spread of highly infectious dis-
eases has been proven undeniable through existing lit-
erature (Grauer et al., 2020). The final step of vaccine
distribution involves various decisions such as inven-
tory control, location of vaccine stockpiles, logistics
related to the point of dispensing, staffing levels, rout-
ing, and scheduling, etc. (Duijzer et al., 2018). Of-
ten, the operations research perspective is adopted to
achieve optimal vaccine distribution schemes. Most
of the operations research-based models have been
developed using Quadratic Programming (QP), Inte-
ger Linear Programming (ILP), Mixed Integer Linear
Programming (MILP), Constraint Optimization (CO)
frameworks (Emu et al., 2021).
Sharon et al. (Hovav and Tsadikovich, 2015)
propose a mathematical model to improve the over-
all supply chain by optimizing inventory manage-
ment of influenza vaccines. With the help of the La-
grangian approach and branch-and-bound techniques,
a research study has been conducted to factor in en-
vironmental considerations for the cold supply chain
of vaccines (Saif and Elhedhli, 2016). The authors
propose a hybrid optimization-simulation tool to re-
duce the effects of refrigerant gases and carbon emis-
sions caused by the preservation of vaccines as much
as possible (Saif and Elhedhli, 2016). Lin et al. have
developed a policy-based model for taking intermedi-
ary decisions on the transportation of vaccines from
distributors to retailers (Lin et al., 2020).
An equity constraints-based framework using the
Gini index has been studied to distribute Influenza
vaccines optimally (Enayati and
¨
Ozaltın, 2020). The
authors justify the model implications and the scala-
bility of the model on larger instances through exten-
sive simulation studies (Enayati and
¨
Ozaltın, 2020).
Another research study has developed a simulation
tool to optimize the average waiting time of individ-
uals to expedite mass vaccination rate (Gupta et al.,
2013). Furthermore, Rajan et al. formulated a
stochastic genetic algorithm for deriving optimal vac-
cine distribution strategies that have been proven to
demonstrate 85% more efficacy compared to random
vaccination schemes (Patel et al., 2005). Recently,
some of the research studies have made an effort to
maintain transparency, data integrity, and immutabil-
ity using blockchain framework for vaccine rollouts
(Antal et al., 2021). This research study highly em-
phasized the employment of smart contracts to enable
awareness among network peers (Antal et al., 2021).
To the best of our knowledge, existing literature
studies ignore the preferences of individuals for the
vaccine distribution decision-making process. In this
paper, we propose an ILP based vaccine distribution
model that simultaneously prioritizes individual pref-
erences and resource utilization of vaccine distribu-
tion centers. Such a model can be generalized and
adapted for sudden pandemic and epidemic urgency
situations that may arise in the future. Moreover, the
convenience caused by incorporating the preferences
of the people alongside demographics may even fur-
ther diminish vaccine hesitancy and accelerate vacci-
nation rates.
3 SYSTEM MODEL
In this section, we discuss the system model for the
vaccine distribution problem. We are given a set E =
{e
1
,e
2
,...,e
n
} of n people required to be vaccinated.
We use a set P = {p
1
, p
2
,..., p
n
} of n non-zero posi-
tive integers to specify the priority of people for vacci-
nation purpose, where p
i
defines the priority level of a
person e
i
∈ E. The higher values of p
i
indicate higher
priority. A person with higher priority is desired to
get faster vaccination service. Let N represent the to-
tal number of available vaccines. We are given a set
H = {h
1
,h
2
,...,h
m
} of m vaccine distribution cen-
tres (DCs), i.e., hospitals. Let T be a set of time slots.
We denote T
j
as a set of available time slots provided
by the DC h
j
where T
j
⊆ T . Therefore, we can in-
fer that T = ∪
m
j=1
T
j
. Let B = {b
1
,b
2
,...,b
m
} be a
set of m positive integers where b
j
specifies the num-
ber of people can be vaccinated in each time slot in
h
j
. Each person e
i
∈ E provides a list L
i
of preferred
ICORES 2022 - 11th International Conference on Operations Research and Enterprise Systems
338

DCs including a set of preferred time slots from the
corresponding DCs. Hence, each element in L
i
in-
cludes a DC h
j
∈ H and a set T
i
j
⊆ T
j
of preferred
time slots from h
j
, i.e., each element of L
i
is defined
as {h
j
∈ H ,{T
i
j
⊆ T
j
}}. In this paper, we consider
the solution of the vaccine distribution problem in a
binary decision variable as x
i, j,k
∈ {0,1} where,
x
i, j,k
=
(
1, a person e
i
is assigned to h
j
at t
k
∈ T
j
;
0, otherwise.
4 OPTIMAL VACCINE
DISTRIBUTION MODELS
In this paper, we formulate the vaccine distribution
research problem as an Integer Linear Programming
(ILP) model. A DC h
j
can give vaccine to at most
| T
j
| ×b
j
number of people. We define the resource
utilization of a DC as the utilization rate of its total
capacity. Therefore, the resource utilization R
j
of a
DC h
j
is
R
j
=
∑
n
i=1
∑
t
k
∈T
j
x
i, j,k
| T
j
| ×b
j
. (1)
Our primary goal is to maximize the number of over-
all vaccinated people and maximize the minimum re-
source utilization of any DC among all DCs. How-
ever, in many cases, we aim to maximize the distribu-
tion of vaccines among the people with higher prior-
ity. Moreover, we may want to maximize the number
of vaccinated people assigned to one of their preferred
DCs and time slots. Thus, we propose two differ-
ent vaccine distribution ILP models: Priority-based
Model (PM) and Priority & Preference-based Model
(PPM).
4.1 Priority based Model (PM)
In this model, our goal is to maximize the distribu-
tion of vaccines among the people with higher prior-
ity and maximize the minimum resource utilization of
any DC among all DCs. Therefore, we formulate the
following optimization problem:
MAX
m
min
j=1
R
j
+
n
∑
i=1
m
∑
j=1
∑
t
k
∈T
j
p
i
× x
i, j,k
(2)
subject to,
m
∑
j=1
∑
t
k
∈T
j
x
i, j,k
≤ 1 ; ∀e
i
∈ E (3)
n
∑
i=1
x
i, j,k
≤ b
j
; ∀h
j
∈ H and ∀t
k
∈ T
j
(4)
n
∑
i=1
∑
t
k
∈T
j
x
i, j,k
≤| T
j
| ×b
j
; ∀h
j
∈ H (5)
n
∑
i=1
m
∑
j=1
∑
t
k
∈T
j
x
i, j,k
≤ N (6)
x
i, j,k
= {0,1}; ∀e
i
∈ E,∀h
j
∈ H and ∀t
k
∈ T
j
(7)
The constraint in equation (3) ensures that each per-
son can take at most one vaccine. The constraint in
equation (4) ensures that in a DC h
j
, at most b
j
peo-
ple can be vaccinated in each time slot. In equation
(5), we ensure that each DC h
j
can give vaccine to at
most | T
j
| ×b
j
people. The constraint in equation (6)
ensures that the total vaccine distribution should not
be more than the total number of available vaccines.
4.2 Priority & Preference based Model
(PPM)
In this model, our goal is to maximize the number
of vaccinated people with higher priority assigned to
one of their preferred DCs and time slots and max-
imize the minimum resource utilization of any DC
among all DCs. We define a preference score func-
tion f which takes a person e
i
, a DC h
j
and a time
slot t
k
as input and calculates the preference score for
assigning the person e
i
to the DC h
j
at the time slot
t
k
. The definition of the function f is
f (e
i
,h
j
,t
k
) =
2 + p
2
i
, if h
j
is in L
i
and t
k
∈ T
i
j
;
1 + p
2
i
, if h
j
is in L
i
and t
k
/∈ T
i
j
;
p
2
i
, otherwise.
We formulate the following optimization problem
MAX
m
min
j=1
R
j
+
n
∑
i=1
m
∑
j=1
∑
t
k
∈T
j
f (e
i
,h
j
,t
k
) × x
i, j,k
(8)
subject to the equations (3)-(7).
4.3 The Complexity of the PM and
PPM Optimization Problems
The PPM optimization problem is NP-hard, and we
can obtain the hardness result by reduction from the
Generalized Assignment Problem (GAP), which is
NP-hard (
¨
Ozbakir et al., 2010). In the generalized
assignment problem, we have given a set of n items
and m bins with a fixed capacity. For each bin, each
item has a profit and weight. The goal is to find the
maximum possible profit from a feasible item-bin as-
signment. In a viable solution, the total weight of
Optimal Models for Distributing Vaccines in a Pandemic
339
assigned items in a bin must not exceed its capac-
ity. If the profit and weight of an item do not vary
between different bins, then the generalized assign-
ment problem is reduced to the multiple knapsack
problem. Therefore, our proposed PM problem can
also be shown NP-hard by reduction from the mul-
tiple knapsack problem, which is NP-hard (Chekuri
and Khanna, 2005). Consequently, we can derive the
following theorem.
Theorem 1. The PM and PPM optimization problems
are NP-hard.
5 EXPERIMENTAL EVALUATION
In this section, we demonstrate the experimental re-
sults of our proposed models in two different sce-
narios. In the following, we show the performances
of our models on randomly generated datasets and
a real-world dataset from Thunder Bay, Ontario,
Canada. In all cases, we compare the results between
our two proposed models and show how PPM op-
timizes both priority and preference in each assign-
ment. We have used Gurobi (Gurobi Optimization,
LLC, 2021) optimization solver to solve the proposed
ILP models.
5.1 Random Simulation
In this experiment, we consider 320 people (| E |) for
vaccination in 5 different vaccine DCs and the total
number of available vaccines (N ) is 150. The details
of each vaccine DC are given in Table 1. We consider
five different priority groups P = {1, 2, 3, 4, 5} where
5 being the highest priority group and 1 being the low-
est priority group. To show the impact of the popula-
tion distribution and preference distribution, we use
two different distribution models in our random sim-
ulation; namely,
• Random-Simulation-1 (RS-1): Population and
preference lists of vaccine DCs are distributed us-
ing uniform random distribution.
• Random-Simulation-2 (RS-2): Population is
distributed into the five groups using the normal
distribution. Preference lists of vaccine DCs are
generated using a poisson like distribution where
h
3
and h
4
are likely to be chosen by most people.
In both models, the preference of time slots is chosen
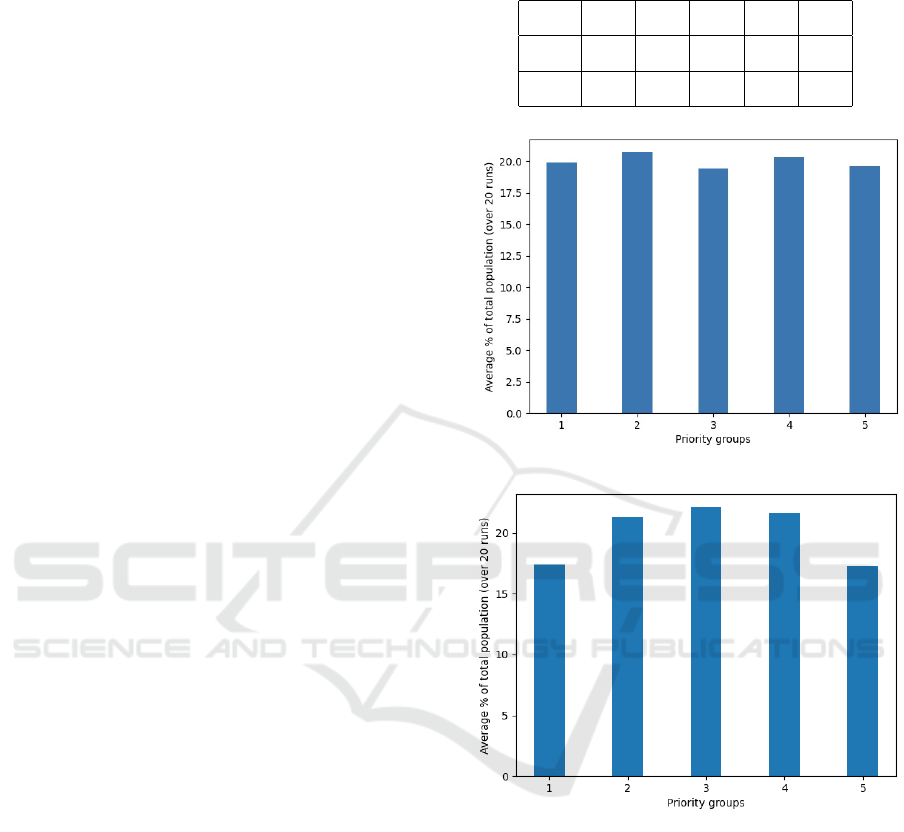
using a uniform random distribution. Figure 1 shows
the distribution of 300 people among 5 priority
groups for RS-1 and RS-2.
Table 1: No of time slots and maximum no of vaccination
in each time slot of vaccine DCs in the random simulation.
H : h
1
h
2
h
3
h
4
h
5
| T
j
| 20 15 20 25 10
b
j
2 1 3 2 1
(a) RS-1
(b) RS-2
Figure 1: Distribution of 300 people among 5 priority
groups in the random simulation.
Figure 2 and 3 show the distribution of assigned
people to their preferred DC and time slot by finding
an optimal solution for both PPM and PM for RS-1
and RS-2. In both random simulations, PPM assigns
around 80% of people to their preferred DC and time
slot because the model considers each person’s prior-
ity level and preference list in the objective function.
However, the priority-based model (PM) only consid-
ers the priority level of each people in the objective
function. Therefore, in this model, nearly 3% of peo-
ple are assigned to their preferred DC and time slot,
and most of the people are assigned to DCs and time
ICORES 2022 - 11th International Conference on Operations Research and Enterprise Systems
340
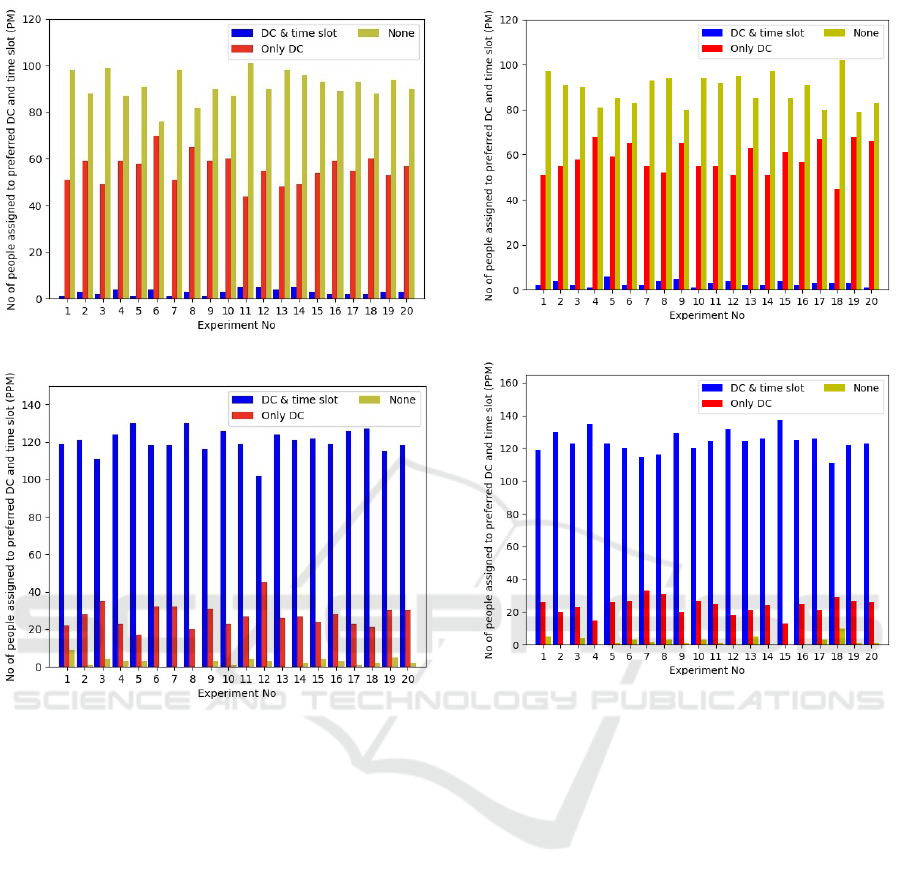
(a) RS-1 (PM)
(b) RS-1 (PPM)
Figure 2: No of people assigned to their preferred DC and
time slot in RS-1 (total 150 vaccinated people).
slots that are not in their preference list.
In Figure 4, we show the comparison between av-
erage and minimum resource utilization (percentage)
of the vaccine DCs in each experiment for the ran-
dom simulation. In both random simulations, the av-
erage resource utilization in PPM is slightly higher
than the average resource utilization in PM. More-
over, the minimum and the average resource utiliza-
tion rates are higher than 80% in all cases. Since the
objective functions maximize the minimum resource
utilization of any DC among all DCs in both PPM
and PM, both the models perform similarly in terms
of maximizing the minimum resource utilization.
Figure 5 shows the distribution of vaccinated peo-
ple among the 5 priority groups. The average per-
centage of vaccinated people in each group for both
PM and PPM is equal. In our objective functions, the
weight of priority is much higher than the weight of
the preference list. Therefore, in both models, people
(a) RS-2 (PM)
(b) RS-2 (PPM)
Figure 3: No of people assigned to their preferred DC and
time slot in RS-2 (total 150 vaccinated people).
in higher priority groups will always be vaccinated
before those in lower priority groups.
5.2 Case Study - Thunder Bay
In this experiment, we consider the COVID-19 vac-
cine distribution dataset from Thunder Bay, Ontario,
Canada. First, we use the 2016 census profile to get
the number of people in different age ranges (Census,
2019). Then, we divide the people into five priority
groups according to their age. In Table 2, we show
the distribution of the Thunder Bay population into
five priority groups. We consider 30 vaccine distribu-
tion centers where five of them are primary vaccina-
tion dispatch centers and others are local pharmacies
(cov, 2020). The primary distribution centers provide
vaccines to 8-9 people in each time slot, whereas local
pharmacies offer 1-2 people. We assume that a total
of 4000 vaccines are available for vaccination. The
preference list of DCs and time slots for each person
are generated using uniform random distribution.
Optimal Models for Distributing Vaccines in a Pandemic
341
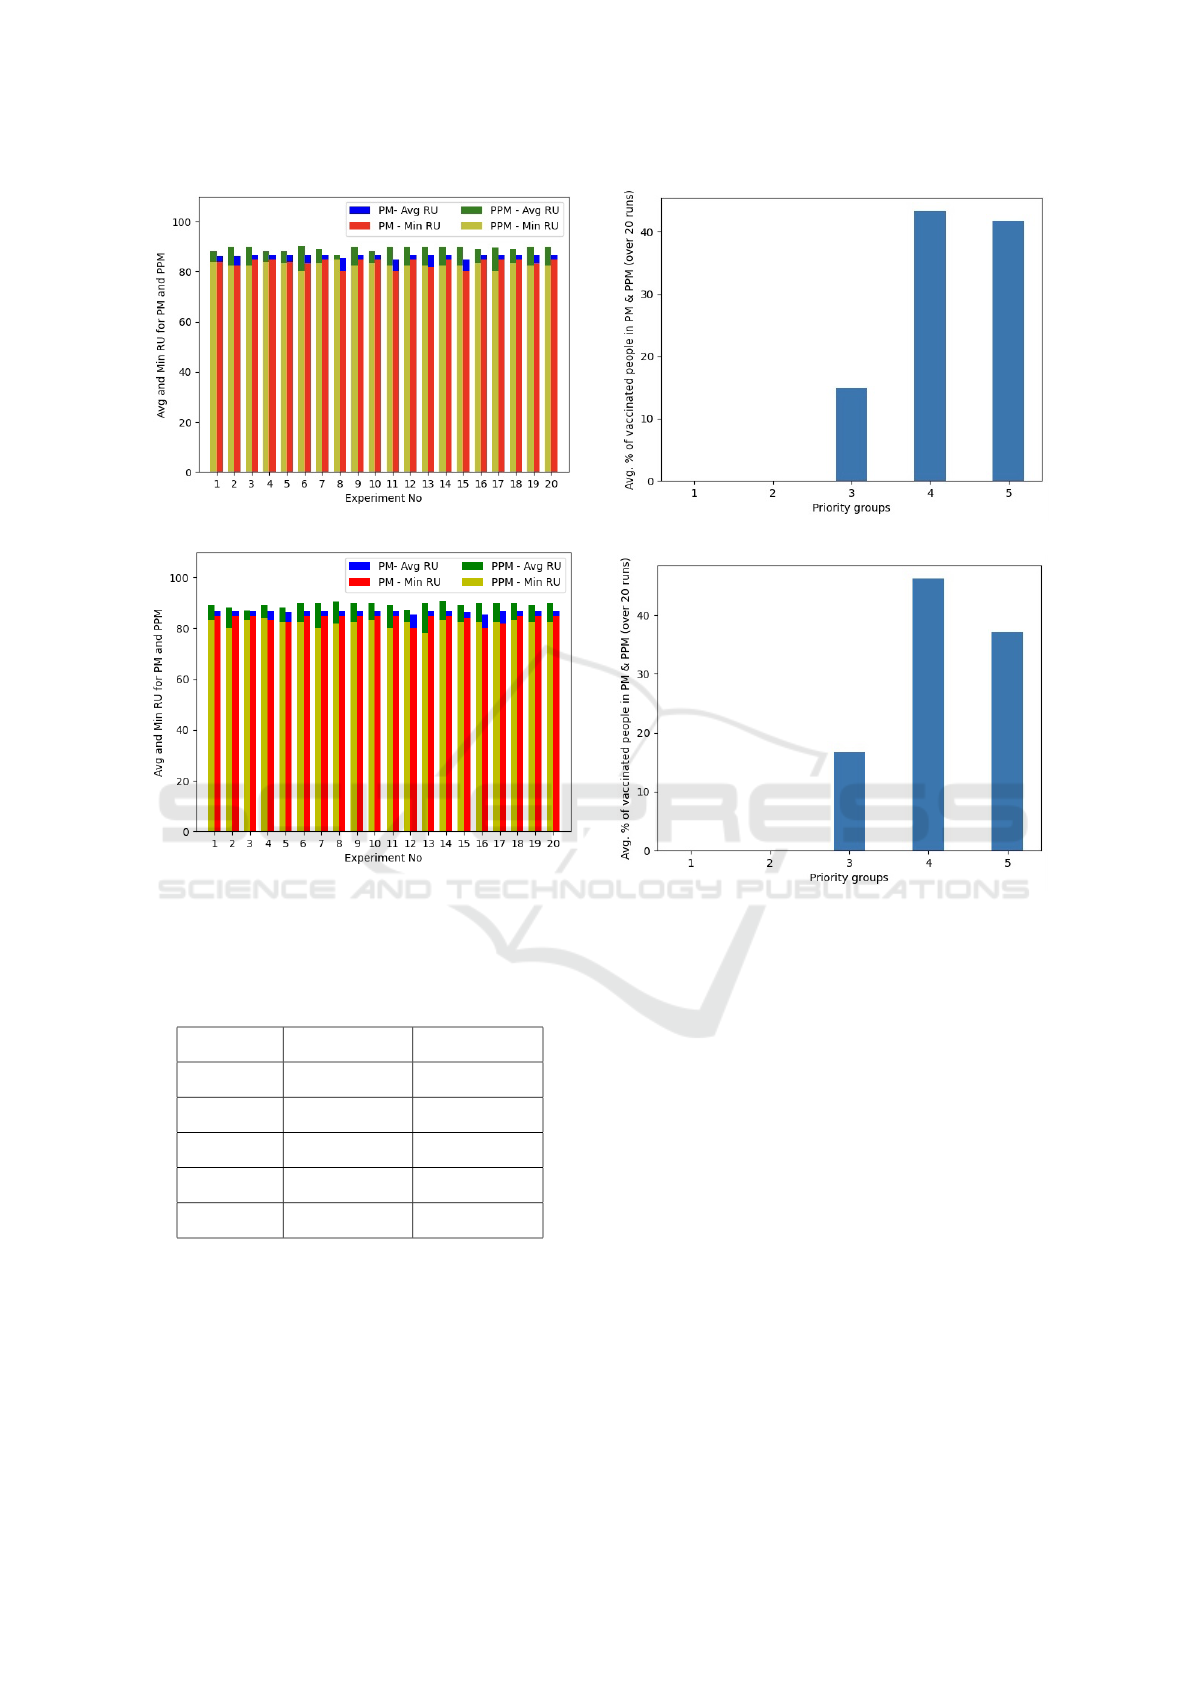
(a) RS-1
(b) RS-2
Figure 4: Comparison of average and minimum resource
utilization of the vaccine DC’s in random simulation.
Table 2: Distribution of Thunder Bay population into five
priority groups.
Group no Age range No of people
1 20-29 13160
2 30-39 10905
3 40-49 10990
4 50-59 14505
5 60 and above 26195
In Figure 6, we show the distribution of assigned
people to their preferred DC and time slot in opti-
mal solutions for both models. In our priority and
preference-based model, around 65% of people on
average are assigned to their preferred DC and time
slot. However, in only the priority-based model, only
7.5% of people are assigned to their preferred DC and
time slots. In this experiment, all the vaccine distri-
(a) RS-1
(b) RS-2
Figure 5: Distribution of vaccinated people among the 5
priority groups.
bution centres are filled to 100% capacity. Therefore,
their minimum and average resource utilization be-
come 100%. Since the no of people in group 5 is
much higher than the number of available vaccines,
only people from that group get vaccinated.
6 CONCLUSION
This paper proposes two optimization models (PM
and PPM) based on Integer Linear Programming
(ILP) framework to find optimal solutions for assign-
ing vaccination appointments for people while con-
sidering their priorities and preferences. In PM, we
aim to maximize the distribution of vaccines among
the people with higher priority. In PPM, our goal is
to maximize the number of vaccinated people with
higher priority groups by assigning appointments in
their desired locations and time slots. Moreover, in
both models, we maximize the minimum resource uti-
ICORES 2022 - 11th International Conference on Operations Research and Enterprise Systems
342

(a) PM
(b) PPM
Figure 6: No of people assigned to their preferred DC and
time slot in Thunder Bay dataset.
lization of any vaccine distribution center. Experi-
mental analysis on the random dataset and COVID-
19 vaccination dataset from Thunder Bay shows that
our proposed PPM outperforms PM in full-filling peo-
ple’s preferences while maximizing the distribution of
vaccines among the higher priority groups. Although
our proposed models can be adapted across various
scenarios for distributing any medicine among a mas-
sive population, we have shown a minimal number of
constraints in our models due to resource constraints.
In the future, depending on any specific scenario, our
models can be expanded by adding more real-world
constraints.
REFERENCES
(2020). Pharmacy vaccine locations. Available at:
https://covid-19.ontario.ca/vaccine-locations.
Ali, I. and Alharbi, O. M. (2020). Covid-19: Disease, man-
agement, treatment, and social impact. Science of the
total Environment, 728:138861.
Antal, C., Cioara, T., Antal, M., and Anghel, I. (2021).
Blockchain platform for covid-19 vaccine supply
management. IEEE Open Journal of the Computer
Society, 2:164–178.
Census (2019). Census profile, 2016 census thunder
bay, ontario. Available at: https://www12.statcan.
gc.ca/census-recensement/2016/dp-pd/prof/details/
page.cfm?Lang=E&Geo1=POPC&Code1=0935&
Geo2=PRCode2=35&SearchText=ThunderBay&
SearchType=Begins&SearchPR=01&B1=All&
GeoLevel=PR&GeoCode=0935&TABID=1&type=0.
Chekuri, C. and Khanna, S. (2005). A polynomial time ap-
proximation scheme for the multiple knapsack prob-
lem. SIAM Journal on Computing, 35(3):713–728.
Duijzer, L. E., van Jaarsveld, W., and Dekker, R. (2018).
Literature review: The vaccine supply chain. Euro-
pean Journal of Operational Research, 268(1):174–
192.
Emu, M., Chandrasekaran, D., Mago, V., and Choudhury,
S. (2021). Validating optimal covid-19 vaccine distri-
bution models. In International Conference on Com-
putational Science, pages 352–366. Springer.
Enayati, S. and
¨
Ozaltın, O. Y. (2020). Optimal influenza
vaccine distribution with equity. European Journal of
Operational Research, 283(2):714–725.
Grauer, J., L
¨
owen, H., and Liebchen, B. (2020). Strategic
spatiotemporal vaccine distribution increases the sur-
vival rate in an infectious disease like covid-19. Sci-
entific reports, 10(1):1–10.
Gupta, A., Evans, G. W., and Heragu, S. S. (2013). Sim-
ulation and optimization modeling for drive-through
mass vaccination–a generalized approach. Simulation
modelling practice and theory, 37:99–106.
Gurobi Optimization, LLC (2021). Gurobi Optimizer Ref-
erence Manual.
Hovav, S. and Tsadikovich, D. (2015). A network flow
model for inventory management and distribution of
influenza vaccines through a healthcare supply chain.
Operations Research for Health Care, 5:49–62.
Lin, Q., Zhao, Q., and Lev, B. (2020). Cold chain trans-
portation decision in the vaccine supply chain. Euro-
pean Journal of Operational Research, 283(1):182–
195.
Nicole, M., Alsafi, Z., Sohrabi, C., Kerwan, A., Al-Jabir,
A., Losifidis, C., Agha, M., and Agha, R. (2020). The
socio-economic implications of the coronavirus and
covid-19 pandemic: A review. International Journal
of Surgery, 78:185–193.
¨
Ozbakir, L., Baykaso
˘
glu, A., and Tapkan, P. (2010). Bees
algorithm for generalized assignment problem. Ap-
plied Mathematics and Computation, 215(11):3782–
3795.
Patel, R., Longini Jr, I. M., and Halloran, M. E. (2005).
Finding optimal vaccination strategies for pandemic
influenza using genetic algorithms. Journal of theo-
retical biology, 234(2):201–212.
Saif, A. and Elhedhli, S. (2016). Cold supply chain design
with environmental considerations: A simulation-
Optimal Models for Distributing Vaccines in a Pandemic
343

optimization approach. European Journal of Oper-
ational Research, 251(1):274–287.
Tan, S., Xu, J., and Panda, S. K. (2012). Optimization
of distribution network incorporating microgrid using
vaccine-ais. In IECON 2012 - 38th Annual Confer-
ence on IEEE Industrial Electronics Society, pages
1381–1386.
Worldometers (2021). Covid live update. Available at:
https://www.worldometers.info/coronavirus/.
Xiong, J., Lipsitz, O., Nasri, F., Lui, L. M., Gill, H., Phan,
L., Chen-Li, D., Iacobucci, M., Ho, R., Majeed, A.,
et al. (2020). Impact of covid-19 pandemic on mental
health in the general population: A systematic review.
Journal of affective disorders.
ICORES 2022 - 11th International Conference on Operations Research and Enterprise Systems
344
