
Optimization of Tracer Dose for Scintigraphic Imagery
C. Bousnah
1 a
, S. Anebajagane
2
, O. Monsarrat
2
, J.-Ph. Conge
1 b
, H. Maaref
1 c
and V. Vigneron
1 d
1
IBISC EA 4526, Univ. Evry, Université Paris-Saclay, France
2
Service de Médecine Nucléaire, CHSF, Corbeil, France
Keywords:
Machine Learning, Multi-modal Imaging, Precision Medicine, Myocardial Perfusion Scintigraphy, Dose
Optimization, Patient Radiation Protection.
Abstract:
Myocardial scintigraphy is a non-invasive isotope examination that has played a central role in the management
of these coronary heart diseases for decades.it has proven its performance in nuclear cardiology, mainly for the
diagnosis of ischemia by making it possible to analyze the myocardial perfusion, and precisely, to evaluate the
quality of the irrigation by the arteries and the coronaries, as well as for the diagnosis of coronary heart disease.
It is based on the injection of an intravenous radioactive tracer, which, once injected, is absorbed by the heart
muscle. The radiation emitted by the radioactive tracer is converted into an image by computer tomography.
However, these scintigraphic images suffer from poor spatial resolution in particular, in obese patients, it is
difficult to obtain images of sufficient quality using the recommended standard doses due to the attenuation of
γ−rays by soft tissues (fat, fibrous tissues, etc.). This phenomenon prompts the nuclear physician to overdose
the tracer and the dose of radiation received exceeds the admissible regulatory limits. In this paper we propose
a machine learning model that predict the dose of tracer based on patient’s morphological parameters to obtain
images of sufficient quality to support the cardiovascular diagnosis while exposing him to the lowest possible
doses of radiation. We show the body weight is not the best-predicting parameter for image quality.
1 INTRODUCTION
Myocardial scintigraphy has played a central role in
the management of coronary heart disease for decades
(Piekarski et al., 2020). Cardiovascular diseases are
responsible for 17.7 million deaths worldwide each
year, or 31% of deaths, causing nearly twice as
many deaths as cancer (Bonow et al., 2002). The
myocardiac perfusion scintigrahy (MPS) is a non-
invasive nuclear medicine imaging test that uses a
small amount of a radioactive tracer (usually Tech-
netium
99m
Tc but also Thallium
201
Tl or Rubidium
37
Rb) to detect any difference in blood flow in the
heart muscle at rest and during exercise. It is widely
used to assess the extent of damage to the heart, detect
myocardial structures in patients with chest pain, to
look for myocardial ischemia or small atypical symp-
toms, etc. (Nance et al., 2014). 80,000 people per
year undergo this examination in France.
a
https://orcid.org/0000-0002-2459-8284
b
https://orcid.org/0000-0002-8641-0312
c
https://orcid.org/0000-0002-2459-8284
d
https://orcid.org/0000-0001-5917-6041
The radioactive tracer
99m
Tc emits γ radiations
detected by a γ−camera which revolves around the
patient’s body. Once injected, the tracer is absorbed
by the heart muscle. Well-irrigated areas of the heart
will emit more γ−rays than less well-irrigated areas.
The images thus collected are put together to form a
3D image of the organ studied (see Fig. 1).
This assessment of myocardial perfusion can be
performed at rest and / or after a myocardial ischemia
challenge test (pharmacological stress or stress test).
Consequently, any relative fixation deficit will be
interpreted as a perfusion defect called hypoperfu-
sion which may correspond to ischemia or myocar-
dial necrosis (myocardial infarction) (Foraggi et al.,
2008).
However, these scintigraphic images suffer from
poor spatial resolution (a voxel ≈ 1 cm
3
) (Patton
and Turkington, 2008) and poor signal to noise ra-
tio (SNR). In particular, in obese patients, it is dif-
ficult to obtain images of sufficient quality using the
recommended standard doses due to the attenuation
of γ−rays by soft tissues (fat, fibrous tissue, etc.)
(Tamam et al., 2016). This phenomenon prompts the
nuclear physician to overdose the tracer and the dose
Bousnah, C., Anebajagane, S., Monsarrat, O., Conge, J., Maaref, H. and Vigneron, V.
Optimization of Tracer Dose for Scintigraphic Imagery.
DOI: 10.5220/0010822200003123
In Proceedings of the 15th International Joint Conference on Biomedical Engineering Systems and Technologies (BIOSTEC 2022) - Volume 4: BIOSIGNALS, pages 167-175
ISBN: 978-989-758-552-4; ISSN: 2184-4305
Copyright
c
2022 by SCITEPRESS – Science and Technology Publications, Lda. All rights reserved
167

Figure 1: Myocardial scintigraphy image visualized with
ITKSnap.
of radiation received exceeds the permissible regula-
tory limits. These limits have been specified by both
the High Authority for Health (HAS) and the Nuclear
Safety Authority (NSA) for the sake of radiation pro-
tection: 1 mSv per year (sum of effective doses) for
the public. There are also regulatory limits for ioniz-
ing radiation for workers and staff: 20 mSv per year
(sum of the effective doses). Exceeding doses may
increase the risk of cancer from radiation. The rec-
ommendations of the European Association of Nu-
clear Medicine (EANM) specify that the dosage of
the common tracer
99m
Tc should be calculated by the
specialist only on the basis of weight. However, the
attenuation of the scintigraphy images is above all in-
fluenced by the thickness of the tissues (muscle fibers,
fatty tissues, bones, etc.) to be passed through, in par-
ticular in obese patients.
The dose of radio-tracer to be administered is
a compromise between image quality and radia-
tion exposure and depends on patient characteristics
(e.g.body weight), choice of radio-pharmaceutical
(
99m
Tc or
201
Tl compounds), acquisition protocol (1
day or 2 days protocols, imaging time, image reso-
lution, gated acquisition), and the type of equipment
(multiple head scintillation camera or a camera based
on cadmium zinc telluride (CZT) detectors). Thus,
the objective of this work consists in proposing a
"finer" dosage, based on the body mass index (BMI),
and other morphological factors to be determined,
easily identifiable by the doctors before the examina-
tion and which will allow the injection tracer to be
optimally calibrated, thus limiting patient’s exposure
to radiation while ensuring sufficient image quality.
In the following section, we take stock of the state
of the art on the assay of tracers dosage. Section 3 de-
tails the data collected for this experiment. Section 4
provides a methodology for predicting tracer dose and
image quality and a discussion on the main results.
2 A SHORT REVIEW OF TRACER
DOSAGE CALCULUS
Van Dijk et al. (2014) disclose a method to compen-
sate for the decrease in image quality in obese patients
by administering a patient-specific dose in myocardial
perfusion imaging using a tomographie par émission
monophotonique (SPECT) camera based on CZT de-
tectors
1
. The study was carried out on 148 patients.
This article proposes in particular a method for deriv-
ing a dose of tracer to be administered depending on
the body-weight or scan-time protocol by calculating
(Van Dijk et al., 2014):
d
admin
=
CW
−b
K
aT
scan
, (1)
wherein C is the photon count, P is the body weight,
K is the correction factor for the radioactive decay
between the administration of tracer dose and the
SPECT acquisition, T is the scanning time, a and
b are adjustment parameters. The measured photon
numbers were normalized based on the administered
tracer dose and the scan time were correlated with
body weight, body mass index to find the best pre-
dictor. From these data, a protocol to provide consis-
tent image quality was validated in 125 new patients.
Van Dijk et al. (2014) claim that weight was the main
morphological parameter of the patient despite it is
not a good indicator of the distribution of fat mass,
especially around the heart.
(Gimelli et al., 2017) develop a software for
automatic calculation of pediatric dosage of radio-
pharmaceuticals, according to European Association
of Nuclear Medicine (EANM) 2007 pediatric dosage
card. This card is based upon the publication by Ja-
cobs et al. (2005) who show that normalization fac-
tors for effective dose can be estimated accurately as
a function of body weight W by holding only one pa-
rameter, called the ’a’ value.
Dogan et al. (2019) assess the validity of auto-
mated quantitative and semi-quantitative visual analy-
sis of total perfusion deficit using SPECT γ−camera
to detect significant coronary artery disease. Zhang
et al. (2015) investigate image quality, radiation dose,
and diagnostic performance of prospectively ECG-
triggered high-pitch coronary CT angiography at 70
kVp compared to invasive coronary angiography as
reference standard. Their protocol results in an ef-
fective radiation dose of 0.2 mSv and high diagnos-
tic accuracy for stenosis detection in a selected, non-
obese population. Gould et al. (2008) compare on
a total of 250 consecutive patients resting perfusion
1
This camera is specially dedicated to the the heart ex-
amination.
BIOSIGNALS 2022 - 15th International Conference on Bio-inspired Systems and Signal Processing
168
images reconstructed using rest CT attenuation data
with the same resting emission data reconstructed
with post-stress CT attenuation data. No clinically
significant differences were observed. And eliminat-
ing rest CT scan reduces CT radiation dose by 50%.
Kero et al. (2021) suggest too that stress-first per-
fusion imaging (PI) using
99m
Tc tracer can signifi-
cantly reduce the radiation dose compared with stan-
dard dose rest–stress protocols. If the stress PI re-
sults are normal (Duvall et al., 2011). Hamilton-Craig
et al. (2019) examine the impact of dose reduction
techniques using ECG-triggering, kVp/mAs reduc-
tion and high-pitch modes on radiation exposure in a
Australian hospital. 3,000 coronary CT angiography
were analyzed with mean radiation dose decreasing
from 8.4 mSv to 2.8 mSv per year. Implementation of
dose reduction algorithm and staff education program
resulted in a 67% reduction in radiation exposure,
while maintaining diagnostic specificity. Chinnaiyan
et al. (2013) show that the use of newer scanner tech-
nology resulted in incremental radiation dose reduc-
tion in a statewide coronary CT angiography registry
without image quality degradation.
3 MATERIALS
This experimental study is based on two recent
databases which were retrieved from the nuclear
physicians from Hôpital sud-francilien (CHSF).
3.1 Chest Database
The first database contains CT scans and myocardial
scintigraphy images of 130 patients with cardiovascu-
lar pathology, recorded using a Siemens Symbia T2
SPECT CT γ−camera on the upper part of the pa-
tient’s body (chest part). Thus, the physiological pa-
rameters of the patient and the metadata of the images
(resolution, image size, image rotation, date / time,
sex, age, weight, height, BMI, etc.) were recorded.
The scintigraphy images were taken in the nu-
clear medicine department of the CHSF, after the
patient was injected with a radioactive tracer (Tech-
netium
99m
Tc), which binds to the heart. Next, a
NaI γ−camera
2
captures the photons emitted by the
tracer and rotates around the patient’s body so that
the images collected are grouped together to form a
3D image of the heart (Fig. 1). Most of the examina-
tions were carried out after a stress test that stimulates
the myocardium which better absorbs the radioactive
tracer (in terms of speed and homogeneity). Depend-
2
Thallium-doped sodium iodide.
ing on the result of this test, another test at rest may
be necessary to improve the image quality.
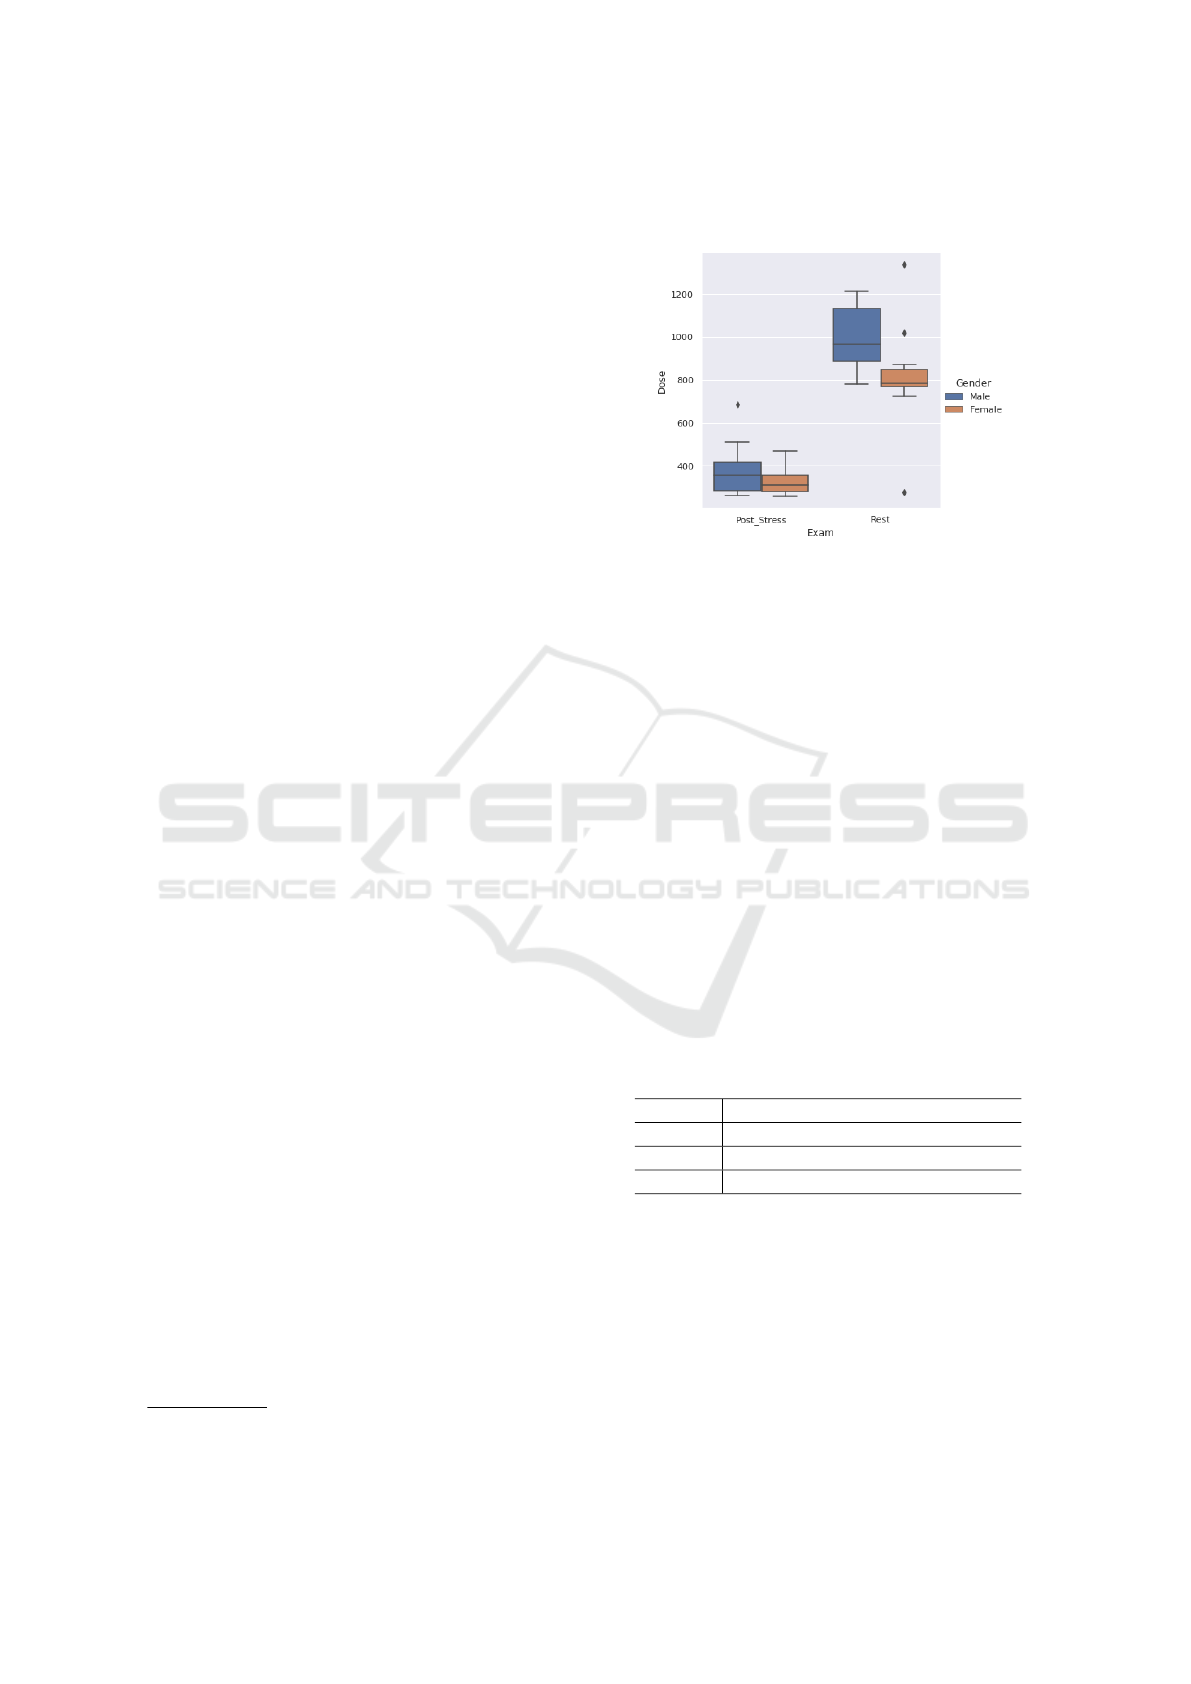
Figure 2: Boxplot of tracer dose with respect to sex and type
of exam.
An Excel file containing information about the
patient (sex, age, weight, height, BMI) was also pro-
vided with the doses used during the examination,
as well as the image grade noted by the doctors be-
fore and after correction by the CT scanner. NCIQ
and CIQ stand resp. for non-corrected and corrected
image quality (Tab.3). The nuclear physician has in
fact the possibility of improving manually with a few
manipulations to improve the quality of the image in
order to improve the estimation of the dosage of the
tracer.
The chest database contains 58 men and 38
women aged from 43 to 93 y.o., 104 of them have
done a post stress exam and 26 a rest exam. The fig-
ure 2 represents the distribution of the dose according
to the examination type and to the gender. The mean
dose is significantly different in the post-stress and the
rest groups (Kero et al., 2021).
Table 1 summarizes the main statistics of patients.
Table 1: Chest dataset patient statistics.
variable min mean max std error
age 43 69.15 93 1.07
BMI 17 29.11 43 0.44
dose 257 478.45 1337 27.26
Most of the images before correction are of poor
quality. Figure 4 shows the distribution of uncor-
rected image quality (IQ) by examination type (rest
or post-stress). IQ stands for the image quality anno-
tated by doctors ; it is an ordinal qualitative variable
with 5 modalities IQ
i
, i = {1, 2, 3, 4, 5}, IQ
1
being
the highest grade to the lowest IQ
5
.
Optimization of Tracer Dose for Scintigraphic Imagery
169
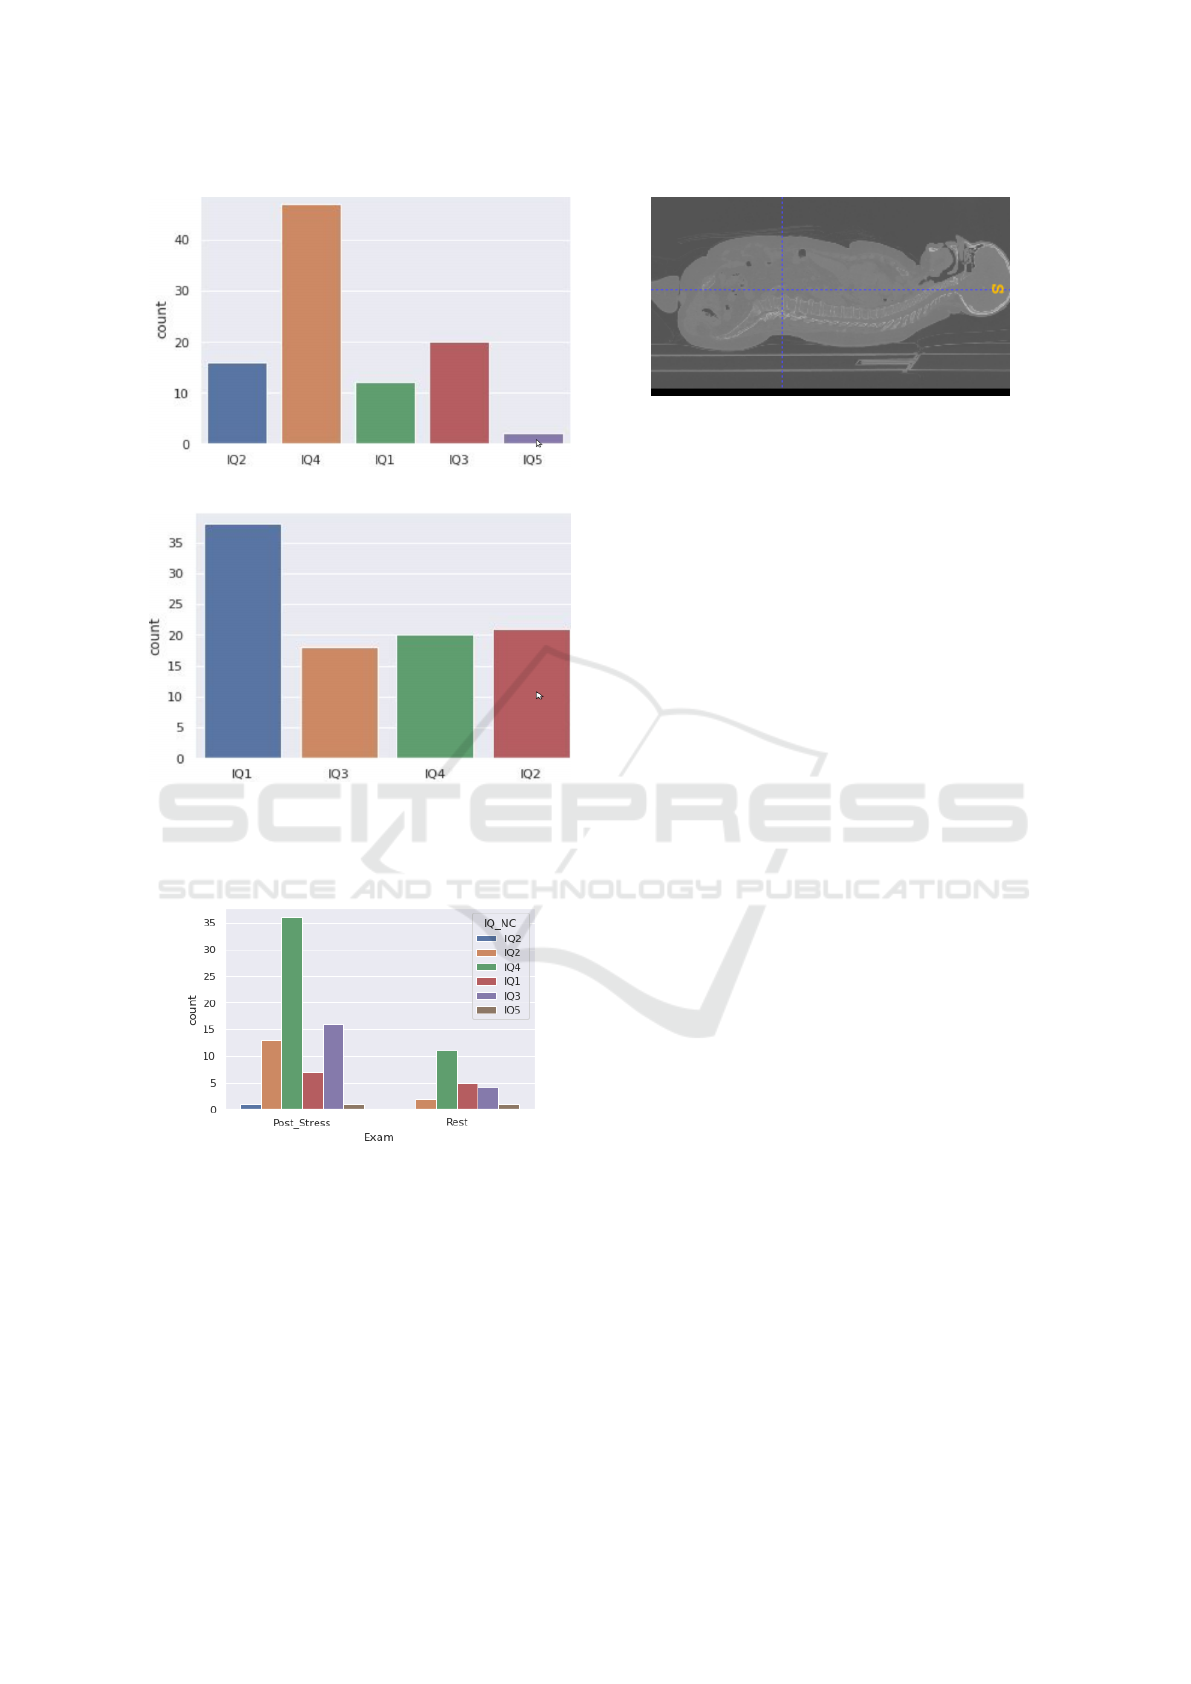
(a) non corrected image quality (NCIQ) distribution
(b) corrected image quality (CIQ) distribution. After image
correction, the last IQ class disapear.
Figure 3: IQ distribution. From IQ
1
(high quality) to IQ
5
(poor quality).
Figure 4: Distribution of image quality before correction
according to the examination type.
3.2 Full-body Database
The second database contains full body scans of
247 patients acquired from examinations for other
pathologies, using PET CT GE HealthCare Discov-
ery 710 (Fig. 5). This database was used to design
a model capable of predicting the abdominal perime-
ter which is not visible on the CT scans of the first
database (see section 3.1). For example, Fig. 5 de-
picts a patient scan with 780 CT slices. The approxi-
Figure 5: Full body CT scans viewed with ITKsnap.
mate intervals of the different upper body parts (tho-
rax, diaphragm and abdomen) are determined manu-
ally using ITKsnap: thorax is located between 450-
600, diaphragm between 430-460, abdomen between
200-430. The data is in DICOM format. The CT sec-
tions are 512×512 pixels, the scintigraphic images
are 128×128×128. The volume of the 1st database
is 12 GiB, the second 114 GiB.
4 METHODS
4.1 Calculus of Abdominal Perimeter
We propose an algorithm based on morphological fac-
tors of the patient, easily identifiable by doctors be-
fore the examination, which makes it possible to opti-
mize the quantity of radioactive tracer while ensuring
the good image quality.
The proposed morphological factors are: (a) sex
(b) age (c) body mass index (the weight/height
2
ratio)
(d) thoracic perimeter (e) abdominal perimeter. The
parameters (a-c) are provided by doctors in the pa-
tient’s medical record. The thoracic and abdominal
perimeters are not measured in the clinical practice;
one of the objectives of this work is to decide if these
parameters are relevant for the choice of the optimal
dose. To extract these two perimeters from the CT
scans, we had to segment the region of interest, so
that we keep the part of the body and we eliminate the
chassis. For this, we used a hysteresis thresholding,
followed by a morphological opening, i.e.an erosion
followed by a dilation (Serra, 1983).
In the hysteresis thresholding technique, the high
threshold represents the most significant pixels of the
image which, in our case, correspond to the rib cage
bones (Fig. 6). The lower threshold highlights the
weaker pixels that are connected with the stronger
ones. The threshold values are determined by trial
and error.
After the hysteresis thresholding, some noise re-
mains on some images (see Fig. 7a). To clean it, we
BIOSIGNALS 2022 - 15th International Conference on Bio-inspired Systems and Signal Processing
170
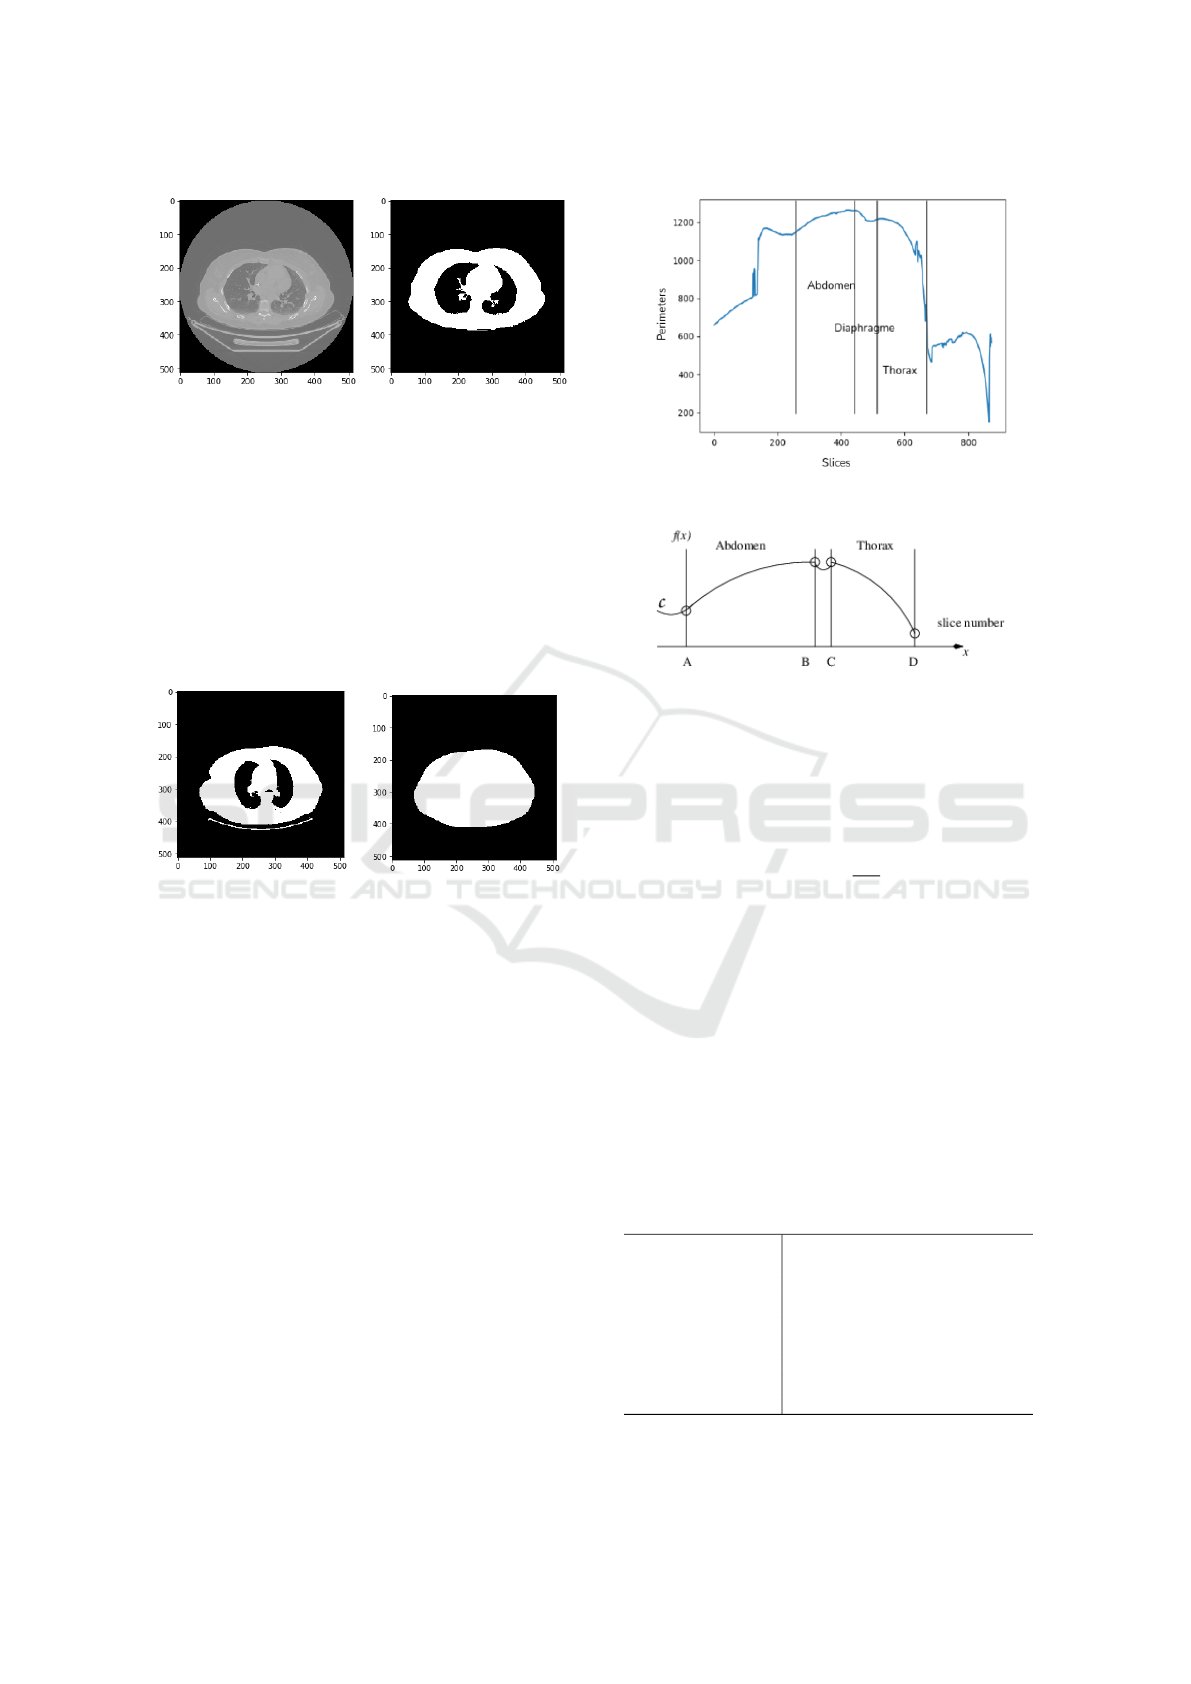
(a) Visualization of a CT
slice.
(b) Hysteresis thresholding.
Figure 6: Thoracic scan segmentation using Pydicom, a
Python package for working with DICOM files.
used morphological filtering named opening. Next,
we determined the convex hull of the segmented re-
gion, because the thoracic perimeter does not exactly
follow the shape of the rib cage (Fig. 7b). Finally, we
calculated the convex perimeter that we recorded in a
csv file. This operation is repeated automatically for
all scans for each patient.
(a) Hysteresis threshold (b) Convex hull
Figure 7: Extraction of the perimeter.
For CT scans that only contain the thoracic part of
the body, the maximum of the calculated perimeters is
considered the thoracic perimeter. Since those scans
do not include the patient’s abdominal part, we set up
a training model that predicts the abdominal perime-
ter from the chest perimeter using whole body images
(Fig. 5). First, the entire body perimeters from the
CT scans are extracted for each patient as depicted in
Fig. 8a, producing the graph C in function of the slide
number k.
Here comes a first difficulty: the number of each
patient’s slices is proportional to the patient’s height
which makes it difficult to localize exactly the thorax
dimension. The total number of slides varies between
705 and 1120 on the whole data set. In the figure 5
for example, 780 CT slices define the patient upper
body. ITKsnap is used to determine automatically
the thoracic and abdomen part the interval I
T
, respec-
tively I
A
, occupied by the thorax, resp. the abdomen,
as in Figures 8a and 8b. I
T
and I
A
are delimited with
bullet points corresponding to the inflection points in
(a) Raw graph obtained from the perimeters of the
convex hull of the CT slices.
(b) Approximate form of the graph 8a. The inter-
vals are delimited with bullets that correspond to
curvature change points in the graph.
Figure 8: Graph of the upper-body perimeters.
C. Consider that the function f(x) of graph C is lo-
cally 2 times continuously differentiable. The inflec-
tion points are those where the second derivative van-
ishes by changing of sign, i.e.
∂
2
f
∂x
2
= 0. The same pro-
cedure is applied to all the patients. The approximate
intervals of the different parts are I
T
= [450 : 600]
for the thorax and I
A
= [200 : 430] for the abdomen.
The second step consists in developing a learn-
ing model that predicts the abdominal perimeter from
the thoracic perimeter, sex, age, size and BMI (see
Fig. 11). So, we separate the database into 3 sub-
bases: learning, validation and test bases representing
resp. 65%, 15% and 20% of the samples. For more
details on neural networks, refer to Bishop (2006).
The table 2 summarizes the characteristics of the pro-
posed neural network.
Table 2: Neural network’s architecture to predict abdominal
perimeter.
Inputs thoracic perimeter P
Th
, sex,
age, height,BMI
hidden neurons 10
activation function ReLU
optimizer Adam
Loss MSE
Batch 7
Epoch 250
Output abdominal perimeter P
Abd
Optimization of Tracer Dose for Scintigraphic Imagery
171
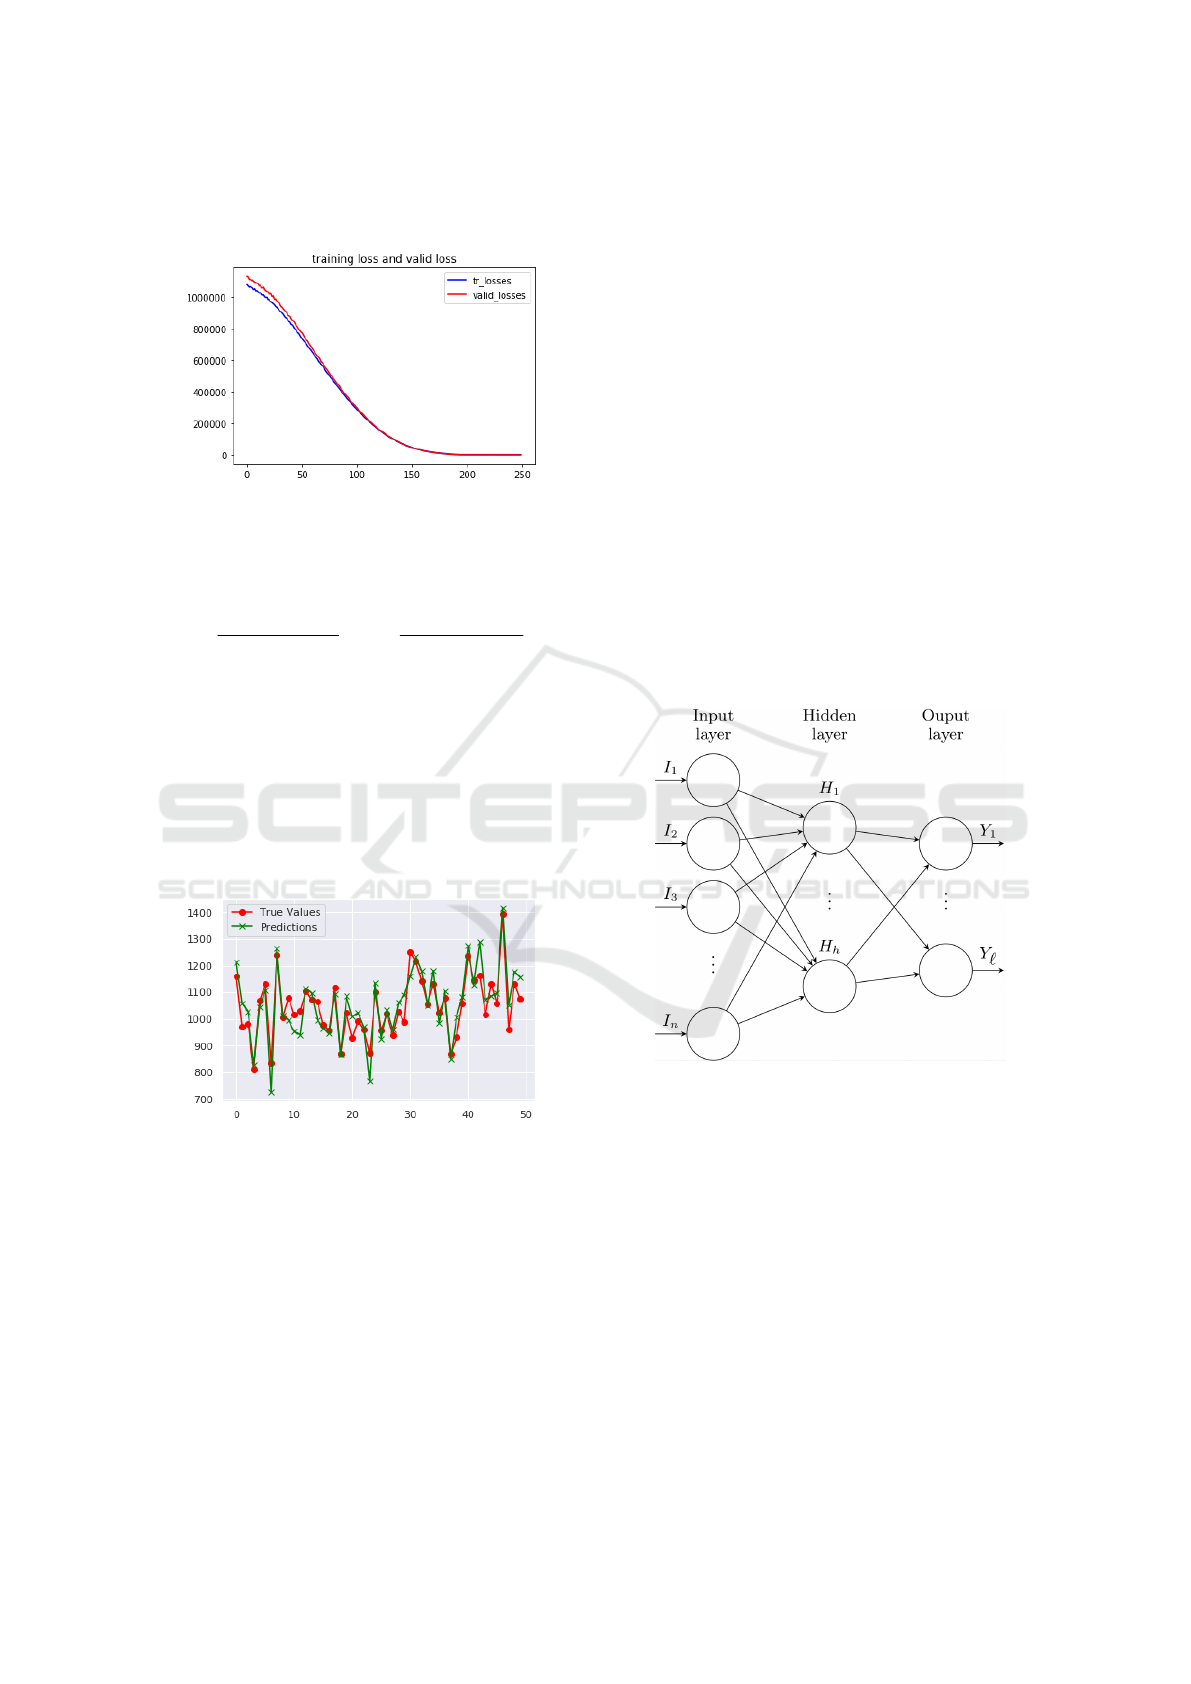
The learning and validation loss decreases to sta-
bility as shown in the figure 9.
Figure 9: Learning and validation losses.
To evaluate the model accuracy, we used the co-
efficient of determination R-square defined, for uni-
variate series as follows :
R
2
=
P
N
i=1
(
ˆ
Y
i
−
¯
Y )
2
P
N
i=1
(Y
i
−
¯
Y )
2
= 1 −
P
N
i=1
(Y
i
−
ˆ
Y
i
)
2
P
N
i=1
(Y
i
−
¯
Y )
2
, (2)
where Y
i
,
ˆ
Y
i
,
¯
Y are, for this model, resp. the es-
timated, expected and mean abdominal perimeters.
The model performances were evaluated on the test
dataset. The R
2
is 83%, and Pearson’s product-
moment correlation coefficient (or Pearson correla-
tion coefficient, for short) which measure of the
strength of a linear association between predicted and
expected abdominal perimeters, resp.
ˆ
P
Abd
and P
∗
Abd
is 91.11%.
Figure 10: Perimeter values predicted by neural network
regression / real values (50 patients).
4.2 Optimization of the Amount of
Administered Radiotracer Dosage
Unlike conventional guidelines suggesting consider-
ably large dosage levels for obese patients (Karakatsa-
nis et al., 2015), the objective of this study is to mod-
erate dosage for obese patients and dosage reduction
for slimmer patients which are usually based on the
only patient weight. In this section the relevance of
the abdominal perimeter for optimizing tracer dose is
evaluated. The proposed model is designed to help
doctors to choose the best dose / image quality re-
sponse model. We propose utilizing a neural network
model to predict the radioactive tracer dose accord-
ing to the type of examination performed (post stress
or at rest), and according to the IQ, i.e.NCIQ ver-
sus CIQ, plus other morphological parameters (age,
weight, height, BMI, abdominal perimeter). How-
ever, the limited understanding of which physiolog-
ical model is the least biased for the prediction of
radiotracer dosage increases attrition in the decision-
making process. There are several possible causes for
the inconsistencies between predictive and empirical
dosage: patient obesity, differences in metabolic rates
for the same radiotracer, routine practice, equipment
technical evolutions, etc.
Differences in metabolism and anatomical bar-
riers can be challenging to predict and minimize.
Notwithstanding, it is possible to improve predictive
dosage models if the known inaccuracies result from
systematically modeling over- or underestimations,
rather than unpredictable spurious causes.
Figure 11: A shallow network with d inputs, h hidden neu-
rons and ` outputs.
Table 3 summarizes the characteristics of the pro-
posed neural network. The Adam optimizer is used
for training the network with a learning rate equal to
0.001.
We were careful not to include the weight in the
dependent variables (inputs) in Tab. 3 since, in the
database, the doses of tracer were calculated by the
doctors from the weight. Obviously using BMI or
weight in our model would have biased the results,
so they were deliberately omitted.
To measure the relevance of each parameter for
dose prediction, we tested different combinations of
inputs among which age, P
Th
, P
Abd
, sex, type of ex-
amination (post-stress versus rest).
BIOSIGNALS 2022 - 15th International Conference on Bio-inspired Systems and Signal Processing
172
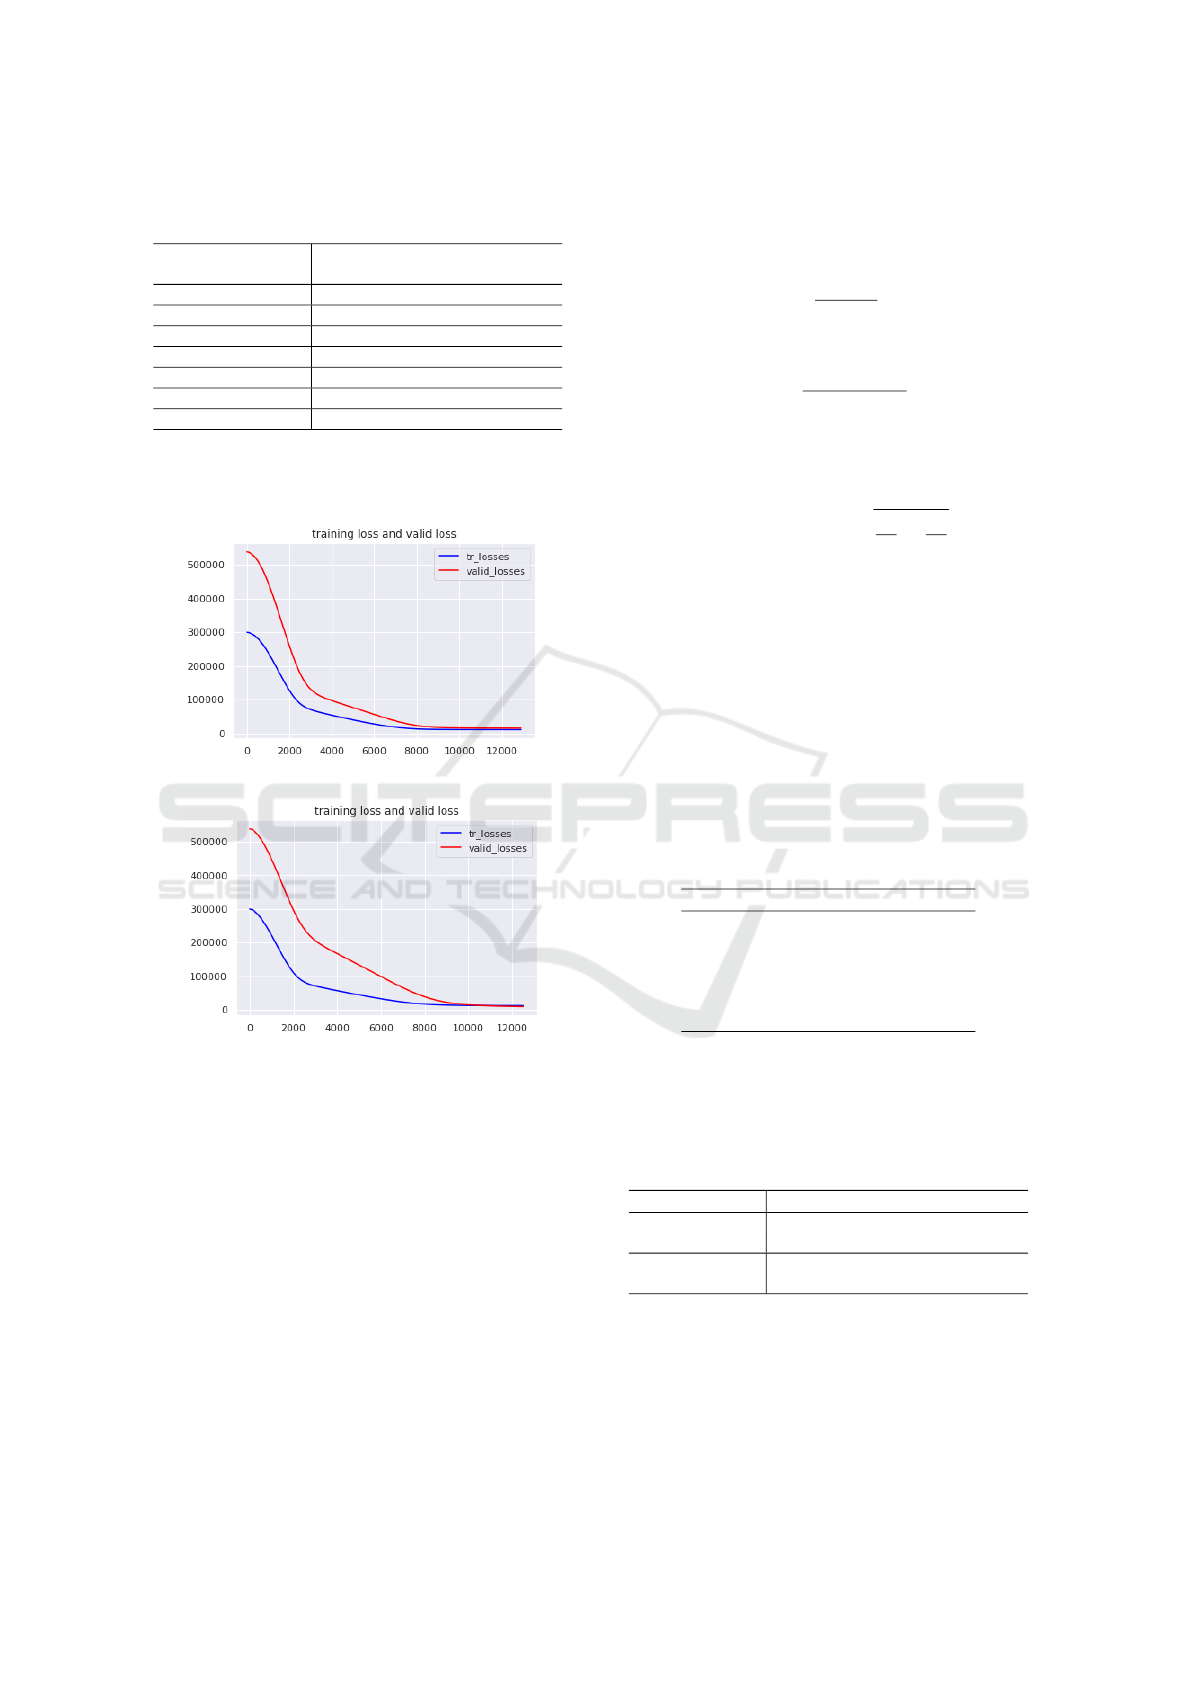
Table 3: Neural network’s architecture to predict tracer
dose.
Inputs thoracic abdominal P
Abd
, sex,
age, height
hidden neurons 12
activation function ReLU
Optimiser Adam
Loss MSELoss
Batch 7
Epoch 12,500
Output Dose
After 12,500 epochs of training, the estimator net-
work converges; the learning and validation losses de-
crease to stability as shown in the figure 12.
(a) Corrected images.
(b) Non corrected images.
Figure 12: Learning curves of dose prediction model with
corrected images and uncorrected images.
The model was evaluated on never-before-seen
data from the test base which contains (only) 14 pa-
tients due to the short size of the database. The fig-
ure 13 represents the dose values predicted by the
neural network versus to the real values for corrected
images and for non corrected images.
It is possible to stratify the administered dose by
the type of examination status because the latter is
suspected to account for the response variable. The
summary statistics are discernably different than they
would be for unstratified data. A between groups z-
test is used to compare the results in the rest and post-
stress groups. The null hypothesis with the between
groups z-test is that the R
2
scores in the two groups
are equal in the population p
1
= p
2
where p
1
and p
2
are the R
2
scores for the two groups. z-value is the
ratio:
z =
p
1
− p
2
se
, (3)
where ’se’ represents the sampling variability, p
12
the
pooled sample R
2
score:
p
12
=
n
1
p
1
+ n
2
p
2
n
1
+ n
2
, (4)
with n
1
= 36 and n
2
= 94 the sample sizes for each
of the two groups. The standard error of the sam-
pling distribution difference between the two propor-
tions is:
se = p
12
(1 − p
12
)
r
1
n
1
+
1
n
2
. (5)
The null hypothesis was rejected with a p-value of
0.0028 assessing the prediction dose is better pre-
dicted in the post-stress group than in the rest group.
The R
2
scores given in Tab. 4 and calculated
from Eq. (4), merge the response variables of the
strata/groups. Thoracic or abdominal perimeters
combined with age or the type of examination give
very good scores. Combining all morphological pa-
rameters as inputs gives R
2
scores of 91,56% with
corrected image quality, and 89,81% with non cor-
rected image quality.
Table 4: Predicted R
2
scores for some combinations of in-
puts of corrected images.
Inputs R
2
score
BMI, type_exam 90,33%
P
Th
, type_exam 88,35%
P
Abd
, type_exam 87,39%
age, P
Th
, type_exam 91,56%
age, sex, P
Th
, type_exam 89,14%
age, P
Abd
, type_exam 90,82%
Table 5 gives the scores obtained for some com-
binations of input parameters in the case of corrected
images and non corrected ones.
Table 5: Predicted R
2
scores for corrected/uncorrected im-
ages.
Inputs R
2
score
corrected
image
age, P
Th
, type_exam 92,42%
age, type_exam 92,16%
uncorrected
image
age, P
Th
, type_exam 90,73 %
age, type_exam 90,71 %
4.3 Prediction of the Image Grade from
the Tracer Dose
Finally, a last study is presented in this section, i.e.a
new model capable to predict the image quality based
Optimization of Tracer Dose for Scintigraphic Imagery
173
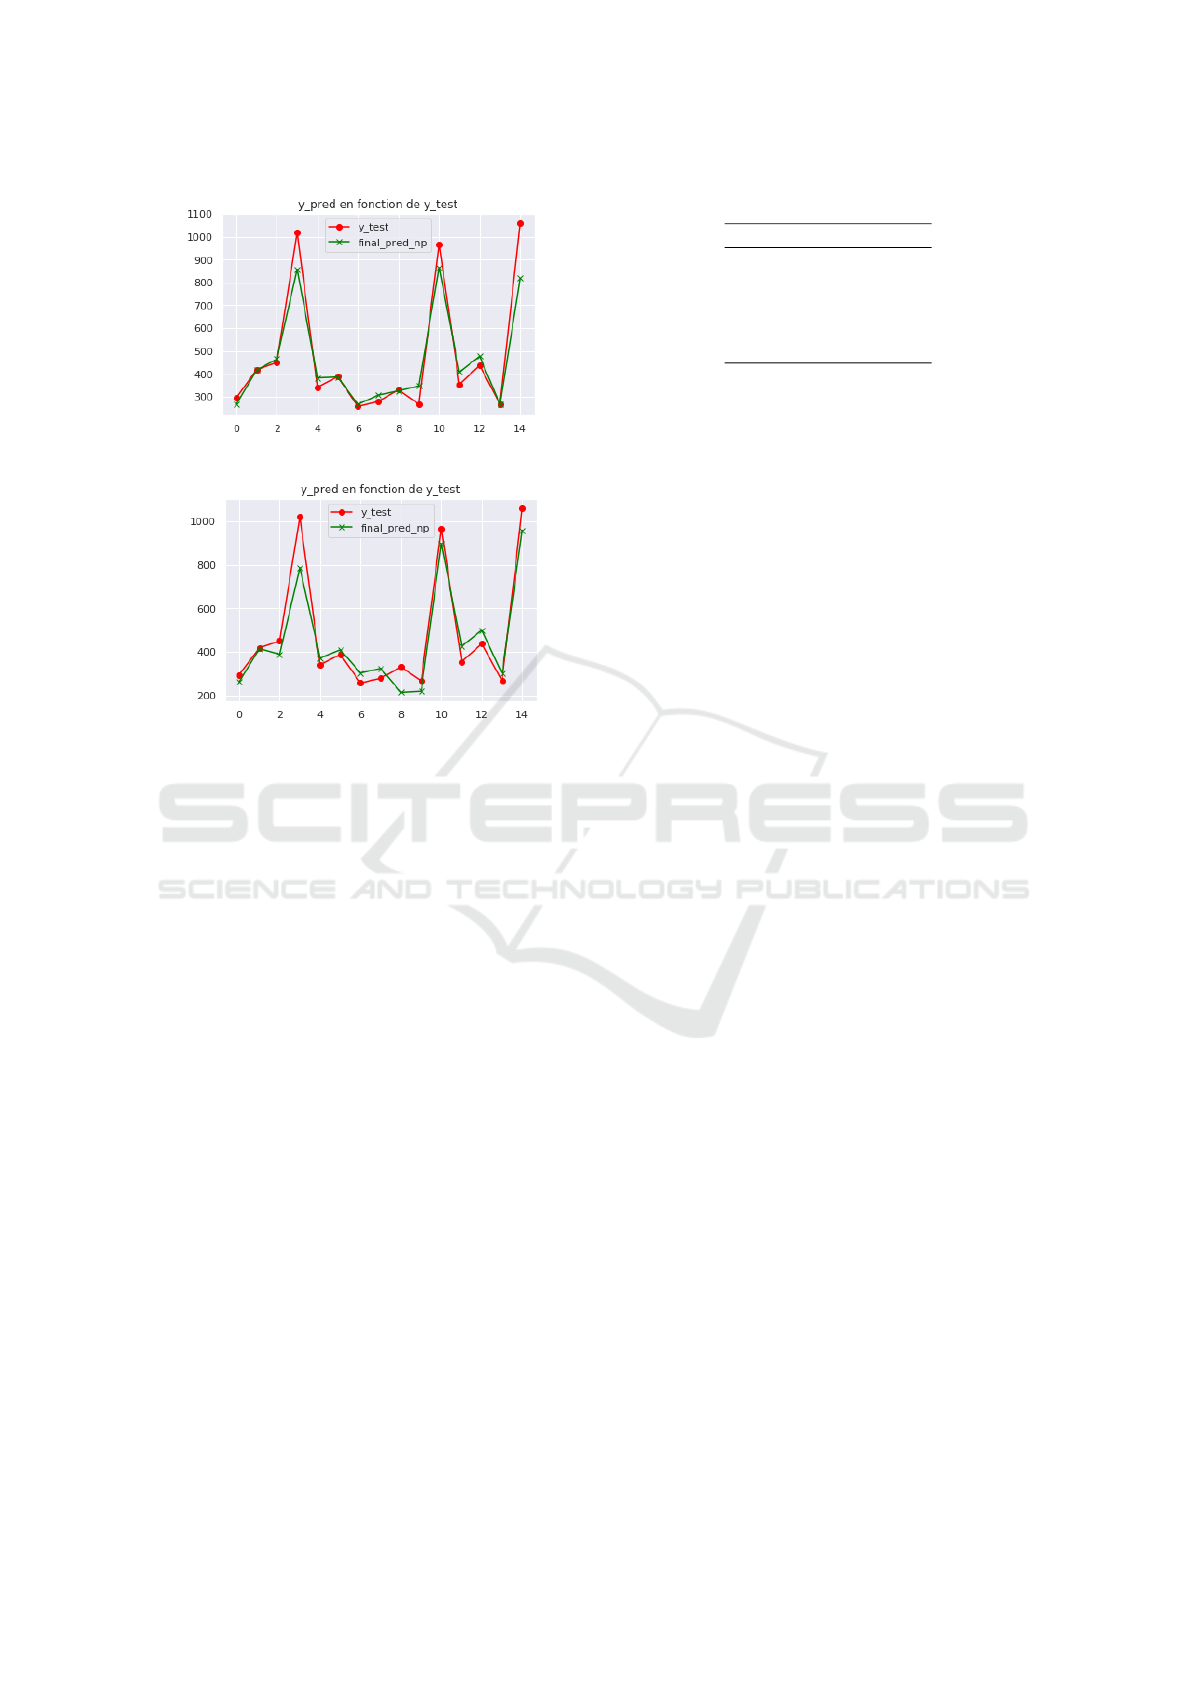
(a) Results for corrected images.
(b) Results for non corrected images.
Figure 13: Predicted radiotracer dose by the neural network
model versus expected values (14 patients).
on age, P
Th
, P
Abd
, sex, type of examination.
It is typically a multi-class problem ith N=130 ob-
servations and K = 5 classes IQ
i
, i = 1, . . . , 5.
Classifier performance is typically defined according
to the confusion matrix associated with the classifier.
Based on the entries of the matrix, it is possible to
compute sensitivity (recall), specificity, and precision.
In the following we will use T P
i
, F P
i
and F N
i
to
resp. indicate true positives, false positives, and false
negatives in the confusion matrix associated with the
i-th class. Precision and recall are indicated resp. by
P and recall by R.
A confusion matrix for every class C
i
, i ∈
{1, . . . , 5} is computed such that the i-th confusion
matrix considers class C
i
as the positive class and all
other classes C
j
with j 6= i as the negative class.
Each confusion matrix pools all observations labeled
with a class other than C
i
as the negative class. Ta-
ble 6 summarizes the performances across all classes.
These data indicate that, overall, performance is quite
high. However, our hypothetical classifier underper-
forms for individual classes such as class IQ
2
(preci-
sion) and class IQ
5
(both precision and recall).
Table 6: Overall performance of the neural classifier.
Class P R
IQ
1
0.945 0.777
IQ
2
0.562 0.900
IQ
3
0.833 0.666
IQ
4
0.793 0.920
IQ
i
0.166 0.200
4.4 Discussion
Decreasing image quality in heavier patients can be
compensated by administration of a patient-specific
dose in myocardial perfusion imaging using a cad-
mium zinc telluride-based SPECT camera. From col-
lected data, a protocol to provide optimal image qual-
ity was derived, and subsequently validated in 250 pa-
tients. Thoracic and abdominal perimeters are found
to be best predicting parameters for image quality.
These results pave the way to patient-specific proto-
col resulting in an image quality less depending on
patient’s weight.
5 CONCLUSIONS
The calculation of the effective radiotracer dose for
a myocardial perfusion scintigraphy based on the
known anatomical parameters of the patient is novel.
The prediction results could be further improved by
training on a larger database. The relevance of the
thoracic and abdominal perimeters has been proven,
so they can also be used as dose predictors, especially
in obese patients whose BMI does not really repre-
sent the distribution of fat around the heart. The body
weight may be not the best-predicting parameter for
image quality.
ACKNOWLEDGMENTS
This work was jointly supported by the GENOPOLE
and the Hôpital sud-francilien. We are grateful to Dr.
Michelle Granier, Présidente of the CME in CHSF,
and Mrs Natacha Vitrat for assistance in constructing
the project.
REFERENCES
Bishop, C. M. (2006). Pattern Recognition and Ma-
chine Learning (Information Science and Statistics).
Springer-Verlag, Berlin, Heidelberg.
BIOSIGNALS 2022 - 15th International Conference on Bio-inspired Systems and Signal Processing
174

Bonow, R., Smaha, L., Smith, S., Mensah, G., and Lenfant,
C. (2002). World heart day 2002: The international
burden of cardiovascular disease: Responding to the
emerging global epidemic. Circulation, 106:1602–5.
Chinnaiyan, K., Boura, J., Depetris, A., Gentry, R., Abidov,
A., Share, D., and Raff, G. (2013). Progressive radi-
ation dose reduction from coronary computed tomog-
raphy angiography in a statewide collaborative qual-
ity improvement program: Results from the advanced
cardiovascular imaging consortium (ACIC). Circula-
tion. Cardiovascular imaging, 6.
Dogan, C., Cinaral, S. F., Karag oz, A., Bayram, Z., onal,
C., Candan, O., Acar, R., Cap, M., Erdogan, E.,
Hakgor, A., Akbal, O., Uslu, A., Kaymaz, C., and
Ozdemir, N. (2019). Comparison of automated quan-
tification and semiquantitative visual analysis findings
of iq spect mpi with conventional coronary angiogra-
phy in patients with stable angina. Turk Kardiyoloji
Derneginin yayin organidir.
Duvall, W., Croft, L., Ginsberg, E., Einstein, A., Guma, K.,
and Henzlova, T. (2011). The accurate determination
of college students’ coefficients of friction. J Nucl
Cardio, 18(2):847—-857.
Foraggi, M., Pierquet-Ghazzar, N., and Maunoury, C.
(2008). Detection de l’ischemie myocardique en
scintigraphie. Journal de Radiologie, 89(10):1283.
Gimelli, A., Achenbach, S., Buechel, R. R., Edvardsen, T.,
Francone, M., Gaemperli, O., Hacker, M., Hyafil, F.,
Kaufmann, P. A., Lancellotti, P., Nieman, K., Pontone,
G., Pugliese, F., Verberne, H. J., Gutberlet, M., Bax,
J. J., Neglia, D., and Committee, . E. S. D. (2017).
Strategies for radiation dose reduction in nuclear car-
diology and cardiac computed tomography imaging:
a report from the European Association of Cardio-
vascular Imaging (EACVI), the Cardiovascular Com-
mittee of European Association of Nuclear Medicine
(EANM), and the European Society of Cardiovas-
cular Radiology (ESCR). European Heart Journal,
39(4):286–296.
Gould, K. L., Pan, T., Loghin, C., Johnson, N. P., and
Sdringola, S. (2008). Reducing radiation dose in
rest–stress cardiac pet/ct by single poststress cine ct
for attenuation correction: Quantitative validation.
Journal of Nuclear Medicine, 49(5):738–745.
Hamilton-Craig, C., Tandon, K., Kwan, B., DeBoni, K.,
Burley, C., Wesley, A., O’Rourke, R., Neill, J., and
Branch, K. (2019). Coronary ct radiation dose re-
duction strategies at an australian tertiary care cen-
ter - improvements in radiation exposure through an
evidence-based approach. Journal of Medical Radia-
tion Sciences, 67.
Jacobs, F., Thierens, H., Piepsz, A., Bacher, K., Wiele, C.,
Ham, H., and Dierckx, R. (2005). Optimised tracer-
dependent dosage cards to obtain weight-independent
effective doses. European journal of nuclear medicine
and molecular imaging, 32:581–8.
Karakatsanis, N., Fokou, E., and Tsoumpas, C. (2015).
Dosage optimization in positron emission tomogra-
phy: state-of-the-art methods and future prospects.
Am J Nucl Med Mol Imaging, 5(5):527–547.
Kero, T., Saraste, A., Lagerqvist, B., S orensen, J.,
Pikkarainen, E., Lubberink, M., and Knuuti, J. (2021).
Quantitative myocardial perfusion response to adeno-
sine and regadenoson in patients with suspected coro-
nary artery disease. Journal of nuclear cardiology.
Nance, J., Schoepf, U., Bamberg, F., Ruzsics, B., Vliegen-
thart, R., and Bastarrika, G., editors (2014). CT Imag-
ing of Myocardial Perfusion and Viability: Beyond
Structure and Function. Medical Radiology - Diag-
nostic Imaging. Springer-Verlag, Berlin Heidelberg.
Patton, J. and Turkington, T. (2008). Spect/ct physical prin-
ciples and attenuation correction. J Nucl Med Technol,
36(1):1–10.
Piekarski, E., Manrique, A., Rouzet, F., and Le Guludec, D.
(2020). Current status of myocardial perfusion imag-
ing with new spect/ct cameras. Seminars in Nuclear
Medicine, 50(3):219 – 226. Developments in Cardiac
Imaging, part 1.
Serra, J. (1983). Image Analysis and Mathematical Mor-
phology. Academic Press, Inc., USA.
Tamam, M., Mulazimoglu, M., Edis, N., and Ozpacaci, T.
(2016). The value of attenuation correction in hybrid
cardiac spect/ct on inferior wall according to body
mass index. J Nucl Med, 15(1):18–23.
Van Dijk, J., Jager, P., Mouden, M., Slump, C., Ottervanger,
J., de Boer, J., Oostdijk, A., and van Dalen, J. (2014).
Development and validation of a patient-tailored dose
regime in myocardial perfusion imaging using czt-
spect. Journal of nuclear cardiology, 21.
Zhang, L., Wang, Y., Schoepf, U., Meinel, F., Bayer, R.,
Qi, L., Cao, J., Zhou, C., Zhao, Y., Li, X., Gong,
J., Jin, Z., and Lu, G. (2015). Image quality, radi-
ation dose, and diagnostic accuracy of prospectively
ecg-triggered high-pitch coronary ct angiography at
70 kvp in a clinical setting: comparison with invasive
coronary angiography. European radiology, 26.
Optimization of Tracer Dose for Scintigraphic Imagery
175
