
Condition Monitoring of Rail Infrastructure and Rolling Stock using
Acceleration Sensor Data of on-Rail Freight Wagons
Thomas Otte
1a
, Andres Felipe Posada-Moreno
1b
, Fabian Hübenthal
1
, Marc Haßler
2c
,
Holger Bartels
2
, Anas Abdelrazeq
1
and Frank Hees
1
1
RWTH Aachen University, Aachen, Germany
2
Deutsche Bahn (DB) Cargo AG, Frankfurt am Main, Germany
Keywords: Pattern Recognition Application, Rail Freight Transport, Real-world Case Study, Shock Data Analysis,
Condition Monitoring, Infrastructure Monitoring, Fleet Monitoring.
Abstract: In various industry sectors all over the world, the ongoing digital transformation helps to unlock benefits for
individual components, involved processes, stakeholders as well as the overarching system (e.g., the national
economy). In this context, the rail transport sector can particularly benefit from the increased prevalence of
sensor systems and the thereby increased availability of related data. As rail transport, by nature, is an
integrated transport mode that contains both freight and passenger transport within the same transport network,
benefits achieved for the service quality of freight transport also lead to improvements for passenger transport
(e.g., punctuality or uptime of rolling stock). This technical paper presents a method to monitor the condition
of the existing rail infrastructure as well as the rolling stock by obtaining insights from raw sensor data (e.g.,
locations and acceleration data). The data is collected with telemetry-units (i.e. multiple sensors integrated
with a telematics device to enable data transmission) mounted on a fleet of on-rail freight wagons. In addition,
the proposed method is applied to an exemplary set of extracted real-world data.
1 INTRODUCTION
Decreasing sensor costs lead to an increasing
prevalence of sensor systems as well as an increasing
availability of related data. Coupled with
advancements in the context of technologies and
methods to handle Big Data, this development
provides the foundation to exploit individual as well
as systematic benefits in the course of associated
transformation processes (i.e. Digital
Transformation) – a paradigm, that can be observed
in various industry sectors such as manufacturing
(e.g., Zhong et al., 2017), construction (e.g., Otte,
Zhou, et al., 2020; Zhou et al., 2020), policy-making
(e.g., Otte, Fenollar Solvay, & Meisen, 2020; Otte,
Gannouni, & Meisen, 2020; Otte & Meisen, 2021), or
education (e.g., Kaplan & Haenlein, 2016).
One sector that is expected to benefit from the
above-mentioned paradigm is the rail transport sector
(cf. Deutsche Bahn AG, 2021). Rail transport is,
a
https://orcid.org/0000-0002-4227-8938
b
https://orcid.org/0000-0003-3751-0680
c
https://orcid.org/0000-0002-1545-1416
among others, characterized by comparatively high
transport capacities per transport unit. This
characteristic also lays the foundation for achieving
comparatively high production extents of transport
volume – i.e. of passenger km (pkm) with regard to
passenger transport and/or ton km (tkm) with regard
to freight transport.
Consequently, especially in regions with large-
scale rail networks (cf. length, density) for short and
long-distance transport, rail transport is a sector of
particularly pronounced economic relevance. In
Germany, for example, the produced rail transport
volume grew between 2014 and 2019 for both
passenger (approx. +10% from 91 bn pkm to >100,4
bn pkm) and freight transport (approx. +15% from
115 bn tkm to >132,8 bn tkm) (BMVI, 2020).
Since rail transport, by nature, is an integrated
transport mode (cf. freight and passengers in the same
transport network), benefits that are obtained for
single transport volume shares (e.g., freight), directly
432
Otte, T., Posada-Moreno, A., Hübenthal, F., Haßler, M., Bartels, H., Abdelrazeq, A. and Hees, F.
Condition Monitoring of Rail Infrastructure and Rolling Stock using Acceleration Sensor Data of on-Rail Freight Wagons.
DOI: 10.5220/0010824600003122
In Proceedings of the 11th International Conference on Pattern Recognition Applications and Methods (ICPRAM 2022), pages 432-439
ISBN: 978-989-758-549-4; ISSN: 2184-4313
Copyright
c
2022 by SCITEPRESS – Science and Technology Publications, Lda. All rights reserved

benefit not only the overall system but also the further
transport volume shares (e.g., passengers). Following
this overarching hypothesis, one key objective of the
project QUISS is to develop data-based applications
using modern data science approaches to detect
possible failures (e.g., of the rail infrastructure or
freight wagons) at an early stage by detecting patterns
and anomalies in data (BMVI, 2021). As a result of
subsequently reduced operational disruptions, the rail
transport system as a whole will benefit from this
through an increased service quality (e.g.,
punctuality) for customers (BMVI, 2021).
QUISS is carried out in a collaboration between
research and industry. One contributing industry
partner – among others – is the DB Cargo AG (i.e. the
business unit for rail freight transport of the Deutsche
Bahn AG), a company that operates a fleet of approx.
90,000 freight wagons and 3,400 locomotives (DB
Cargo AG, 2019). In the current roll-out stage, 65,000
freight wagons are going to be equipped with
telemetry-units containing multiple sensors such as
triaxial accelerometers – to date, approx. 94% (i.e.
approx. 61,000) of this sub-set of the overall freight
wagon fleet is already equipped.
The availability of related sensor data paves the
way for the use case ‘acceleration-based
infrastructure monitoring’, which enables the
monitoring of both rail infrastructure and rolling
stock without impairing the day-to-day business. For
additional information about flanking use cases
within the project QUISS, see (Otte, Bartels, et al.,
2020) and (Posada Moreno et al., 2020; Posada
Moreno et al., 2022)). In this paper, we present a
method to obtain insights and information advantages
from raw data (e.g., locations, acceleration data) that
was gathered from telemetry-units mounted on a fleet
of on-rail freight wagons. Furthermore, we apply the
proposed method on an exemplary set of real-world
freight wagon movement data and end with a
conclusion on related benefits for multiple involved
stakeholders (e.g., infrastructure providers, wagon
fleet operators).
2 RELATED WORK
Already in the early 1970s, research has been
conducted and presented concerning the relationship
of freight wagon movement and related technical
issues (e.g., vibration, shocks) (Roggeveen, 1972;
Scales, 1971; Simmons & Shackson, 1971). Since
then, advancements in the field of information and
communications technology (e.g., sensor systems,
broadband communication, availability of
computational resources) have enabled to conduct
further computer-aided analyses in order to gain
further insights into the analyzed aspects.
To obtain an overview of the existing related
work in this specific research domain, we conducted
a targeted literature analysis by applying pre-defined
keyword set combinations (cf. Table 1) for an
advanced search in Web of Science Core Collection
(Web of Science Group, 2020) (date: 2
nd
March; time-
span: all-time; data field: ‘title’ OR ‘keywords’). At
this point, it should be highlighted that a different
scope of the literature collection (e.g., further
databases, further keywords) might lead to additional
candidates for the related work analysis.
The keyword set combinations represent
permutations of the following three fundamental
keyword sets:
KW Set I (Context): TI=((rail* OR wagon* OR
train*) AND (freight* OR cargo*)) OR AK=((rail*
OR wagon* OR train*) AND (freight* OR cargo*))
KW Set II (Digitalization): TI=(digit* OR
telem* OR internet* OR IoT* OR data*) OR
AK=(digit* OR telem* OR internet* OR IoT* OR
data*)
KW Set III (Use Case): TI=(shock* OR impact*
OR vibr* OR accel*) OR AK=(shock* OR impact*
OR vibr* OR accel*)
Table 1: Applied KW set combinations.
# Description n (collected)*
IV I AND II 68
V I AND III 105
VI I AND II AND III 2
* For further information on the collected initial corpus,
please contact the corresponding author.
In the next step, we selected the related works by
analyzing the titles and, if needed, the abstracts and/or
the full-text until the collected information were
sufficient for the decision whether to consider the
analyzed paper as related to our work.
The overall corpus of papers contains
contributions to various sub-domains of rail freight
transport (RFT). Among others, these are the design
and/or evaluation (e.g., profitability; energy
efficiency; safety) of the transport system (e.g.,
emissions; resilience), rail network (e.g., multi-modal
interaction), rolling stock (e.g., arrival time
predictions) or single components (e.g., sensor and
control systems) as well as inter-component
interactions (e.g., brake-wheel; wheel-rail).
To select contributions that are directly related to
our work, we derived the following exclusion criteria:
(1) objective (e.g., financial impact assessment); (2)
Condition Monitoring of Rail Infrastructure and Rolling Stock using Acceleration Sensor Data of on-Rail Freight Wagons
433
scope (e.g., single component analysis or component-
component interaction analyses); (3) perspective
(e.g., maintenance or intervention strategies); (4)
approach (e.g., component development, modal
analyses, material flow analyses). In case more than
one exclusion criterion was eligible to be assigned,
we decided based on the most decisive criterion.
As a result of the above-described selection
process, the following works could be identified as
directly related to our work:
Table 2: Related work.
Reference Focus
Brezulianu et al., 2020
control parameters
monitoring (real-time) for
freight fleets
Ußler et al., 2019
multi-sensor system
telematics platform for
freight wagons
Behrends et al., 2016;
Galonske et al., 2016
telematics-based information
services in RFT
Reason et al., 2010
sensor-enabled telemetry
within freight trains
Chiocchio et al., 2016
cloud-based platform for
freight train fleet
management
Aimar & Soma, 2017
sensor-enabled condition
monitoring of freight wagons
Macucci et al., 2015
sensor-enabled derailment
detection within freight trains
As one central outcome of the conducted
literature analysis, we can conclude that the suggested
methodological approach embodies a novel
contribution to the considered research domain. By
combining the suggested method with a first-time
application on real-world data, we emphasize the
feasibility of the approach and enable both
researchers as well as practitioners to reflect on the
transferability and expandability of our approach to
further applications (e.g., other economic sectors).
3 DATA SET AND METHOD
3.1 Overview: Data
The telemetry-units (battery-powered) are mounted
on freight wagons and collect data from incorporated
sensor modules (e.g., acceleration sensors, GPS
modules) as well as fuse them with existing meta data
(e.g., sensor system provider, wagon and train
identification numbers).
Among others, the sensor systems collect
geospatial temporal data (e.g., latitude, longitude,
instantaneous velocity) as well as additional data
about pre-defined events and send the collected data
to a data lake in a periodic fashion (i.e. every ten
minutes when moving, otherwise every 24 hours) and
in an event-triggered fashion.
From the perspective of the considered use case,
the events of interest are ‘shocks’. Shock events are
classified by processing measurements of the
available acceleration sensors in all spatial directions.
As soon as a configurable threshold value for one of
the three directions is exceeded, the acceleration data
is recorded and the according event is classified as a
shock event. Moreover, the data entry is enriched
with a corresponding position measurement and
timestamp.
The results obtained in this paper are based on an
extract of the entire data set provided by the
company-internal splunk-system (cf. Splunk, 2021)
and comprises the movement of 60 different wagons
over six months (May to October 2020). The wagons
were selected by calculating the average daily shock
rates for the first month (May 2020) and clustering
the results into pre-defined percentage ranges
spanning over the prevalent range of daily shock
rates. Finally, an equal number of wagons has been
selected from each percentage range with the
boundary condition that they moved on as many days
as possible.
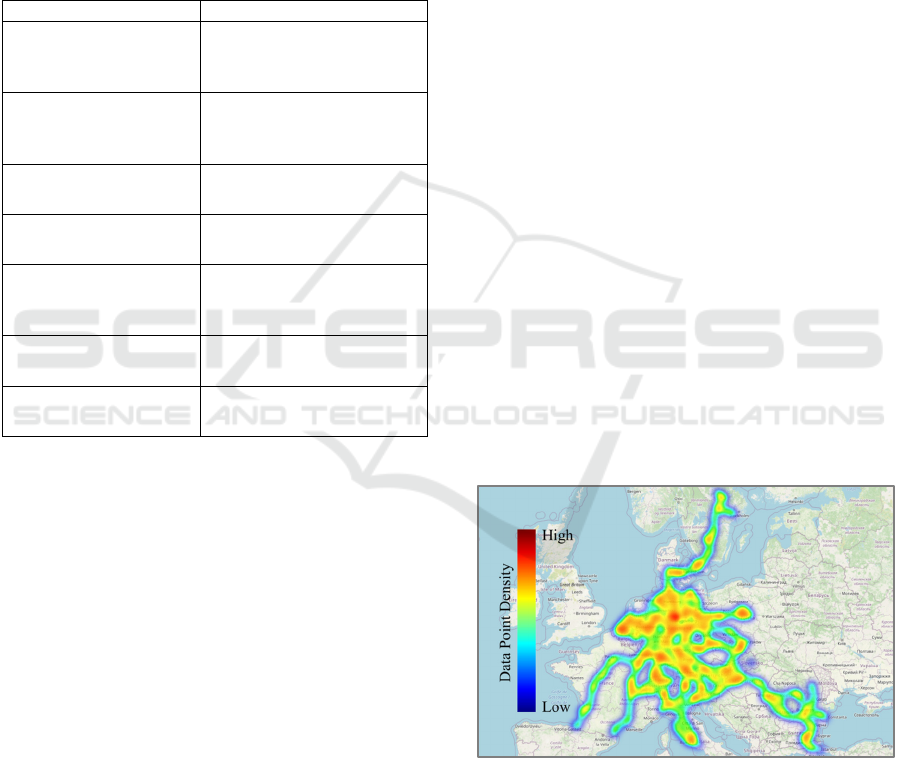
The period contains 292,586 entries in total. The
heatmap visualization in Figure 1 illustrates the
geographic extent of the extracted data set.
Figure 1: Geographic extent of extracted data set.
3.2 Overview: Method
The utilized data analytics pipeline consists of six
steps starting with two pre-processing steps and
continuing with three processing steps as well as one
post-processing step:
ICPRAM 2022 - 11th International Conference on Pattern Recognition Applications and Methods
434
(1) Read-In;
(2) Filtering;
(3) Shock Analysis;
(4) Anomaly Detection;
(5) Cluster Detection;
(6) Reverse Geocoding.
If desired, additional steps can be integrated into
the pipeline to gain further insights from the analyzed
data set.
4 RESULTS
Building upon the description of the dataset as well as
the proposed method, we subsequently describe and
execute the afore-mentioned sequence of single
process steps (cf. sub-sections 4.1 to 4.6).
4.1 Step 1: Read-in
In the context of the presented proof of concept, the
raw data files (e.g., daily or monthly extracts) are
obtained from the splunk system in the form of
‘comma-separated values’-files (*.csv) and merged
into one data frame (cf. Pandas, 2021) before being
saved accordingly for further processing.
4.2 Step 2: Filtering
The filtering process contains two sub-steps: position
and velocity filtering. First, the position filtering
removes data points with duplicate entries and
missing (e.g., due to lost GPS signal) or default
position information (e.g., due to set up and initial
operation process of the telemetry-unit).
Second, approximate mean velocities are
calculated by applying an Euler backward difference
scheme on the position information and the
corresponding timestamps within the remaining data
points. The geospatial difference is approximated by
the Haversine formula using the latitude and
longitude coordinates and the average radius of the
earth.
Subsequently, to ensure the physical plausibility
of prevalent velocities, calculated or measured
velocities greater than a pre-defined threshold were
filtered. Obtained from discussions with involved
domain experts, this threshold was set to 125 km/h.
As a positive side effect of this filtering process,
ensuring physically plausible velocities actively
reduces the probability to cause false positives in the
anomaly detection step (cf. sub-section 4.4). Table 3
summarizes the numerical effect of the filtering
process on the analyzed data set.
Table 3: Filtering overview.
Characteristic Value
Number of data points before filtering 292,586
Number of data points after filtering 275,207
Share of filtered data points 5.94%
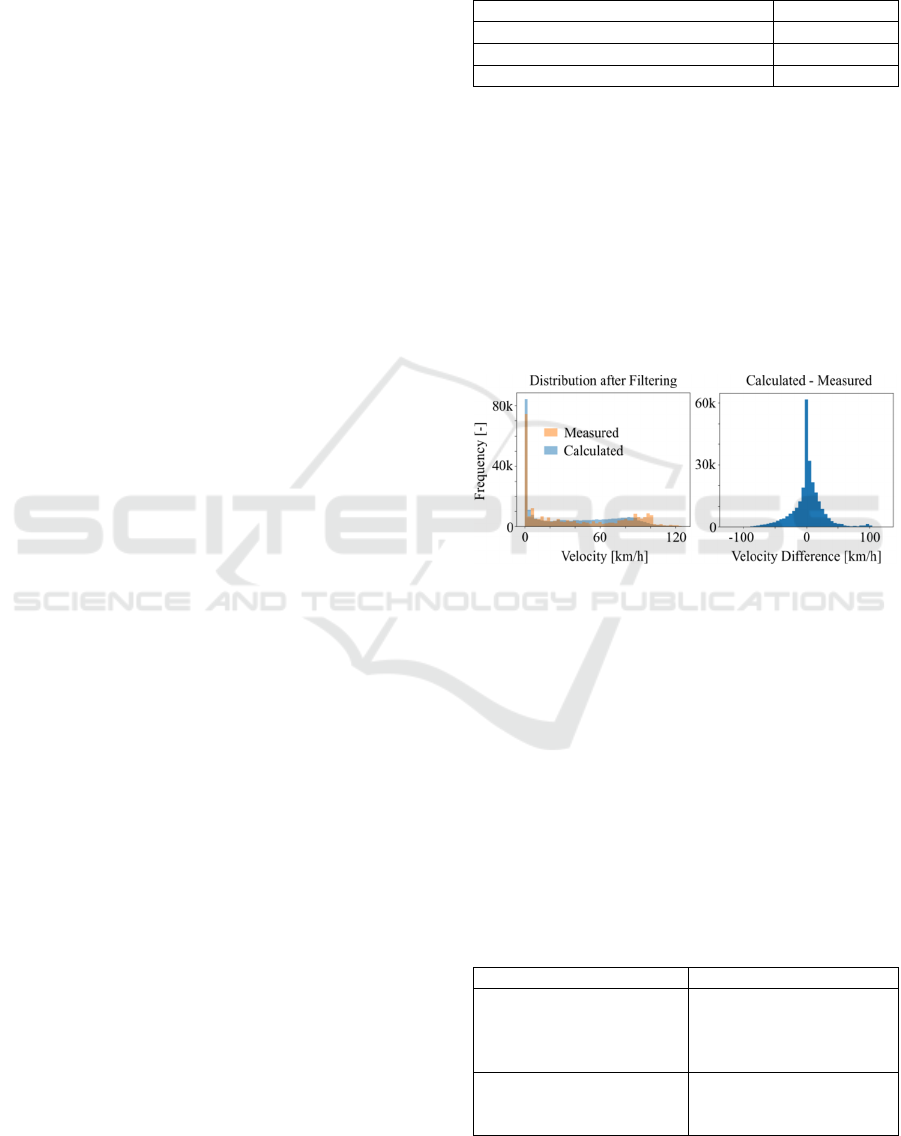
Figure 2 illustrates the distribution of measured
and calculated velocities. The mean of the calculated
distribution is smaller than the mean of the measured
one, whereas the overall shape and tendency of both
distributions seem in good agreement. The
underestimation tendency for the calculated
velocities in comparison with the measured ones can
be attributed to the calculation method, as the driven
path length is estimated as the direct great circle
connection between two successive geospatial data
points on a sphere, thus ignoring the actual railway
course.
Figure 2: Distribution of measured and calculated
velocities.
4.3 Step 3: Shock Analysis
The shock analysis is divided into two parts: the full
time span shock analysis and the daily shock analysis.
4.3.1 Full Time Span
The full time span shock analysis iterates over each
wagon and over the entire time span of the data set
and calculates various shock-related measures. Table
4 and Table 5 provide an overview of the suggested
absolute and relative measures.
Table 4: Full time span shock measures (absolute).
Measure Description
max_num_shocks_per_train
Maximal number of shocks
detected for a train pulling
the wagon until train is
changed.
num_events
Total number of events for
the wagon over the entire
time span.
Condition Monitoring of Rail Infrastructure and Rolling Stock using Acceleration Sensor Data of on-Rail Freight Wagons
435
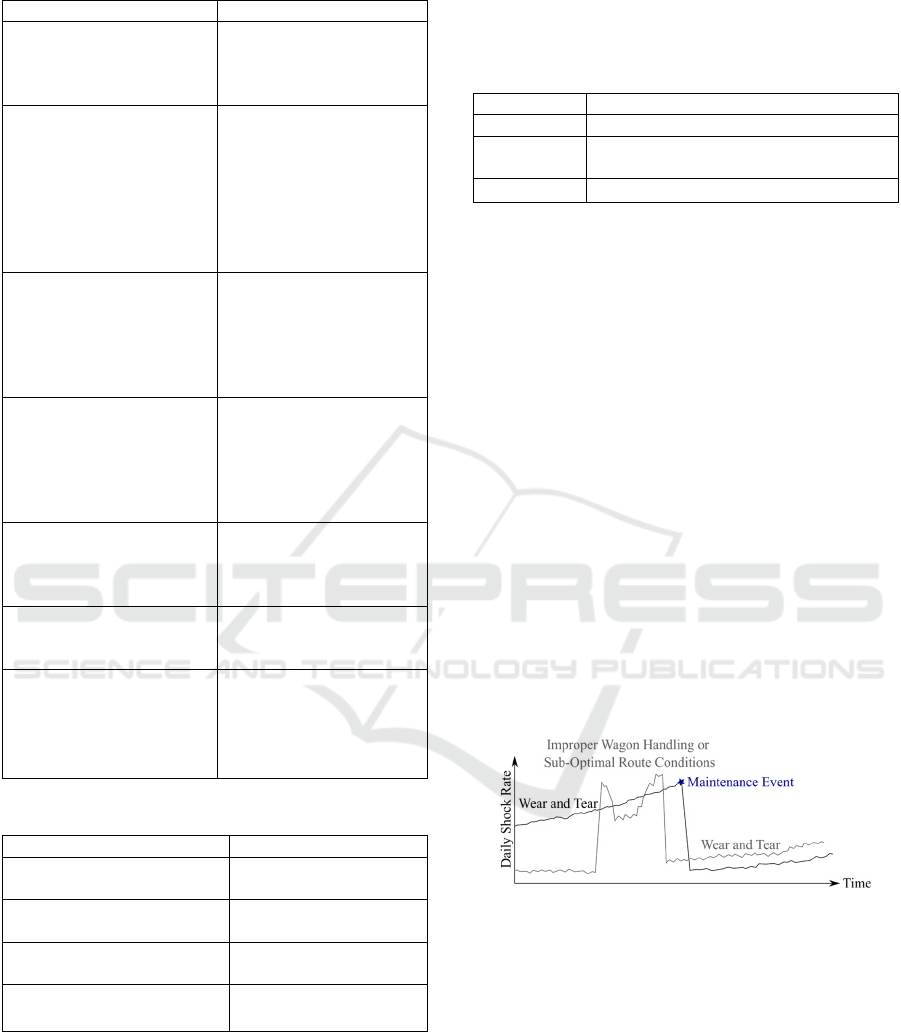
Table 4: Full time span shock measures (absolute) (cont.).
Measure Descri
p
tion
num_shocks
Total number of shocks
resp. shock events for the
wagon over the entire time
span.
num_trains
Total number of trains used
for pulling the wagon. If a
train is exchanged in the
past and the same train is
used at a later point in time,
this train counts twice.
Therefore, each train
change counts.
num_unique_trains
Total number of unique
trains used for pulling the
wagon. The same train
pulling the wagon at a later
point of time does not count
multi
p
le times.
num_trains_shock
Total number of trains with
at least one shock. Every
single train change counts
(cf. num_trains) and it is
checked for shocks until the
next train chan
g
e ha
pp
ens.
num_unique_shock_trains
Total number of unique
trains used for pulling the
wagon with at least one
shock event.
num_days_driven
Total number of days the
wagon has been pulled by a
train.
num_shock_days
Total number of days the
wagon has been pulled by a
train and at least one shock
has been etected on the
corresponding day.
Table 5: Full time span shock measures (relative).
Measure Calculation
shock_rate_per_event
num_shocks /
num_events
shock_rate_per_train
num_trains_shock /
num_trains
shock_rate_per_day
num_shock_days /
num
_
da
y
s
_
driven
day_driven_per_total_days
num_days_driven /
num_days_df
4.3.2 Daily
The daily shock analysis iterates over each wagon and
over each day of the entire time span of the data set
and calculates the number of data points per day, the
number of shocks per day, and the number of trains
pulling the wagon (cf. Table 6). Based on that, the
daily shock rate for each wagon is determined as the
quotient of the total number of shocks and the total
number of entries on the corresponding day.
Table 6: Daily shock measures (absolute).
Measure Descri
p
tion
num
_
entries Total number of entries on this da
y
.
num_trains Total number of different trains of the
wagon on this day.
num_shocks Total number of shocks on this day.
4.3.3 Full Time Span vs. Daily
The full time span shock analysis offers an overview
of the entire data set, while in contrast to that, the
daily shock analysis provides time-dependent
measures, which in turn can be used in further
pipeline steps, e.g., detecting anomalies in the
analyzed data set.
4.4 Step 4: Anomaly Detection
As Figure 3 illustrates, our definition of an anomaly
is motivated by the hypothesis that level shifts within
the temporal progression of the daily shock rate can
be attributed to events that directly have an impact on
the condition of the rail infrastructure or the rolling
stock (e.g., maintenance events, sub-optimal railway
conditions, improper wagon handling). Contrarily,
non-anomalous wear and tear (e.g., of wagon material
or the rail infrastructure) is assumed to lead to a
comparatively gradual and continuous daily shock
rate growth.
Figure 3: Schematic sketch of hypothesis for anomaly
detection.
To detect level shift anomalies in the daily shock
rates, the LevelShiftAD anomaly detection algorithm
(taken from the Python ADTK package - see
ARUNDO ADTK, 2020a) is applied. The algorithm
was selected because it is not sensitive to
instantaneous spikes and suitable for frequently
occurring noisy outliers. The selected parameter
settings are documented in Table 7. For additional
information on the algorithm and parameters, see
(ARUNDO ADTK, 2020b).
ICPRAM 2022 - 11th International Conference on Pattern Recognition Applications and Methods
436
When an anomalous day for a wagon is detected,
all data points of the corresponding day and wagon
are classified as anomalous.
Table 7: LevelShiftAD parameters.
Paramete
r
Value
c 6
window 5
side ‘both’
4.5 Step 5: Cluster Detection
After performing the anomaly detection, a clustering
analysis is carried out – optionally of the shock events
or the anomalous events. For the clustering analysis,
the scikit-learn implementation of the DBSCAN (i.e.
Density-Based Spatial Clustering of Applications
with Noise) algorithm is utilized. The parameters are
selected in a way that the cluster size is in the order
of the size of the detected shock cluster (e.g.,
industrial plant, railway station).
The selected settings for all non-default
DBSCAN parameters are summarized in Table 8. For
additional information on the algorithm and
parameters, see (scikit.learn, 2021).
Table 8: DBSCAN parameters.
Paramete
r
Value
eps_in_km 1 (eps_in_km / radius_earth)
min_samples 10
al
g
orithm ‘ball
_
tree’
metric ‘haversine’
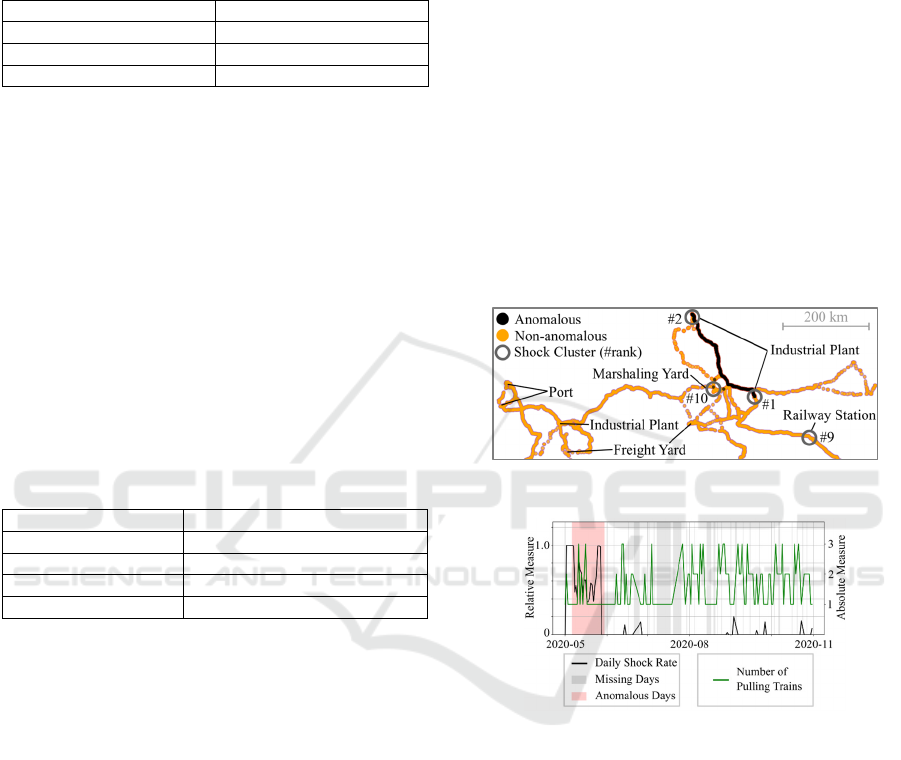
An exemplary result for the described anomaly
detection followed by a subsequent cluster detection
and analysis after their application on the analyzed
real-world dataset is presented in Figure 4.
The shock cluster ranking is based on the full
dataset (i.e. 60 wagons), whereas the highlighted
anomaly detection results are presented for two
selected wagons that both traveled through the first-
ranked shock cluster. Some data points of one of the
wagons are classified as anomalous, while the data
points of the other wagon are completely anomalous-
free. Due to data privacy reasons, the depiction does
not contain underlying map information.
Remarkably, most of the anomalous data points
belong to the connection between the first and
second-ranked shock clusters, in which the wagon is
traveling multiple times during the entire time span of
the data set (six months). Furthermore, three anomaly
data points are detected west of the main anomalous
route, which are most probably caused by a singular
route change between clusters one and two.
The shock clusters #1 and #2 can be
geographically mapped to industrial plants, while
clusters #9 and #10 can be assigned to one railway
station and one marshaling yard respectively.
Figure 5 depicts a graphical representation of the
real-world data from the wagon that moved between
cluster #1 and #2 (cf. Figure 4). The figure does not
only depict the temporal progression of the daily
shock rate throughout the overall time span of the
analyzed data set but also highlights the absolute
number of pulling trains to which the wagon had been
assigned to. Furthermore, it enables the immediate
deduction of two further information: first, the share
of missing days (e.g., due to wagon idling or missing
signal transmission), and second, the extent of
anomalous days. The latter is of particular importance
for fleet operators as this information indicates
promising focal points for further in-depth analysis
(e.g., traveled routes, involved business users).
Figure 4: Map plot of two exemplary freight wagons.
Figure 5: Wagon-specific data representation.
4.6 Step 6: Reverse Geocoding
For the presented example, the pipeline is completed
by a ‘reverse geocoding’-step to map the latitude and
longitude data to the corresponding country code,
administrative region (cf. state, sub-state), and the
closest city. For this final and offline reverse
geocoding process, we utilized the Python package
called ‘reverse_geocoder’.
As the analyzed real-world data set was not
homogenous with regard to the share of data points per
country traveled, Table 9 represents an extract from the
overall statistical analysis to avoid highly misleading
conclusions (e.g., inter-country comparisons).
Condition Monitoring of Rail Infrastructure and Rolling Stock using Acceleration Sensor Data of on-Rail Freight Wagons
437

Table 9: Extract from statistical analysis.
Countr
y
% of Data Set Shocks Anomalies
DE 72.12 % 5.89% 4.09%
Building upon this initial analysis, further insights
can be obtained through multiple paths such as an in-
depth statistical analysis (e.g., shock rates per
country, anomaly rates per country). These insights
can be utilized as input parameters for future needs
for action – e.g., in the form of rankings and resulting
priorities for regions. Furthermore, subsequent
analysis steps can be implemented based on prevalent
individual requirements (e.g., objective of analysis;
configuration of data set).
5 CONCLUSION AND OUTLOOK
In the present paper, we showed how raw data from
multiple sensor systems mounted on freight wagons
can be used to monitor the condition of the prevalent
rail infrastructure as well as the rolling stock.
Consequently, equipping a fleet of freight (and/or
passenger) wagons with according telemetry-units
extends it to a moving sensor network that provides
not only momentary or short-term but also long-term
information about the transport system itself.
It has to be emphasized that the obtained results
are not to be understood as direct causalities (e.g.,
level shift in daily shock rate damaged
infrastructure or improper handling of material).
Instead, each of the data-based findings serves as an
indication and a starting point from which to carry out
further in-depth data analyses or to apply additional
investigation methods (e.g., Alippi et al., 2000).
When interpreting the results obtained, the integration
of human expert knowledge of the application domain
is essential, just as it is when guiding through and
performing subsequent in-depth analyses.
Based on our present paper, future work should
address the following aspects in particular: a
systematic in-depth analysis of individual wagon
numbers and clusters of similar wagons; enrichment
with additional data sources (e.g., maintenance
plans), implementation of further steps to the
analytics pipeline and transnational stakeholder
exchange (e.g., infrastructure providers, fleet
operators).
Considering the context of large (freight) wagon
fleets (cf. multiple millions of data points per calendar
week), special attention should be paid to the
automation (e.g., computing frequency), scalability
(e.g., parallel computing), and efficiency (e.g.,
resource-efficient programming) of the
computational operations to pave the way towards an
industrial usage of the suggested method.
ACKNOWLEDGEMENTS
The authors acknowledge the financial support by the
Federal Ministry of Transport and Digital
Infrastructure of Germany (BMVI) within the project
QUISS (project number 19F2060).
The authors further acknowledge the support of
Christoph Anger and Daniel Wolfram (both DB
Cargo AG) in the course of the data exchange and the
related fruitful discussions.
REFERENCES
Aimar, M., & Soma, A. (2017). Condition Monitoring and
Comparison of Braking and Dynamics in Railway
Freight Wagon. https://paginas.fe.up.pt/~m2d/
Proceedings_M2D2017/data/papers/6842.pdf
Alippi, C., Casagrande, E., Scotti, F., & Piuri, V. (2000).
Composite real-time image processing for railways
track profile measurement. IEEE Transactions on
Instrumentation and Measurement, 49(3), 559–564.
https://doi.org/10.1109/19.850395
ARUNDO ADTK. (2020a, April 17). Anomaly Detection
Toolkit (ADTK) — ADTK 0.6.2 documentation.
https://arundo-adtk.readthedocs-hosted.com/en/stable/
ARUNDO ADTK. (2020b, April 17). Detector — ADTK
0.6.2 documentation. https://arundo-adtk.readthedocs-
hosted.com/en/stable/notebooks/demo.html#LevelShif
tAD
Behrends, V., Haunschild, M., & Galonske, N. (2016).
Smart Telematics Enabling Efficient Rail Transport –
Development of the ViWaS Research and Development
Project. Transportation Research Procedia, 14, 4430–
4439. https://doi.org/10.1016/j.trpro.2016.05.365
BMVI. (2020). Verkehr in Zahlen: 2020/2021.
https://www.bmvi.de/SharedDocs/DE/Publikationen/G
/verkehr-in-zahlen-2020-pdf.html
BMVI. (2021). QUISS: Qualitätssteigerung des
Schienenverkehrs durch intelligente, datenbasierte
Schadmustererkennung bei Schienenfahrzeugen.
https://www.bmvi.de/SharedDocs/DE/Artikel/DG/
mfund-projekte/qualitaetssteigerung-des-schienenverkehrs-
durch-intelligentedatenbasierte-schadmustererkennung-
quiss.html
Brezulianu, A., Aghion, C., Hagan, M., Geman, O.,
Chiuchisan, I., Balan, A.‑L., Balan, D.‑G., &
Balas, V. E. (2020). Active Control Parameters
Monitoring for Freight Trains, Using Wireless Sensor
Network Platform and Internet of Things. Processes,
8(6), 639. https://doi.org/10.3390/pr8060639
Chiocchio, S., Persia, A., Santucci, F., Di Claudio, V., Di
Grande, D., Giugliano, P., & Guidotti, G. (2016). A
ICPRAM 2022 - 11th International Conference on Pattern Recognition Applications and Methods
438

cloud-based heterogeneous wireless platform for
monitoring and management of freight trains. In 2016
8th International Congress on Ultra Modern
Telecommunications and Control Systems and
Workshops (ICUMT) (pp. 263–268). IEEE.
https://doi.org/10.1109/ICUMT.2016.7765368
DB Cargo AG. (2019). Der neue Code von DB Cargo.
https://www.dbcargo.com/rail-deutschland-de/news-und
-medien/kundenmagazin_railways/focus-themen/der-
code-von-dbcargo-1697336
Deutsche Bahn AG. (2021). Digitale Schiene Deutschland.
https://digitale-schiene-deutschland.de/de
Galonske, N., Riebe, E., Toubol, A., & Weismantel, S.
(2016). The ViWaS Project: Future-proof Solutions for
Wagonload Transport. Transportation Research
Procedia, 14, 2850–2859. https://doi.org/10.1016/
j.trpro.2016.05.402
Kaplan, A. M., & Haenlein, M. (2016). Higher education and
the digital revolution: About MOOCs, SPOCs, social
media, and the Cookie Monster. Business Horizons, 59(4),
441–450. https://doi.org/10.1016/j.bushor.2016.03.008
Macucci, M., Di Pascoli, S., Marconcini, P., & Tellini, B.
(2015). Wireless sensor network for derailment
detection in freight trains powered from vibrations. In
2015 IEEE International Workshop on Measurements
& Networking (M&N) (pp. 1–6). IEEE.
https://doi.org/10.1109/IWMN.2015.7322970
Otte, T., Bartels, H., Posada Moreno, A. F.,
Wittenburg, G., & Haßler, M. (2020). Holistic data
infrastructure and analytics system for rail freight
transport. Via 1st Virtual ITS European Congress
(COVID-19), 1–10. https://doi.org/10.18154/RWTH-
2020-06991
Otte, T., Fenollar Solvay, A., & Meisen, T. (2020). The future
of urban freight transport: Shifting the cities role from
observation to operative steering. Proceedings of 8th
Transport Research Arena TRA 2020, April 27-30, 2020,
Helsinki, Finland, 1–10. https://doi.org/10.18154/RWTH-
2020-02971
Otte, T., Gannouni, A., & Meisen, T. (2020). The future of
urban freight transport: A data-driven consolidation
approach to accompany cities on their path to zero
redundancy in freight movement. 27th ITS World
Congress via 1st Virtual ITS European Congress
(COVID-19), 1–10. https://doi.org/10.18154/RWTH-
2020-06989
Otte, T., & Meisen, T. (2021). A Reference Framework for
the Performance-Based Decision Support of City
Authorities in Urban Freight Transport. In IEEE 2021
8th International Conference on ICT for Smart Society
(ICISS) (pp. 1–7). https://doi.org/10.1109/ICISS53185.
2021.9533210
Otte, T., Zhou, H., Gannouni, A., Odenthal, J.,
Abdelrazeq, A., & Hees, F. (2020). A Manufacturer-
Independent Digital Process Platform for Future
Construction Sites. IEEE 2020 14th International
Conference on Innovations in Information Technology
(IIT), 1–6. https://doi.org/10.1109/IIT50501.2020.
9298971
Pandas. (2021, March 2). DataFrame — pandas 1.2.3
documentation. https://pandas.pydata.org/pandas-
docs/stable/reference/frame.html
Posada Moreno, A. F., Klein, C., Haßler, M., Pehar, D.,
Solvay, A. F., & Kohlschein, C. P. (2020). Cargo
Wagon Structural Health Estimation Using Computer
Vision(RWTH-2020-02698), 1–10.
https://doi.org/10.18154/RWTH-2020-02698
Posada Moreno, A. F., Otte, T., Pehar, D., Haßler, M.,
Bartels, H., Abdelrazeq, A., & Hees, F. (2022).
Towards Freight Wagon Brake Health Scoring with
Image Processing. ICPRAM 2022 11th International
Conference on Pattern Recognition Applications and
Methods (In Press).
Reason, J. M., Chen, H., Crepaldi, R., & Duri, S. (2010).
Intelligent Telemetry for Freight Trains. In T. Phan, R.
Montanari, & P. Zerfos (Eds.), Lecture Notes of the
Institute for Computer Sciences, Social
Informatics and Telecommunications Engineering.
Mobile Computing, Applications, and Services (Vol.
35, pp. 72–91). Springer Berlin Heidelberg.
https://doi.org/10.1007/978-3-642-12607-9_6
Roggeveen, R. C. (1972). Computer Predictions of Freight
Train Shock Actions. https://trid.trb.org/view/8691
Scales, B. T. (1971). Longitudinal-Shock Problems in
Freight-Train Operation. https://trid.trb.org/view/13877
scikit.learn. (2021, March 23). sklearn.cluster.DBSCAN —
scikit-learn 0.24.1 documentation. https://scikit-
learn.org/stable/modules/generated/sklearn.cluster.DB
SCAN.html
Simmons, L. C., & Shackson, R. H. (1971). Shock and
Vibration on Railroad Movement of Freight.
https://trid.trb.org/view/13895
Splunk. (2021). The Data-to-Everything Platform Built for
the Cloud. https://www.splunk.com/
Ußler, H., Michler, O., & Löffler, G. (2019). Validation of
multiple sensor systems based on a telematics platform
for intelligent freight wagons. Transportation Research
Procedia, 37, 187–194. https://doi.org/10.1016/j.trpro.
2018.12.182
Web of Science Group. (2020). Web of Science Core
Collection. https://clarivate.com/webofsciencegroup/
solutions/web-of-science-core-collection/
Zhong, R. Y., Xu, X., Klotz, E., & Newman, S. T. (2017).
Intelligent Manufacturing in the Context of Industry
4.0: A Review. Engineering, 3(5), 616–630.
https://doi.org/10.1016/J.ENG.2017.05.015
Zhou, H., Gannouni, A., Otte, T., Odenthal, J.,
Abdelrazeq, A., & Hees, F. (2020). Towards a Digital
Process Platform for Future Construction Sites. IEEE
2020 ITU Kaleidoscope: Industry-Driven Digital
Transformation (ITU K), 1–7. https://doi.org/
10.23919/ITUK50268.2020.9303198.
Condition Monitoring of Rail Infrastructure and Rolling Stock using Acceleration Sensor Data of on-Rail Freight Wagons
439
