
Weakly Supervised Deep Learning-based Intracranial Hemorrhage
Localization
Jakub Nemcek
a
, Tomas Vicar
b
and Roman Jakubicek
c
Department of Biomedical Engineering, Faculty of Electrical Engineering and Communication,
Brno University of Technology, Brno, Czech Republic
Keywords:
Intracranial Hemorrhage, Computed Tomography, Deep Learning, Convolutional Neural Network, Weakly
Supervised Learning, Localization, Attention, Multiple Instance Learning.
Abstract:
Intracranial hemorrhage is a life-threatening disease, which requires fast medical intervention. Owing to the
duration of data annotation, head CT images are usually available only with slice-level labeling. However, in-
formation about the exact position could be beneficial for a radiologist. This paper presents a fully automated
weakly supervised method of precise hemorrhage localization in axial CT slices using only position-free la-
bels. An algorithm based on multiple instance learning is introduced that generates hemorrhage likelihood
maps for a given CT slice and even finds the coordinates of bleeding. Two different publicly available datasets
are used to train and test the proposed method. The Dice coefficient, sensitivity and positive predictive value
of 58.08 %, 54.72 % and 61.88 %, respectively, are achieved on data from the test dataset.
1 INTRODUCTION
Intracranial hemorrhage (ICH) is a relatively common
life-threatening disease (25 cases per 100,000 people
per year) that may develop after physical trauma or
non-traumatically. The significance of this event is
given by a high 30-days mortality rate (up to 52 %)
and a large risk of lasting consequences among sur-
vivors (Caceres and Goldstein, 2012). For these rea-
sons, fast diagnosis of the disease is crucial for the
early initiation of treatment. If the treatment is de-
layed (even within minutes), the risk of permanent
brain disfunction or even death is increased. Mod-
ern algorithms, which analyse brain CT scans, can
provide fast and effective support for computer-aided
diagnosis and can therefore be very useful for physi-
cian’s decisions, especially in acute cases.
Nowadays, most state-of-the-art methods are fo-
cused on deep learning approaches, especially using
convolutional neural networks (CNN) and their mod-
ifications or combinations. Published detection al-
gorithms (Ker et al., 2019) and (Arbabshirani et al.,
2018) use 3D CNN-based classification at the level of
the whole CT scan that provide a decision about the
a
https://orcid.org/0000-0003-4748-5802
b
https://orcid.org/0000-0002-9136-7873
c
https://orcid.org/0000-0003-4293-260X
occurrence of ICHs in the patient. A combination of
2D CNN and LSTM (Long short-term memory) algo-
rithm for ICH detection in CT slices was designed by
the authors of (Nguyen et al., 2020). Another combi-
nation of CNN and recurrent neural network was pub-
lished in (Ye et al., 2019) that includes classification
into its subtypes.
The algorithm for 2D ICH segmentation includ-
ing its type classification based on cascade CNN
model was applied by the authors of (Cho et al.,
2019). For the same task, the authors of (Chang
et al., 2018) suggested a hybrid 2D/3D approach us-
ing Mask Regional-CNN algorithm. The well-known
U-net architecture of CNN was used in (Majumdar
et al., 2018) for 2D ICH segmentation. A similar
3D approach was introduced by the authors of (Patel
et al., 2019).
One of the first published mentions of the possible
utilizing of attention maps for ICH detection or seg-
mentation is in (Lee et al., 2019). Here, the authors
validated the ICHs center detection to a certain de-
gree, using simple thresholding of the attention maps.
However, it was done only as a brief appendix of their
manuscript. The main aim of their attention maps was
to enhance the explainability of the deep learning al-
gorithm decision. In (Ye et al., 2019), the attention
maps were displayed for mere visualization of the net-
work’s field of view.
Nemcek, J., Vicar, T. and Jakubicek, R.
Weakly Supervised Deep Learning-based Intracranial Hemorrhage Localization.
DOI: 10.5220/0010825000003123
In Proceedings of the 15th International Joint Conference on Biomedical Engineering Systems and Technologies (BIOSTEC 2022) - Volume 2: BIOIMAGING, pages 111-116
ISBN: 978-989-758-552-4; ISSN: 2184-4305
Copyright
c
2022 by SCITEPRESS – Science and Technology Publications, Lda. All rights reserved
111

The approach of ICH localization presented in this
paper is based on a detection of local extrema in gen-
erated attention maps, which can be interpreted as
maps of ICH occurrence likelihood for each pixel.
These maps are produced by the proposed weakly su-
pervised approach based on multiple instance learn-
ing (MIL) (Ilse et al., 2018). Its advantage is a
position-free learning, thus precise position annota-
tions are not needed for training, and slice-level an-
notations (healthy/ICH) are quite sufficient. In ad-
dition, unlike (Lee et al., 2019), we apply a special
local maxima detector (Koenderink and van Doorn,
1992) to the attention map that directly leads to the
precise localization of ICHs. The whole design of our
approach is to our knowledge original, as most of the
published papers did not deal with the precise ICH po-
sition’s localization. Besides, our approach is trained
and tested using datasets different from each other.
2 METHODS
2.1 Experimental Data
The head CT data from two publicly available
datasets is used in this work. More than 25,000
noncontrast brain CT scans manually labeled at the
level of each slice have been released for the pur-
poses of a challenge held by the Radiological So-
ciety of North America (RSNA) (Flanders et al.,
2020). Besides, almost 500 head scans are avail-
able within the CQ500 dataset (Chilamkurthy et al.,
2018) together with patient-level annotations of dif-
ferent pathologies, including ICHs. For the purposes
of this work, CT images with soft-tissue reconstruc-
tion kernel including ICHs or healthy patient’s scans
are used (other pathologies are included only in case
of co-occurrence with ICH). An extension of CQ500
annotation has been made public on the PhysioNet
(Goldberger et al., 2000) in the BHX dataset (Reis
et al., 2020). The authors released bounding boxes
(BBs) which label the position of ICHs and are gained
either manually by three radiologists for slices with
the lower axial resolution or by an extrapolation. The
reason of using CQ500 is that the ICHs positional la-
bels are required for the evaluation of the proposed
method. Moreover, the evaluation of the proposed ap-
proach on the dataset completely different from the
training and validation set proves the ability to per-
form well even on new data.
2.2 Weakly Supervised Detection
The aim of this work is to build a CNN-based detec-
tor which can accurately localize ICHs in axial CT
slices, using only slice-level annotations. A classifi-
cation CNN model is trained to predict both the prob-
ability of ICH’s presence in the image and an attention
map providing information about the likelihood of the
appearance of ICHs at particular positions. Using this
heat map, a detector is proposed that provides ex-
act positional information about the location of ICHs.
The block scheme of the algorithm is shown in Fig 1.
To form an input of the model, the axial slices
from CT scans are taken as the first channel. To form
the other two channels, the contrast enhancement is
applied with respect to two radiological windows, i.e.,
brain (L=40, W=80) and subdural (L=50, W=130),
which has been proven to be effective in previous
work. Besides, all data are standardized by the mean
and standard deviation of the whole dataset.
ResNet-like architecture (He et al., 2016) is cho-
sen for the classification CNN. The feature extractor
has a total of 18 convolution layers and undersam-
ples the feature maps to a quarter of the original size.
The resulting feature map is input into either the max-
pooling or attention layer. Both layers result in creat-
ing outputs (for details see section 2.3) that are pro-
cessed by the fully connected layer providing a bi-
nary classification (pathological or non-pathological
slices). In parallel, either the activation maps ahead
of global max-pooling or the weights of the attention
layer are resized to the size of the original image to
form the attention maps, which are further processed
by the proposed ICH detector described in the section
2.4.
To obtain the desired results, the CNN classifier
is trained using CT scans from the RSNA dataset and
a weighted cross-entropy loss function. The data was
divided in proportion 97:3 into training and validation
sets to maximize the amount of training data while
ensuring sufficient validation of the training process.
2.3 Max-pooling and Attention Layer
In the case of max-pooling, the forward propagation
can be described by:
z = max
k=1,...,K
(h
k
) (1)
where z denotes the value of the output and h
k
is the
value of the feature image on the network output. In
our case, global pooling over all positions k in the im-
age is applied. By taking the maximal value from the
image, the output captures the strongest feature posi-
tion h
k
. Feature image h
k
shows the prediction of ICH
BIOIMAGING 2022 - 9th International Conference on Bioimaging
112
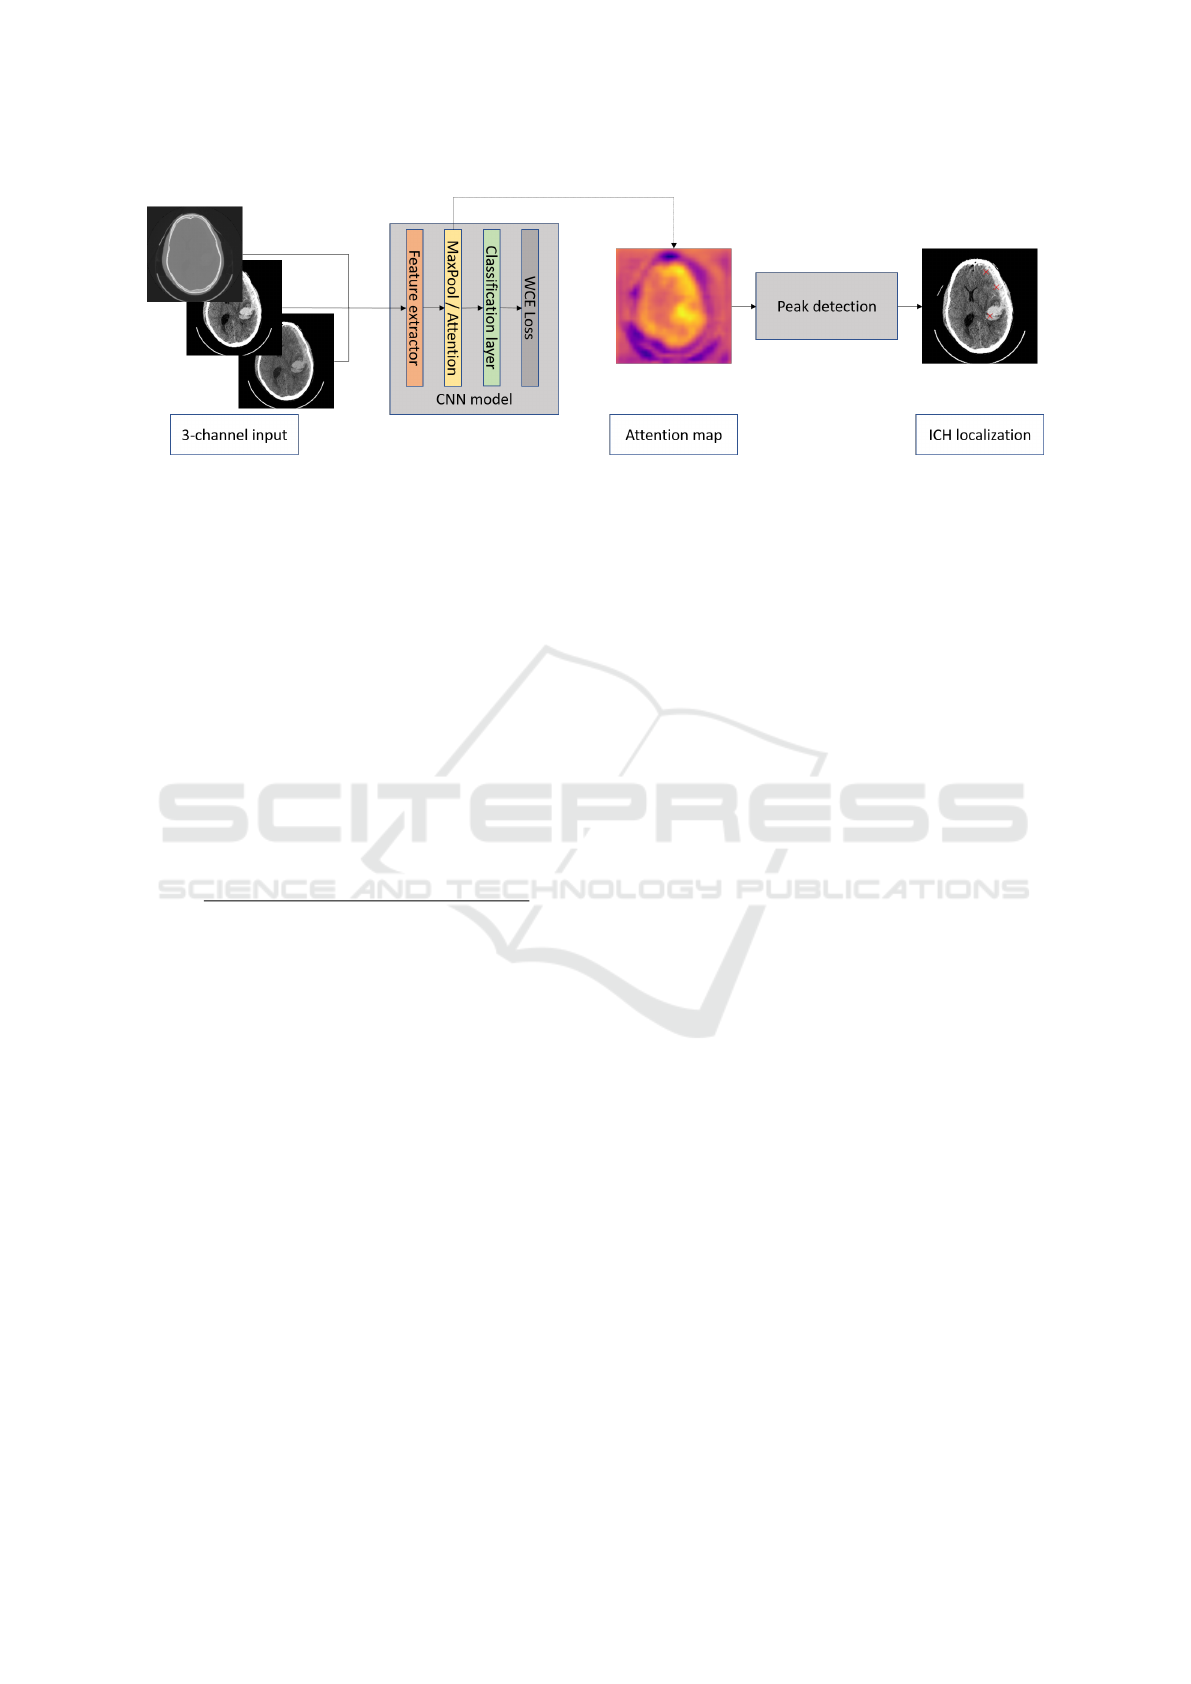
Figure 1: The overall pipeline of weakly supervised ICH detection algorithm.
at individual positions, and thus, it can be used as an
attention map. However, it is limited to the scalar fea-
ture map h
k
, which limits the classification capability
of the network (Ilse et al., 2018).
The MIL attention layer (Ilse et al., 2018) com-
putes the value of the output feature vector z as a
weighted average of low-dimensional embeddings h
k
:
z =
K
∑
k=1
a
k
h
k
. (2)
The weights a
k
are determined by a two one-layer
fully connected neural networks applied to each posi-
tion of the feature image, where outputs are element-
wise multiplied and transformed with softmax to
achieve that
∑
k
a
k
= 1:
a
k
=
exp{w
|
(tanh(Vh
|
k
) sigm(Uh
|
k
))}
∑
K
j=1
exp{w
|
(tanh(Vh
|
j
) sigm(Uh
|
j
))}
, (3)
where w ∈ R
L×1
, V ∈ R
L×M
and U ∈ R
L×M
are pa-
rameters of the small neural network, is an element-
wise multiplication, tanh() and sigm() are activation
functions representing hyperbolic tangent and sig-
moid nonlinearity. In the case of image, the fully
connected neural network can be realized by 1x1 con-
volution. The attention map a
k
represents the impor-
tance of individual positions to form the network’s de-
cision (Ilse et al., 2018).
2.4 Detector
Generated attention maps mark ICHs as the areas
with higher pixel values in comparison to the back-
ground. Hence, the detector finds local maxima via
comparison of the original image with a grayscale-
dilated (using the maximum filter) image (Koenderink
and van Doorn, 1992), and returns their coordinates
representing individual ICHs. To suppress irrele-
vant peaks with peak prominence smaller than h, h-
maxima transform (Thirusittampalam et al., 2013) is
performed. Besides, to avoid multiple and false find-
ings, the value of local maxima must be higher than
the threshold T and the minimal allowed distance be-
tween peaks is d. The optimal detector’s parameters
h, T and d were found by Bayesian optimization (for
details see section 2.5).
2.5 Implementation Details
Network was trained using Adam optimizer (Kingma
and Ba, 2014) with weight decay of 10
−6
, 1
st
and 2
nd
moment estimates were set to 0.9 and 0.999, respec-
tively. Learning rate 0.01 decaying to 10 % after 20,
10 and 5 epochs was used. Network from epoch with
optimal accuracy on validation set was used to gener-
ate results. Batch size 128 was used, where images
were randomly cropped to size 256. Furthermore,
augmentation was performed using: random mirror-
ing, random affine transformation (max. 30° rotation,
max. 10 % scaling, max. 5 % shearing), bright-
ness multiplying (max. 1.02×), brightness addition
(max. ±0.2), blurring/sharpening (max. 0.5 Gaus-
sian sigma and max. subtraction of 0.5×Laplacian).
The network contains 18 convolutional layers with 3
levels separated by pooling layers, where each level
contains 3 residual blocks (He et al., 2016). The
code is available at https://github.com/tomasvicar/
ICH-MIL-attention-based-detector.
Parameters of the detector were determined by
Bayesian optimization (Snoek et al., 2012) (imple-
mentation from (Nogueira, 2014)). The Dice coef-
ficient (DC) was maximized using 2/5 of CT data
from the CQ500 dataset. For the attention map given
by max-pooling layer and attention layer, the optimal
parameters are: h = 0.024, T = 0.76, d = 10, and
h = 0.0038, T = 0.024, d = 58, respectively.
Weakly Supervised Deep Learning-based Intracranial Hemorrhage Localization
113
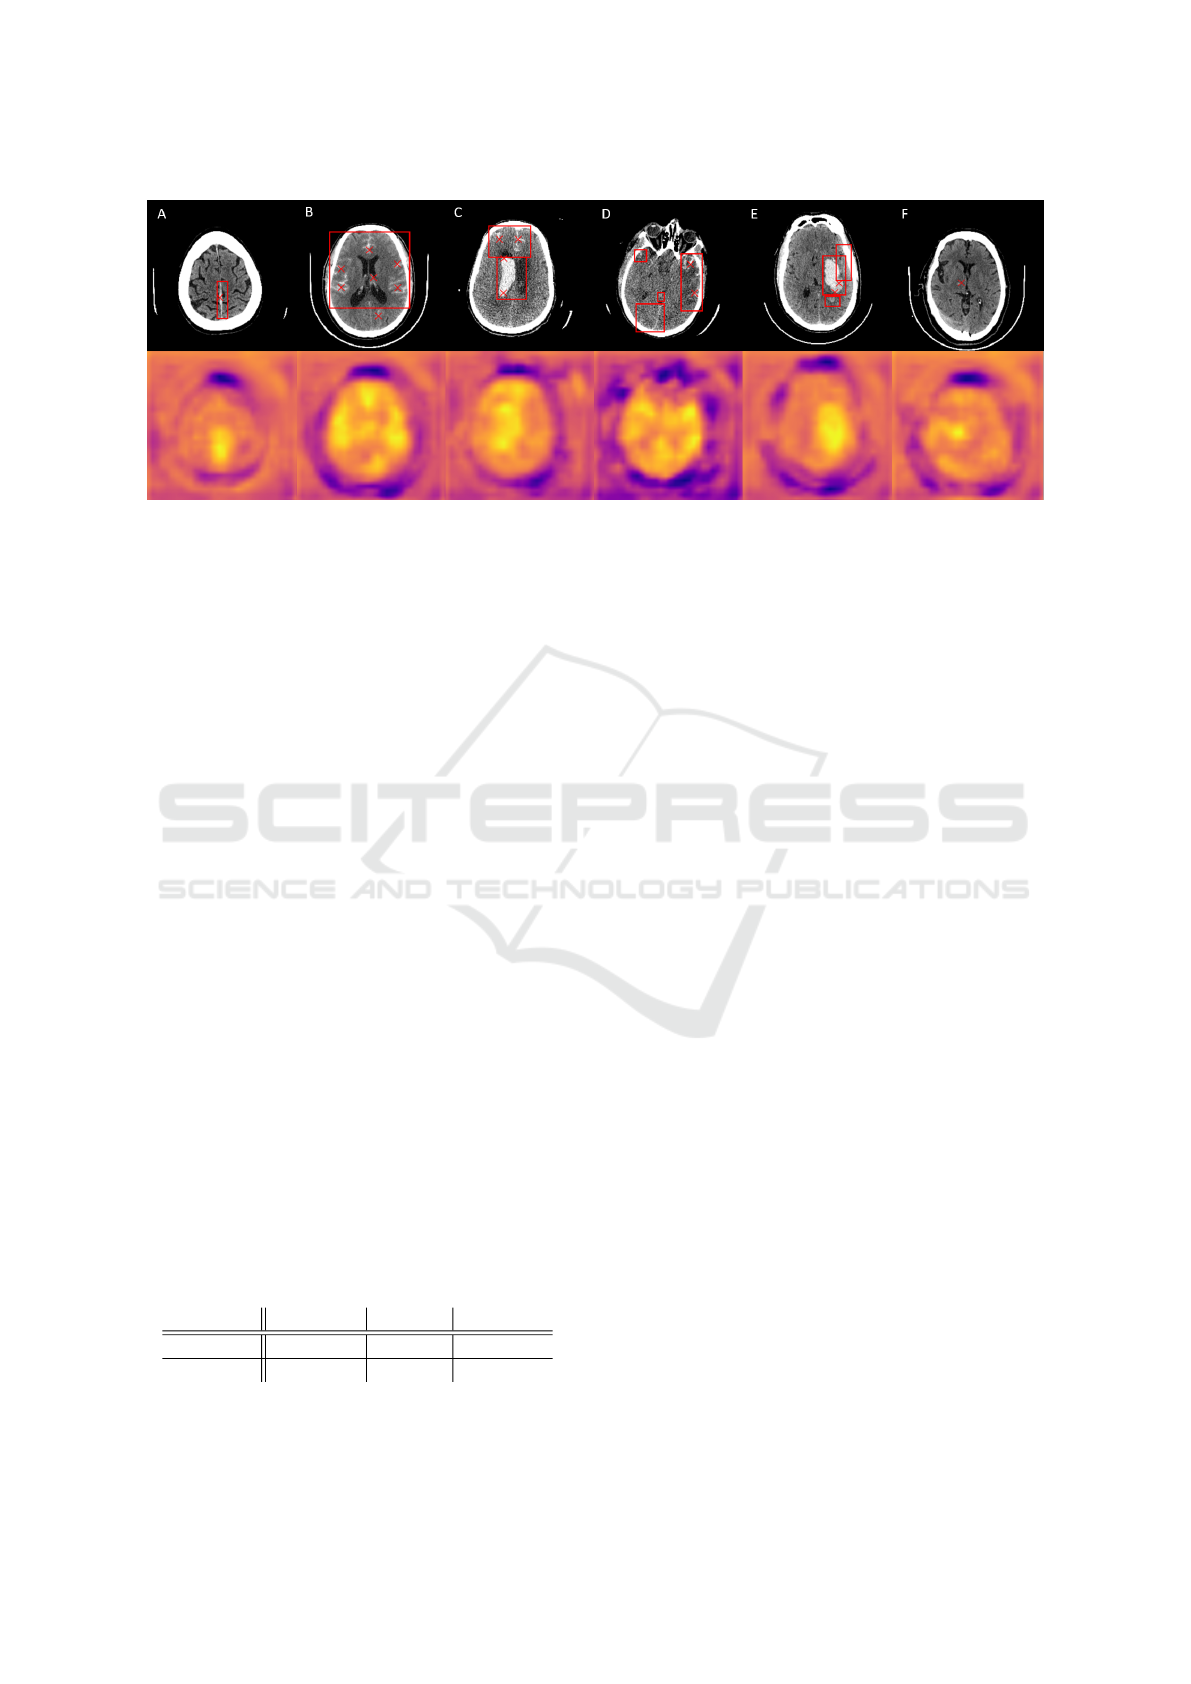
Figure 2: Top: Examples of ICH localization results (red ×-markers) together with annotated BB (red rectangle). Bottom:
Generated attention maps; yellow color denotes to higher pixel values in contrast to blue. A – Correct localization of single
subdural hemorrhage. B – Precise localization of individual subarachnoid bleedings with one FP finding. C – Multiple
intraventricular and subarachnoid hemorrhages localization resulting from multiple peaks in attention map. D – Bleedings
on the right are localized correctly; other bleedings are displayed in the attention map, however their maximal values are
insufficient to be localized. E – Multiple bleedings act like one massive high intensity area with two local maxima in the
attention map, hence only ICH in the middle is localized. F – False localization of unannotated high intensity region.
3 RESULTS AND DISCUSSION
The proposed detection method was tested on the re-
maining 3/5 of data from the CQ500 dataset (i.e., 254
scans, more than 55,000 slices) using slice-level BB
annotations. DC together with sensitivity (Se) and
positive predictive value (PPV) were chosen to eval-
uate the algorithm. To compute the metrics, the total
number of true positive (TP), false positive (FP), and
false negative (FN) results were calculated. TP is de-
fined as an intersection of the localized position and
the annotated BB (e.g., Fig. 2 C shows 2 TPs); FP
is the detection outside a BB (e.g., the isolated lower
finding in Fig. 2 B); FNs are the undetected BBs (e.g.,
Fig. 2 D shows 3 FNs). The overall results for the test
dataset are shown in Tab. 1.
The classification accuracy of the CNN on the val-
idation part of the RSNA dataset (circa 750 scans) was
89.54 % and 91.33 % for the model with max-pooling
and attention layer, respectively.
Table 1: The results of ICH localization algorithm on the
test dataset and comparison of both methods that were used
to generate likelihood maps: max-pooling and attention
layer. PPV (positive predictive value) indicates probability,
that localized position is truly ICH, SE (sensitivity) reflects
the percentage of correct localizations out of all ICHs.
Method PPV [%] SE [%] Dice [%]
Pooling 61.88 54.72 58.08
Attention 38.19 62.13 47.30
In this study, we proposed a weakly super-
vised deep-learning-based ICH localization algo-
rithm. Having only slice-level annotations, the detec-
tor was trained to predict the precise position of ICHs
in axial CT slices, which is the main advantage of the
proposed method. Classification CNN was used to
predict likelihood maps giving information about pos-
sible areas of bleeding. Maps highlight the regions
of CNN attention to predict the classification result.
Hence, likelihood maps may be considered as the in-
terpretation of the final classification.
Precise ICH positions were found by peak detec-
tion of the likelihood map. The detector was opti-
mized and tested on a publicly available dataset (dif-
ferent to training data) to test the generalization abil-
ity of the proposed approach to the new data and to
make the results potentially comparable. However,
considering the design of our experiment, any com-
parison of our approach with other authors would be
out of place at present owing to its uniqueness given
by the original and specific localization approach and
testing.
According to the evaluation results, the attention
maps given by the max-pooling layer seem more ap-
propriate for the localization. The detector can find
any type of ICHs (also in case of multiple bleedings)
despite their large size, shape, and location variabil-
ity. Even difficult-to-recognise bleedings are detected
– e.g., subdural hemorrhage in the higher intensity re-
gion of the cerebral falx (Fig. 2 A) or small bleeding
such as little intraparenchymal or subarachnoid hem-
orrhages (Fig. 2 B, C, D).
FN results might occur in some cases of small IPH
surrounded by large edema. Both FN and FP results
BIOIMAGING 2022 - 9th International Conference on Bioimaging
114

sometimes originate in the detected positional coor-
dinates closing aboard the BB. Besides, unannotated
high-intensity regions subjectively similar to an ICH
cause FP detections (Fig. 2 F).
Despite the possibility of false results, the detec-
tion ability denotes the high potential of the algo-
rithm to minimize the probability of missing an ICH
by oversight in clinical practice. Incorporation of the
method in a computer-aided diagnostic system might
warn a radiologist by highlighting the possible loca-
tions of ICHs while examining axial slices of a CT
scan. Besides, the algorithm might significantly de-
crease the examination time as the processing of a
slice takes only a few seconds. Considering the afore-
mentioned arguments, the clinical use of the algo-
rithm could help to prevent permanent disability or
even death.
4 CONCLUSIONS
This paper demonstrates a fully automated, weakly
supervised method for the localization of ICHs in ax-
ial head CT slices. The proposed algorithm is based
on local extrema detection in attention maps that are
obtained by a deep learning model and represent the
likelihood of ICH’s presence in the given slice. The
main advantage of the algorithm is the proposed MIL
position-free learning method, which is used for the
attention map generation. Our approach showed the
ability to localize ICHs using only slice-level annota-
tions. The Dice coefficient of 58.08 % was achieved
on data from publicly available dataset.
ACKNOWLEDGEMENTS
Computational resources were supplied by the project
"e-Infrastruktura CZ" (e-INFRA LM2018140) pro-
vided within the program Projects of Large Research,
Development and Innovation Infrastructures.
REFERENCES
Arbabshirani, M. R., Fornwalt, B. K., Mongelluzzo, G. J.,
Suever, J. D., Geise, B. D., Patel, A. A., and Moore,
G. J. (2018). Advanced machine learning in action:
identification of intracranial hemorrhage on computed
tomography scans of the head with clinical workflow
integration. NPJ digital medicine, 1(1):1–7.
Caceres, J. A. and Goldstein, J. N. (2012). Intracranial hem-
orrhage. Emergency Medicine Clinics of North Amer-
ica, 30(3):771–794.
Chang, P. D., Kuoy, E., Grinband, J., Weinberg, B. D.,
Thompson, M., Homo, R., Chen, J., Abcede, H.,
Shafie, M., Sugrue, L., et al. (2018). Hybrid 3d/2d
convolutional neural network for hemorrhage evalua-
tion on head ct. American Journal of Neuroradiology,
39(9):1609–1616.
Chilamkurthy, S., Ghosh, R., Tanamala, S., Biviji, M.,
Campeau, N. G., Venugopal, V. K., Mahajan, V., Rao,
P., and Warier, P. (2018). Development and validation
of deep learning algorithms for detection of critical
findings in head CT scans. CoRR, abs/1803.05854.
Cho, J., Park, K.-S., Karki, M., Lee, E., Ko, S., Kim,
J. K., Lee, D., Choe, J., Son, J., Kim, M., et al.
(2019). Improving sensitivity on identification and de-
lineation of intracranial hemorrhage lesion using cas-
caded deep learning models. Journal of digital imag-
ing, 32(3):450–461.
Flanders, A. E., Prevedello, L. M., Shih, G., Halabi, S. S.,
Kalpathy-Cramer, J., Ball, R., Mongan, J. T., Stein,
A., Kitamura, F. C., Lungren, M. P., Choudhary,
G., Cala, L., Coelho, L., Mogensen, M., Morón, F.,
Miller, E., Ikuta, I., Zohrabian, V., McDonnell, O.,
Lincoln, C., Shah, L., Joyner, D., Agarwal, A., Lee,
R. K., and Nath, J. (2020). Construction of a ma-
chine learning dataset through collaboration. Radiol-
ogy: Artificial Intelligence, 2(3).
Goldberger, A. L., Amaral, L. A. N., Glass, L., Haus-
dorff, J. M., Ivanov, P. C., Mark, R. G., Mietus,
J. E., Moody, G. B., Peng, C.-K., and Stanley,
H. E. (2000). PhysioBank, PhysioToolkit, and
PhysioNet: Components of a new research resource
for complex physiologic signals. Circulation,
101(23):e215–e220. Circulation Electronic Pages:
http://circ.ahajournals.org/content/101/23/e215.full
PMID:1085218; doi: 10.1161/01.CIR.101.23.e215.
He, K., Zhang, X., Ren, S., and Sun, J. (2016). Deep resid-
ual learning for image recognition. In 2016 IEEE Con-
ference on Computer Vision and Pattern Recognition
(CVPR), pages 770–778. IEEE.
Ilse, M., Tomczak, J., and Welling, M. (2018). Attention-
based deep multiple instance learning. In Dy, J. and
Krause, A., editors, Proceedings of the 35th Interna-
tional Conference on Machine Learning, volume 80
of Proceedings of Machine Learning Research, pages
2127–2136. PMLR.
Ker, J., Singh, S. P., Bai, Y., Rao, J., Lim, T., and Wang, L.
(2019). Image thresholding improves 3-dimensional
convolutional neural network diagnosis of different
acute brain hemorrhages on computed tomography
scans. Sensors, 19(9):2167.
Kingma, D. P. and Ba, J. (2014). Adam: A
method for stochastic optimization. arXiv preprint
arXiv:1412.6980.
Koenderink, J. J. and van Doorn, A. J. (1992). Surface shape
and curvature scales. Image and Vision Computing,
10(8):557–564.
Lee, H., Yune, S., Mansouri, M., Kim, M., Tajmir, S. H.,
Guerrier, C. E., Ebert, S. A., Pomerantz, S. R.,
Romero, J. M., Kamalian, S., et al. (2019). An ex-
plainable deep-learning algorithm for the detection of
Weakly Supervised Deep Learning-based Intracranial Hemorrhage Localization
115

acute intracranial haemorrhage from small datasets.
Nature biomedical engineering, 3(3):173–182.
Majumdar, A., Brattain, L., Telfer, B., Farris, C., and
Scalera, J. (2018). Detecting intracranial hemorrhage
with deep learning. In 2018 40th annual international
conference of the IEEE engineering in medicine and
biology society (EMBC), pages 583–587. IEEE.
Nguyen, N. T., Tran, D. Q., Nguyen, N. T., and Nguyen,
H. Q. (2020). A cnn-lstm architecture for detection of
intracranial hemorrhage on ct scans.
Nogueira, F. (2014). Bayesian Optimization: Open source
constrained global optimization tool for Python.
Patel, A., Schreuder, F. H., Klijn, C. J., Prokop, M., van
Ginneken, B., Marquering, H. A., Roos, Y. B., Ba-
haroglu, M. I., Meijer, F. J., and Manniesing, R.
(2019). Intracerebral haemorrhage segmentation in
non-contrast ct. Scientific reports, 9(1):1–11.
Reis, E. P., Nascimento, F., Aranha, M., Mainetti Secol,
F., Machado, B., Felix, M., Stein, A., and Amaro, E.
(2020). Brain hemorrhage extended (bhx): Bounding
box extrapolation from thick to thin slice ct images.
Snoek, J., Larochelle, H., and Adams, R. P. (2012). Prac-
tical bayesian optimization of machine learning algo-
rithms. In Advances in neural information processing
systems, pages 2951–2959.
Thirusittampalam, K., Hossain, M. J., Ghita, O., and Whe-
lan, P. F. (2013). A novel framework for cellular track-
ing and mitosis detection in dense phase contrast mi-
croscopy images. IEEE journal of biomedical and
health informatics, 17(3):642–653.
Ye, H., Gao, F., Yin, Y., Guo, D., Zhao, P., Lu, Y., Wang,
X., Bai, J., Cao, K., Song, Q., et al. (2019). Precise di-
agnosis of intracranial hemorrhage and subtypes using
a three-dimensional joint convolutional and recurrent
neural network. European radiology, 29(11):6191–
6201.
BIOIMAGING 2022 - 9th International Conference on Bioimaging
116
