
Designing a New Layout for a Balanced Production Line: A Practical
Application
Marlene Br
´
as
1
and Ana Moura
1,2
1
Department of Economics, Management, Industrial Engineering and Tourism, University of Aveiro, Portugal
2
GOVCOPP – Systems for Decision Support Research Group, University of Aveiro, Portugal
Keywords:
Layout Design, Assembly Line Balancing, Systematic Layout Planning, Linear Programming.
Abstract:
In most manufacturing companies, the layout designs and line balancing problems are often based on per-
sonal experience and made without following a theoretical methodology. By applying those ad-hoc solutions,
various problems may arise when quick changes of capacity or any other constraints occur. This work was de-
veloped for a Portuguese SME in the electronics industry, that had some changes at the production level, which
caused limitations in terms of space on the factory floor. Furthermore, it was also revealed that an existing
production line with high production rates was gradually losing efficiency. Bringing these two issues together,
the idea was to design a new plant layout to improve the performance of this production line, considering the
new space constraints. To increase the production line efficiency, decisions such as the number of workers
and assembly task assignment to stations need to be optimized to increase its throughput and decrease cost.
An integer linear programming model was developed and used to solve the balancing problem. Considering
six different optimization criteria, five variants of the model were tested. Using the best solution according
to predefined Key Indicators Performance, the layout was developed using the Systematic Layout Planning
approach.
1 INTRODUCTION
The layout design problem is a strategic issue and has
a significant impact on the efficiency of a manufactur-
ing system (Islam et al., 2014). Layout design is con-
sidered one of the keys elements to operations man-
agement since it maximizes the resource usage and
the overall system throughput (Yemane et al., 2017).
A good layout determines the efficiency of all opera-
tions in a system.
This work presents a case study that takes place
in a Portuguese Small and Medium-sized Enterprise
(SME) in the electronics industry. To insert a new pro-
duction line on the factory floor, the company needs to
relocate an existing production line - Induction Cook-
ing Plates (ICP) production line - whose efficiency
has been decreasing due to lack of continuous im-
provement. Considering the product production pro-
cess, the company resources, and the available shop
floor area, a new layout for the ICP production line
was studied. The idea is, when designing the new lay-
out, to improve the efficiency of the production line
through its balancing and, simultaneously, adapt it to
the new available area. For this, two of the problems
that were addressed and solved were the layout design
and the assembly line balancing problems.
One of the most applied and successful method-
ology used to plan a proper layout is the Systematic
Layout Planning (SLP) technique. SLP is a proce-
dure layout design approach (Yang et al., 2000) de-
veloped in 1973 by Richard Muther (Muther, 1973),
and successfully implemented in SMEs, existing sev-
eral studies of its application (Naqvi et al., 2016;
Fahad et al., 2017; Tak and Yadav, 2012; Wiyaratn
et al., 2013). The SLP is a technique used to ar-
range a workplace in a plant by locating two areas
with high frequency and logical relationships close
to each other. It involves the collection of informa-
tion for the development of a relationship chart (step
1). This chart highlights the desirability levels of ad-
jacency between pairs of resources, classifying them
with the code A (absolutely necessary), E (especially
important), I (important), O (ordinary), U (unimpor-
tant), and X (undesirable). Through the analysis of
this information, a relationship diagram is elaborated.
This diagram shows the resources connected through
lines, in which the desirability levels of adjacency be-
tween the resources, dictates the lines characteristics
Brás, M. and Moura, A.
Designing a New Layout for a Balanced Production Line: A Practical Application.
DOI: 10.5220/0010827400003117
In Proceedings of the 11th International Conference on Operations Research and Enterprise Systems (ICORES 2022), pages 161-168
ISBN: 978-989-758-548-7; ISSN: 2184-4372
Copyright
c
2022 by SCITEPRESS – Science and Technology Publications, Lda. All rights reserved
161

– thickness and color. The latter is analyzed in order
to elaborate the layout solutions (step 2). Finally, de-
pending on the predefined Key Performance Indica-
tors (KPIs), the most favorable layout is chosen (step
3).
Production activities in manufacturing industry
are closely related to the assembly line balanc-
ing (Syahputri et al., 2018). The combination of lay-
out design with line balancing techniques has already
proven to be quite advantageous (Syahputri et al.,
2018; Buchari et al., 2018). Therefore, a virtuous
layout can be designed, and productivity can be in-
creased through an appropriate assembly line balanc-
ing (Yemane et al., 2017). An assembly line is a set
of workstations arranged sequentially and intercon-
nected by a material conveyor system. At each work-
station, a set of predefined tasks (or operations) are
executed in an assembly process. Each task is defined
by its processing time (the time required to execute a
given task) and its precedence constraints (the set of
constraints that determines the sequence according to
which tasks can be executed).
The Simple Assembly Line Balancing Problem
(SALBP) was initially formulated by (Salveson,
1955). This problem consists of assigning a set of
tasks to a set of workstations, intending to minimize
the number of workstations or the cycle time of the
production line. The assignment of tasks to work-
stations is done to ensure that the assembly line can
meet the costumers’ demand. (Scholl and Becker,
2006) states that there are four formulations for the
SALBP: SALBP-1 (minimizing the number of work-
stations for a given cycle time), SALBP-F (estab-
lishing whether a feasible line balance exists for a
given combination of workstations and cycle time),
SALBP-2 (minimizing the cycle time for a given
number of workstations), and SALBP-E (minimizing
the cycle time and the number of workstations con-
sidering their interrelationship).
There are some considerations that can be in-
corporated in the assembly line balancing models:
assignment constraints (Task-related or zone con-
straints, Workstations constraints, Positioning con-
straints and Operators’ constraints), parallel lines,
parallel workstations, and U-shaped assembly lines.
So many researchers, over the last decades, have
studied the SALBP in many ways, depending on the
constraints and the goals considered. Most of the pub-
lished papers are focused on SALBP where the per-
formance measure is either minimizing the number of
stations or the cycle time. Using different preference
criteria to assign tasks to the workstations, results in
different heuristics. A simple heuristic refers to sort-
ing the tasks in descending order (MaxTime Heuris-
tic) or ascending order (MinTime Heuristic) of their
processing time. After this ordering, the tasks are
assigned to the workstations according to the estab-
lished order, considering that the defined cycle time
cannot be exceeded. In the heuristic designated by
the notation MaxG, the assignment of tasks to work-
stations is carried out in decreasing order of each task
processing time divided by the upper bound. Another
heuristic example is the MaxS (or Greatest), in which
the allocation is made by prioritizing the tasks with
the greatest number of successors. Finally, in the
Ranked Positional Weight (RPW) heuristic, the as-
signment of tasks is made in descending order of the
ranked positional weight of each task.
The paper is divided into four sections. This one
(section 1) is a brief introduction to the problem and a
review of approaches and studies available in the lit-
erature. In section 2, the case study is presented, as
well as the production line under study.It is followed
by the layout design approach explanation in section
3, in which the obtained results are showcased and an-
alyzed. Finally, in section 4, conclusions on the com-
parison of the solutions effectiveness are provided as
well some future work remarks.
2 CASE STUDY: PROBLEM
DESCRIPTION AND
CHARACTERIZATION
The practical case under study takes place in a
SME belonging to a group in the electronic in-
dustry. This group develops and produces effi-
cient, sustainable, and suitable solutions for the
Smart Cities/Utilities, Smart Buildings/Installations,
and Smart Homes/Appliances. The company is ded-
icated to the production of Induction Cooking Plates
(ICP), LED Lights and, more recently, a new prod-
uct, that for the sake of disclosure, will be referenced
throughout this paper as MWMs.
The insertion of the new production line for the
MWM production was an excellent opportunity to
study the optimization of the existing production line
whose efficiency has been decreasing, the ICPs pro-
duction line. The shop floor is divided between two
floors. With the insertion of the MWM production
line on the upper floor, there was a reorganization of
the remaining space on the same floor. With this reor-
ganization, the opportunity to separate the processes
of automatic insertion of electronic components from
the processes of manual insertion of electronic com-
ponents and ICP encapsulation arose. Therefore, at
the company’s request, the space available on the up-
ICORES 2022 - 11th International Conference on Operations Research and Enterprise Systems
162
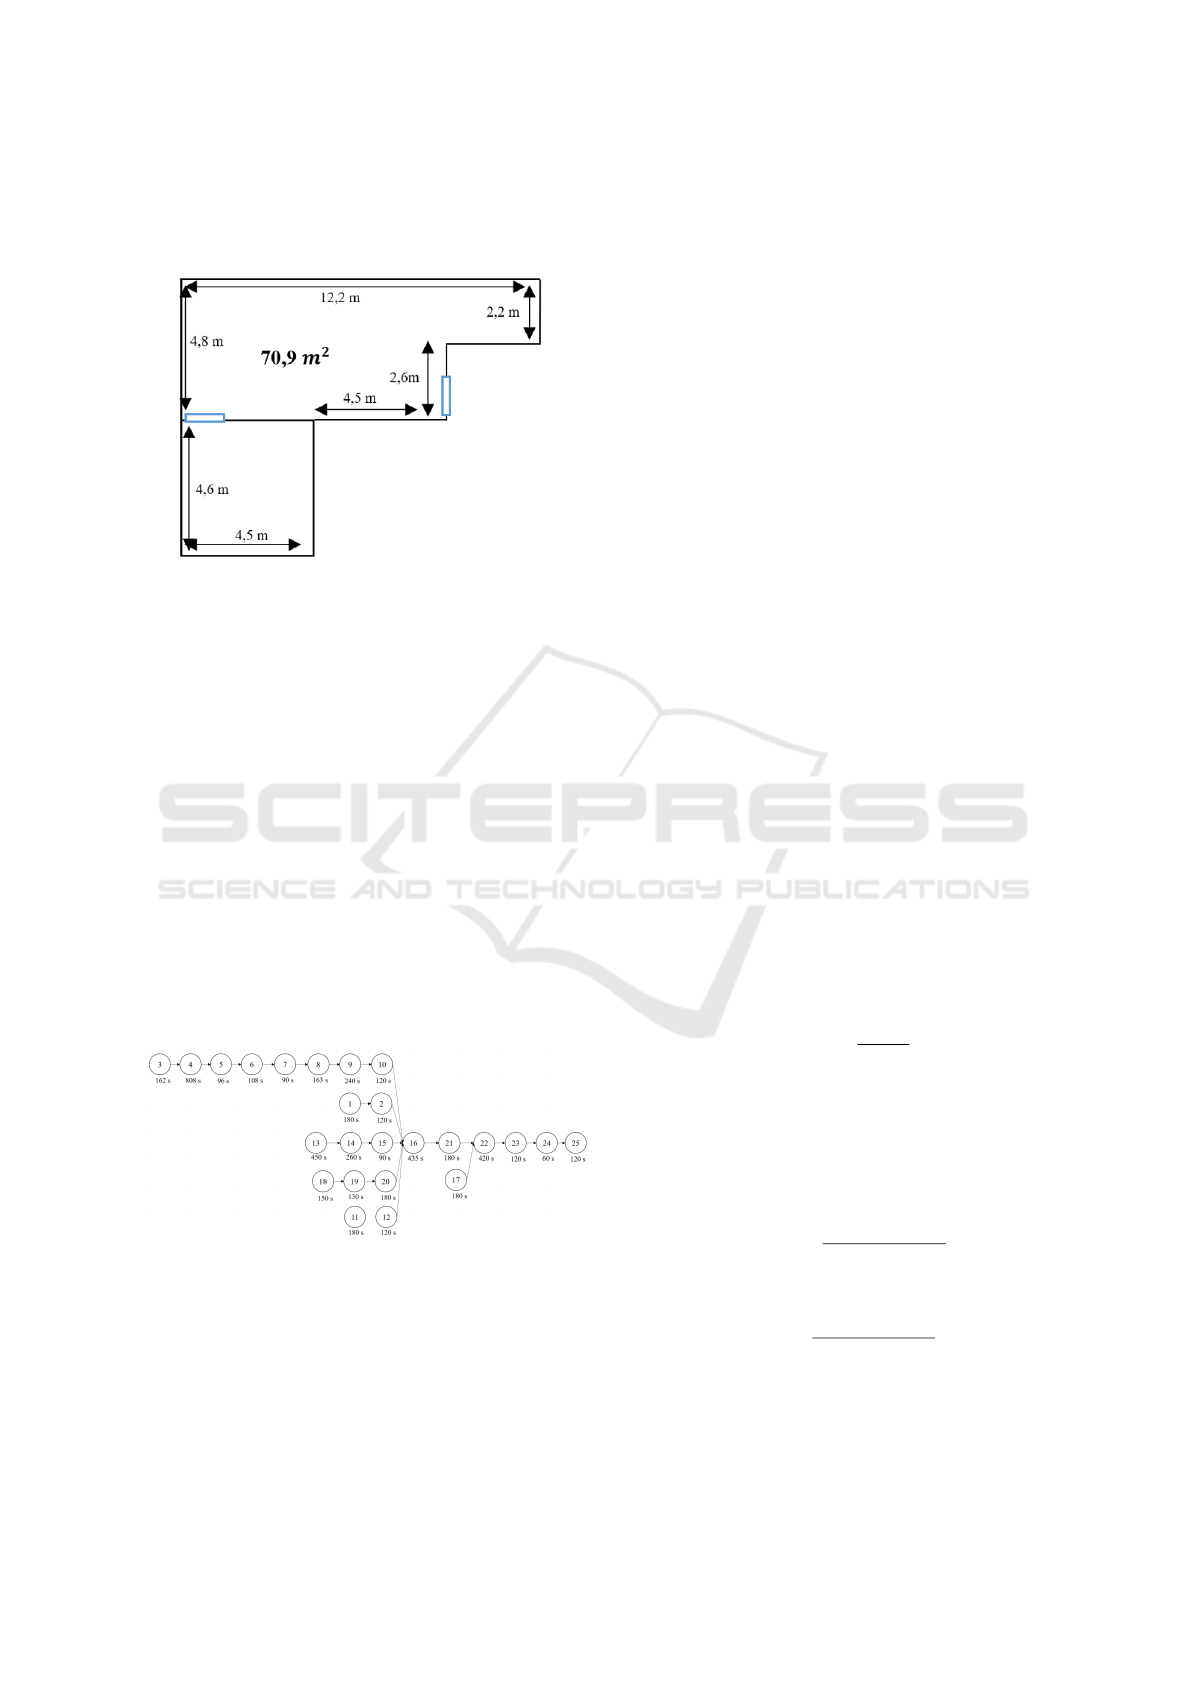
per floor (Figure 1) was studied, to insert the final pro-
cesses of manual insertion of components and encap-
sulation of the ICP production line.
Figure 1: Available space in the upper floor.
It is important to reinforce that there are processes
that will remain on the lower floor due to the sharing
of machines with other production lines. Therefore,
these processes will not be included in this study.
There are several models of induction cooking
plates available. The data used in this study corre-
spond to a model that, for the sake of disclosure, will
be referenced throughout this paper as PB. This model
uses all the available resources to produce any model
of ICPs.
The Induction Cooking Plates are composed by an
electronic components module called Main ICP, a set
of magnetic induction exchangers (MIEs), a support
base, a display module designated by IURI with an
interface called TecBit, and finally, a glass.
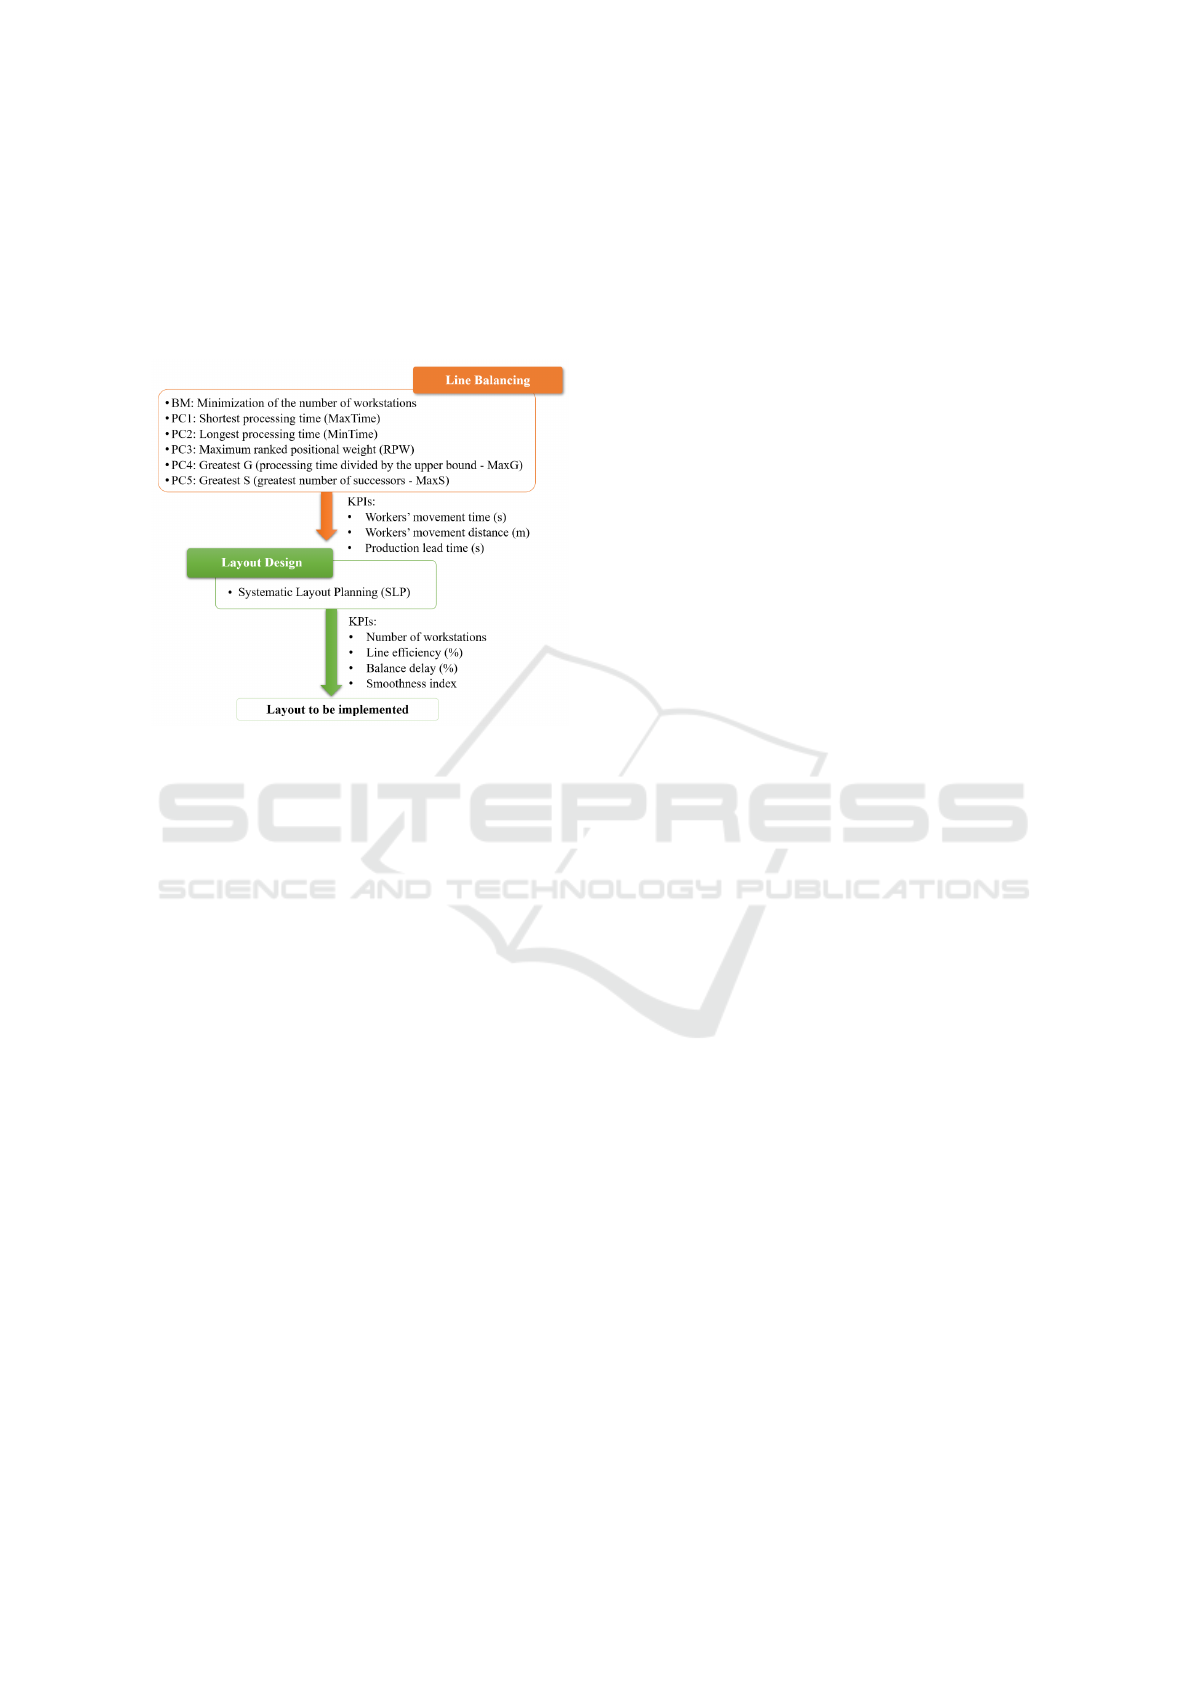
According to the ICP production process, a prece-
dence diagram was drawn and is presented in Figure
2.
Figure 2: ICP precedence diagram.
Considering the costumers’ demand, the company
aims to produce 5 units/hour, which implies a cycle
time of 720 seconds/unit. This means that each work-
station will have a cycle time of 720 seconds in which
all the tasks assigned to it must be carried out. How-
ever, when the precedence diagram is analyzed, it can
be seen that there is a task that has a processing time
greater than the desired cycle time (Task 4 - 808 sec-
onds). This means that whatever workstation this task
is assigned to, will have to be duplicated. Besides
this, there are some tasks assignment constraints that
must be considered, more specifically, task-related or
zone constraints. At the company’s request, the re-
sources associated with tasks 21 and 23 cannot be in
the same workstation due to safety conditions. Tasks
3 to 6 need to be in the same workstation due to re-
source constraints, and for the same reason, the same
happens for tasks 18 to 20. It is important to mention
that although these tasks require the same resources,
they are performed by different workers.
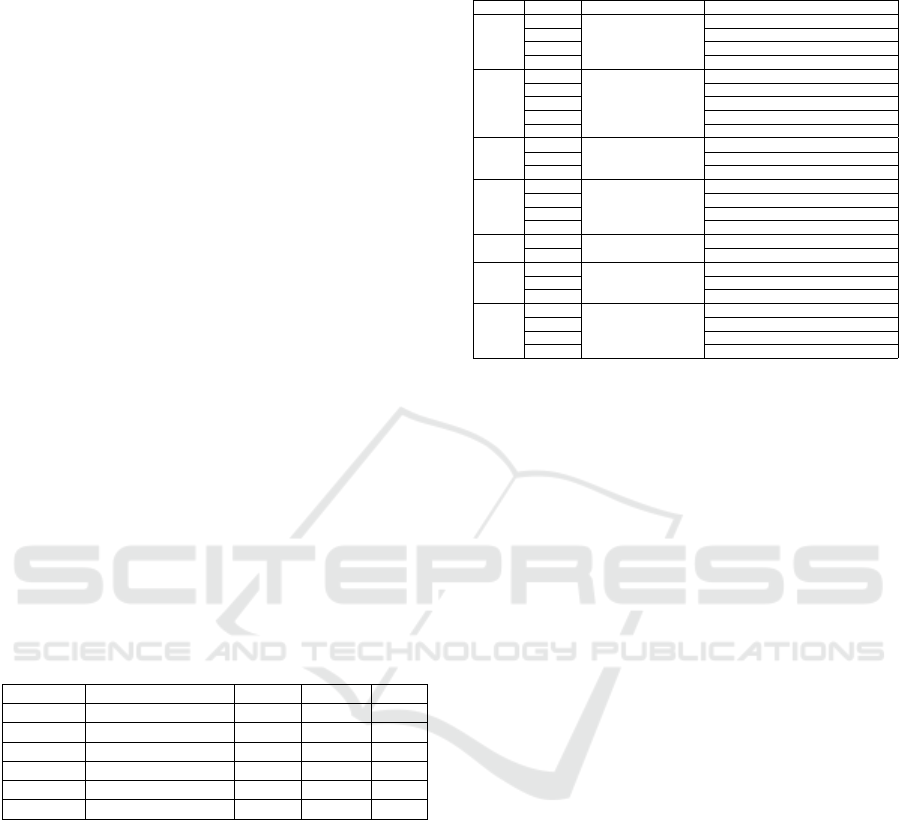
3 ICP LAYOUT DESIGN
The layout design methodology was divided into two
steps: line balancing and layout design (Figure 3).
In the first step, it was solved an assembly line
balancing problem using an integer linear program-
ming model (Section 4.4.1). Based on this base
model (BM), 5 variants were also used and tested, us-
ing different preference criteria (PC) to assign task
to the workstations: PC1-shortest Processing Time
(MinTime); PC2-longest Processing Time (Max-
Time); PC3-Greatest RPW (RPW); PC4-Greatest G
(MaxG) (maximum processing time divided by the
upper bound); PC5-Greatest S (MaxS or Greatest)
(Greatest number of successors). The line balancing
results were compared using the following KPIs:
• Number of Workstations;
• Line Efficiency (LE): is the ratio of workstations
time and the cycle time multiplied by the number
of workstations;
LE(%) =
∑
N
i=1
t
i
C ×W
; (1)
where t
i
is the processing time of task i in seconds
(i ∈ {1, . . . , N}), N is the number of tasks and W
is the number of workstations.
• Balance Delay (BD): is the ratio between the idle
time in the production line balancing and the time
available;
BD(%) =
C ×W −
∑
N
i=1
t
i
C ×W
; (2)
• Smoothness Index (SI): is an index that becomes
the relative refining index of a production line bal-
ance.
SI =
s
w
∑
j=1
(T
max
− T
j
)
2
(3)
where T
max
is the maximum workstation time, and
T
j
is the time of the j
th
workstations.
Designing a New Layout for a Balanced Production Line: A Practical Application
163
In the second stage, using the best solution found
in the previous stage, the facility layout problem
(FLP) was resolved using the Systematic Layout
Planning (SLP) approach. The layout was evaluated
using the standard KPIs related to production time
- workers’ movement time, workers’ movement dis-
tance, and production lead time.
Figure 3: ICP layout design.
3.1 ICP Production Line Balancing
Approach
This study deals with a SALBP-1 problem, that is re-
lated to allocation of tasks to workstations in a pre-
defined cycle time, while minimizing the number of
workstations needed. As presented in the Section 2.1,
this problem deals with some features related to the
tasks processing time, precedence relations and zone
constraints.
Considering the product characteristics, the prece-
dence diagram and all the constraints presented in the
Section 2.1, an integer linear programming model was
developed to solve the balancing problem of this pro-
duction line.
3.1.1 Mathematical Model
The proposed integer linear programming model is a
simple assembly line balancing model with parallel
jobs and zone constraints. This model is based on the
following assumptions:
• The line is dedicated to the production of a single
product;
• According to the production volume and the time
interval for production, there is a predefined cycle
time;
• The product assembly follows a set of tasks, each
with a predetermined execution time and with
precedence rules between them;
• The tasks are processed at a set of workstations;
• A task can only be allocated to a single station;
• There are zone constraints, which are related to
the compatibility and incompatibility of perform-
ing certain tasks in the same workstations;
• A workstation can be parallelized at most once,
but only if the processing time of one of the tasks,
assigned to that station, exceeds the predefined cy-
cle time;
A possible line balance, i.e., an assignment of
tasks to workstations, can be done according to dif-
ferent objectives, but the most common is to minimize
the number of workstations for a given cycle time and
simultaneously balancing the workloads between the
workstations.
The following notations and variables are used for
the proposed model:
Notations:
• N: Set of tasks, i ∈ {1, . . . , n};
• W: Set of workstations, j ∈ {1, . . . , w};
• P: Set of all immediate predecessors;
• (pre, post): Pair of precedence relations among
tasks, where task pre should immediately precede
task post;
• t
i
: Processing time of task i, in seconds;
• C: Cycle time, in seconds;
• AC: Assignment compatibility, set of tasks that
must be assigned to the same workstation;
• (tC1, tC2): Pair of compatibility relations among
tasks;
• AI: Assignment incompatibility, set of tasks that
cannot be assigned to the same workstation;
• (tI1, tI2): Pair of incompatibility relations among
tasks;
• MaxDW: Maximum number of stations duplica-
tion;
• M: Very high positive integer number.
Decision variables:
x
i j
=
(
1, if the task i is assigned to workstation j i ∈ N, j ∈ W
0, otherwise
r
j
=
(
1, if the workstation j is duplicated j ∈ W
0, otherwise
ICORES 2022 - 11th International Conference on Operations Research and Enterprise Systems
164

Considering all the assumptions, variables and
data, the idea is to assign all the tasks to worksta-
tions, ensuring all the constraints, while minimizing
the number of needed workstations. The mathemati-
cal model can be written as:
Min
W
∑
j=1
j × x
n j
(4)
subject to:
W
∑
j=1
x
i j
= 1;∀i ∈ N (5)
W
∑
j=1
j × x
i.pre j
≤
W
∑
j=1
j × x
i.post j
;∀i ∈ P (6)
x
i.tC1 j
= x
i.tC2 j
;∀i ∈ AC; ∀ j ∈ W (7)
x
i.tI1 j
+ x
i.tI2 j
≤ 1;∀i ∈ AI; ∀ j ∈ W (8)
N
∑
i=1
t
i
× x
i j
≤ C × (1 + r
j
× (MaxDW − 1));∀ j ∈ W
(9)
r
j
≤
N
∑
i=1,t
i
>C
x
i j
;∀ j ∈ W (10)
M × r
j
≥
N
∑
i=1,t
i
>C
x
i j
;∀ j ∈ W (11)
x
i j
∈ {0, 1}; (12)
r
j
∈ {0, 1}; (13)
The objective function given in Eq. (4) minimizes
the number of workstations.
According to Eq. (5), each task must be assigned
to only one workstation. Eq. (6) is associated with the
operations precedence, and prevents that a successor
task of task i, be assigned to a workstation before task
i is processed. Eq. (7) and (8) are the zone constraints
that define the sets of task pairs that must be allocated
to the same workstation (compatible tasks) and task
pairs that cannot be allocated to the same workstation
(incompatible tasks). If there are tasks that must be
performed at the same workstation, this is guaranteed
by Eq. (7). Eq. (8) ensures just the opposite, that
is, incompatible tasks are not assigned to the same
workstation.
Eq. (9), (10) and (11) are constraints concerning
parallel workstations: Eq. (9) ensures that the capac-
ity of each station is not exceeded; Eq. (10) ensures
that the predefined number of parallel workstations is
not exceeded; and Eq. (11) ensures that only work-
stations with assigned tasks, whose processing time
exceeds the cycle time, can be replicated.
Eq. (12) and (13) define the domain of the deci-
sion variables.
3.1.2 Different Criteria Approaches
In addition to this model, it was intended to test other
approaches to the problem using the well-known pref-
erence criteria (PC) presented in section 1. Each of
these PCs is a different way of assigning tasks to
workstations, each corresponding to a typical heuris-
tic of balancing problems. Considering five PC, five
variants of the previous model (named Base model -
BM) were created. For that, the following additional
notations must be considered:
Additional Notation:
• S: is the set of all immediate successors;
• RPW
i
= t
i
+
∑
r∈S
t
r
: is the Ranked positional
weight of task i;
• G
i
=
t
i
UB
i
: is the Greatest of task i, defined by the
processing time divided by the workstations upper
bound ((UB
i
= N + 1[
t
i
+
∑
r∈S
t
r
C
]
+
);
• S
i
: is the number of Successors of task i;
As mentioned before, it is important that the num-
ber of workstations is as small as possible, due to the
existing workforce in the company. However, the fair
distribution of work between the several workstations
is also important. So, since minimizing the number
of workstations (Eq. (4): Min
∑
W
j=1
jx
n j
) is one of
the company’s main priority and the main goal for the
plant layout, the optimal solution obtained by the BM
will be considered as an upper-bound for the number
of workstations.
Each PC approach has an objective function that
corresponds to the related preference criteria, which
dictates what tasks are preferred when assigning to
stations. As such, five more models were tested (PC1,
PC2, PC3, PC4 and PC5), differing only in the objec-
tive function.
• PC1, tasks with shortest processing times are
given priority:
Min
W
∑
j=1
N
∑
i=1
t
i
x
i j
(14)
Designing a New Layout for a Balanced Production Line: A Practical Application
165
• PC2, tasks with longest processing times are given
priority:
Max
W
∑
j=1
N
∑
i=1
t
i
x
i j
(15)
• PC3, tasks with bigger RPW are given priority:
Max
W
∑
j=1
N
∑
i=1
RPW
i
x
i j
(16)
• PC4, tasks with bigger G are given priority:
Max
W
∑
j=1
N
∑
i=1
G
i
x
i j
(17)
• PC5, tasks with bigger S are given priority:
Max
W
∑
j=1
N
∑
i=1
S
i
x
i j
(18)
An upper-bound on the number of workstations is
added to each model and settled to 8 workstations.
The mathematical model (BM) and its variants (from
PC1 to PC5) were implemented using the CPLEX
Studio IDE 20.1.0. The six models were tested with
different problems instances and the results related to
the ICP production line are presented in Table 1.
Table 1: Models variants quantitative results.
Approach No. of workstations LE (%) BD (%) SI
BM 8 89,6 10,4 274,6
PC1 8 89,6 10,4 384,6
PC2 8 89,6 10,4 296,8
PC3 8 89,6 10,4 391,4
PC4 8 89,6 10,4 274,6
PC5 8 89,6 10,4 301,5
All the model variants achieved the optimal solu-
tion of 8 workstations, having also the same line ef-
ficiency and balance delay. One way to evaluate this
solution is by comparing it with the theoretical mini-
mum number of workstations. This value is computed
according to the cycle time and the summation of the
tasks processing time. The theoretical minimum num-
ber of workstations is 7 (workstations lower-bound).
However, when computing this value, theoretically, it
is not consider all the problem constraints. As this
problem has a large set of constraints, the fact of ob-
taining 8 workstations with the models we can con-
sider it a very good solution. So, it could be stated
that in all the 6 approaches, the tasks are fairly di-
vided by all the workstations, and the line efficiency
is relatively good.
Table 2: Set of workstations resulting from the BM and
PC4.
Workst. Task No. Workst. Proc. Time (s) Resource required
1
1
600
CT1 w/ computer
2 CT2 w/ platform 1
11 CT6
12 CT6 w/ platform 3
2 and 3
3
632
CT3 w/ supporting tool
4 CT3 w/ supp. tool and wind. machine
5 CT3 w/ supp. tool
6 CT3 w/ supporting tool
7 CT4 (CT4.1)
4
8
523
CT4
9 CT4
10 CT5 w/ platform 2
5
17
640
CT8
18 CT9 w/ platform 4
19 CT9 w/ platform 4
20 CT9 w/ platform 4
6
13
710
CT7 (CT7.1)
14 CT7 (CT7.1)
7
15
705
CT7
16 CT7
21 CT13; WR1; WR2; HP
8
22
720
CT10
23 CT12 w/ platform 5
24 CT11
25 CT11
The minimum value of the smoothness index is
0 which indicates a perfect balance, i.e., a smaller
smoothness index indicates a production line closer
to a perfect balance. Therefore, by analysing the re-
sults, it was possible to conclude that the best solution
is achieved when considering both the BM and the
PC4 model, i.e., considering only the minimization of
the number of workstations, and when the priority is
given to the tasks with bigger G (processing time di-
vided by the upper bound). Both approaches have the
same solution related to the number of workstations,
and these workstations also have the same assigned
tasks (Table 2). For any of the models the processing
times were quite short, always reaching the optimal
solution in less than one minute.
In order to implement the solutions obtained by
the BM and its variants (PC1 to PC5 models) on the
shop floor, it turns out that, according to the task
grouping, some resources (marked in bold in Table
2) must be duplicated. That is, there were tasks that
need the same resources, but they were allocated to
different workstations (Table 2). To solve this prob-
lem, a duplication of resources (CT4 and CT7) was
carried out. Important to mention that this duplica-
tion did not incur in significant costs for the layout
implementation.
3.2 ICP Layout Design Approach
As mentioned previously, the Facility Layout Prob-
lem was solved through the application of the Sys-
tematic Layout Planning method.
ICORES 2022 - 11th International Conference on Operations Research and Enterprise Systems
166
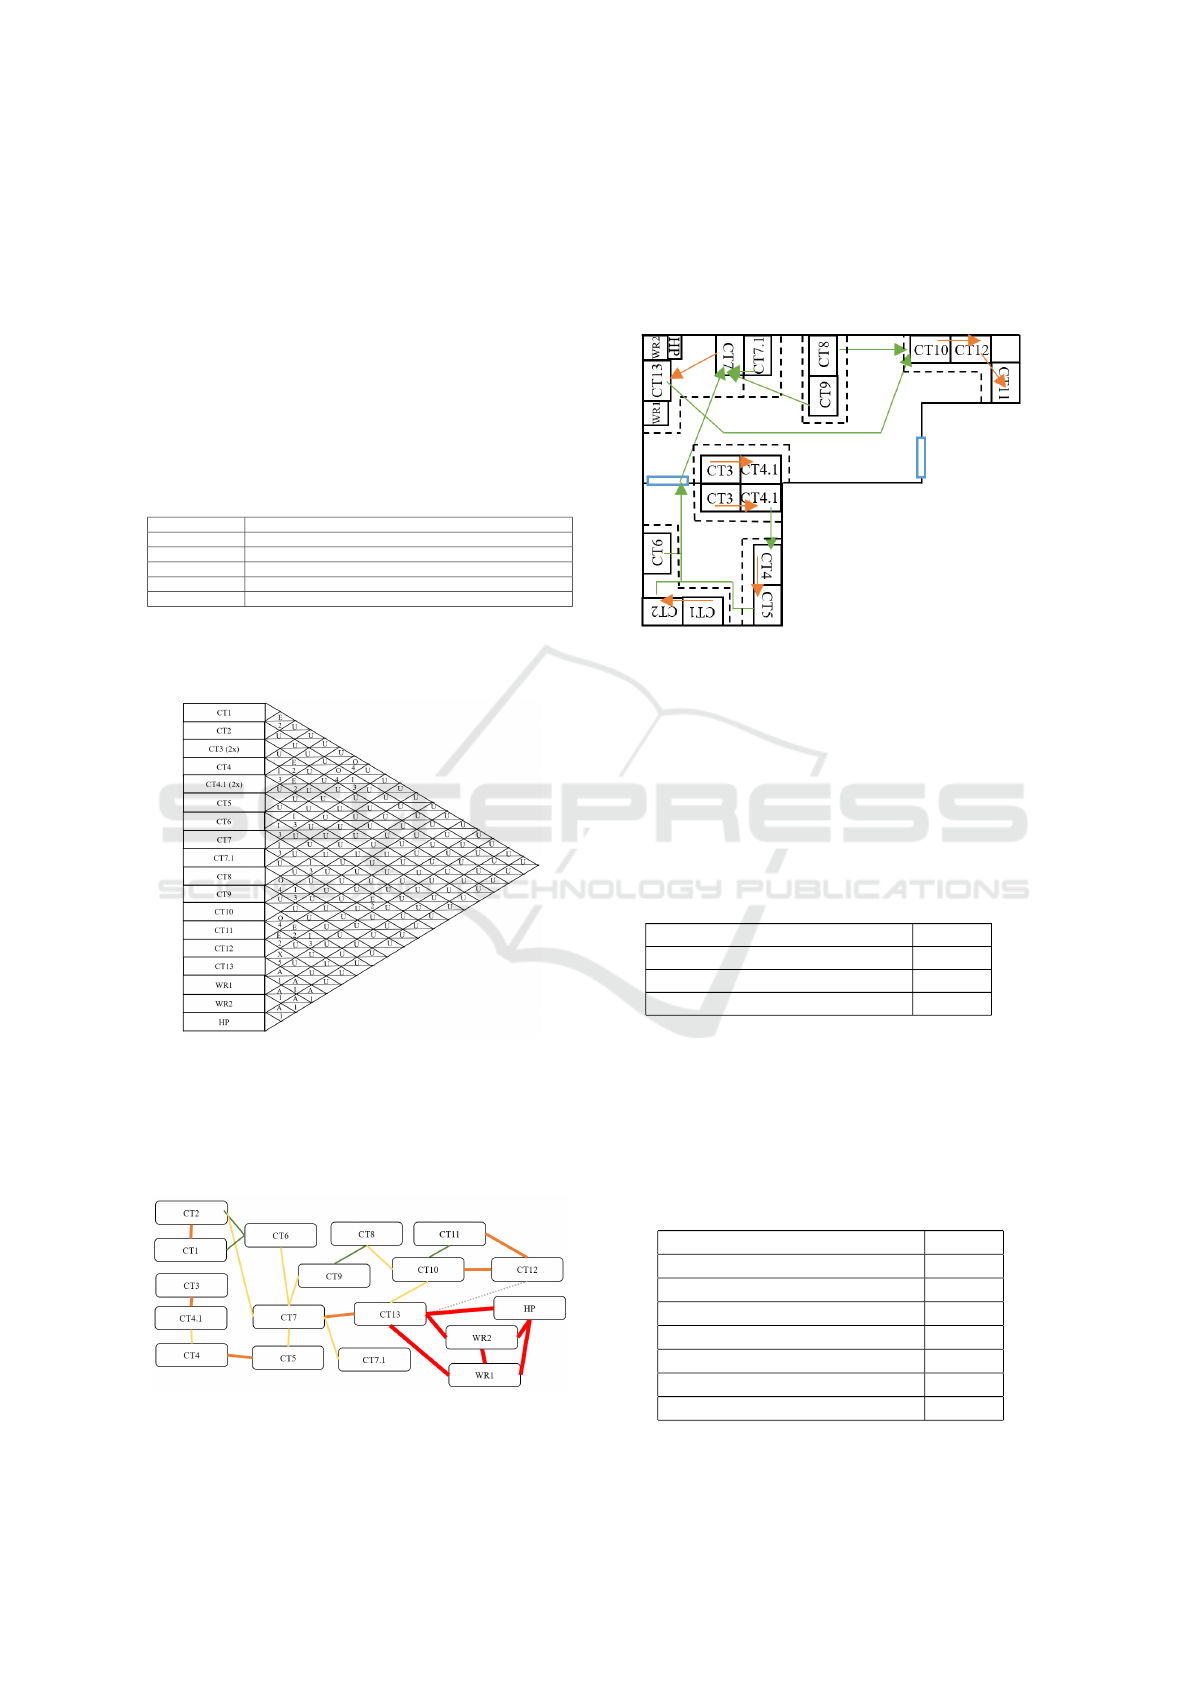
3.2.1 Systematic Layout Planning
As explained in Section 1, after some information
collection, the SLP methodology can be divided into
three major phases. In the first phase, occurs the anal-
ysis of production processes information. The layout
design take place in the second phase, in which the in-
formation related to the needed resources and the pro-
duction workflow are used to elaborate a relationship
chart. In this study, it was also created a code that de-
picts the reason for the respective degree of proximity
(Table 3).
Table 3: Numerical Code used in the ICP relationship chart.
Numerical Code Reason
1 Resources used in the same task
2 Workflow within the same workstation
3 Workflow between workstations
4 Resources from the same workstation
5 Resources that cannot be close to each other for safety reasons
Figure 4 shows the relationship chart obtained for
the ICP production line.
Figure 4: ICP relationship chart.
Through the analysis of this relationship chart, the
relationship diagram was drawn (Figure 5). Consid-
ering this last one, the necessary resources and the
available space, the layout options were elaborated.
Figure 5: ICP relationship diagram.
In the third and last phase, the developed layouts
options were evaluated and the most suitable one was
chosen (Figure 6). The orange line represents the
workflow into the same workstation, and the green
line represents the workflow between workstations.
Figure 6: ICP production line layout resulting from the SLP
approach.
The previously defined KPIs were measured for
the obtained layout, being the results present in Table
4. Analyzing the KPIs, it is noticeable that the work-
ers’ movement time represents a small percentage of
the production lead time, only 1,7%. This means that
the workers’ movement time can be considered in-
significant in the production lead time, being the lay-
out obtained evaluated as efficient.
Table 4: KPIs results from the SLP layout.
KPI SLP
Workers’ moving distance (m) 41,1
Workers’ moving time (s) 88,3
Production lead time (s) 5079,2
3.3 Final Layout
Table 5 summarizes the KPIs obtained for the ICP
production line layout.
Table 5: KPIs summary from the ICP production line lay-
out.
KPI SLP
No. of workstations 8
Line efficiency (%) 79
Balance delay (%) 21
Smoothness index 301,5
Workers’ moving distance (m) 41,1
Workers’ moving time (s) 88,3
Production lead time (s) 5079,2
Designing a New Layout for a Balanced Production Line: A Practical Application
167

Regarding the balancing KPIs, the results are con-
sidered satisfactory. The number of workstations ob-
tained is very close to the theoretical minimum num-
ber of workstations, i.e., 7 workstations. This lower-
bound calculation does not consider any constraint
present in this problem (for example, zone restrictions
and parallel workstations), having this in mind, we
can consider that the number of stations obtained is
quite satisfactory. The high efficiency of the produc-
tion line is reflected into an uniform distribution of the
workload among the workstations. This also means a
decrease in the risk of bottlenecks occurring in pro-
duction. Consequently, and as expected, the balance
delay obtained is low, which implies a low idle time,
caused by some not so good job assignments due to
the problem constraints. The KPIs related to produc-
tion time are also considered satisfactory, since the
percentage of workers’ movement time is insignifi-
cant compared to the production lead time. There-
fore, the layout obtained can be considered efficient
both in terms of resource/space optimization and line
optimization.
4 CONCLUSIONS
A case study of a production line layout design was
presented. The idea was to take advantage of the need
to optimize the efficiency of an existing production
line, by redesigning and studying a new production
line. The methodology implemented was divided into
two major steps: line balancing and layout design.
In the first step, an assembly line balancing prob-
lem was solved, using an integer linear programming
model. Besides this BM, five variants, based on dif-
ferent preference criteria to assign task to worksta-
tions, were created. All the models variants achieved
the optimal solution of 8 workstations, with an effi-
ciency of 79% and balance delay of a 21%. Since
the theoretical value of the number of workstations -
lower bound is 7, and considering the existing con-
straints, it could be stated that the production line has
a relatively good efficiency. Comparing the smooth-
ness index, it was possible to conclude that the best
solution was achieved when considering the BM and
the PC4 variant model.
In the second step, the facility layout problem was
solved by applying the SLP method. The final lay-
out obtained was evaluated using KPIs related to pro-
duction time. When the results were analysed, it was
concluded that the KPI that was thought to be most
important - the workers’ movement time, only repre-
sented a small percentage of the production lead time
(1,7%), which can be considered an insignificant per-
centage.
It is important to note that, with the new layout,
the space is optimized and the production efficiency
increases. However it is advisable that the company
maintains a Lean culture and whenever possible the
layout should be revised. Having this in mind, as fu-
ture work, other layout design methodologies can be
tested to see if further improvements can be made.
REFERENCES
Buchari, Tarigan, U., and Ambarita, M. B. (2018). Produc-
tion layout improvement by using line balancing and
systematic layout planning (slp) at pt. xyz. In Materi-
als Science and Engineering Conference Series.
Fahad, M., Naqvi, S. A. A., Atir, M., Zubair, M., and She-
hzad, M. M. (2017). Energy management in a manu-
facturing industry through layout design. In Procedia
Manufacturing.
Islam, M. M., Mohiuddin, H., H.Mehidi, S., and Sakib, N.
(2014). An optimal layout design in an apparel indus-
try by appropriate line balancing: A case study. In
Global Journal of Researches in Engineering: G In-
dustrial Engineering.
Muther, R. (1973). Systematic Layout Planning. Cahners
Books, 2nd edition.
Naqvi, S. A. A., Fahad, M., Atir, M., Zubair, M., and She-
hzad, M. M. (2016). Productivity improvement of a
manufacturing facility using systematic layout plan-
ning. In Cogent Engineering.
Salveson, M. E. (1955). The assembly line balancing prob-
lem. In Journal of Industrial Engineering.
Scholl, A. and Becker, C. (2006). State-of-the-art exact and
heuristic solution procedures for simple assembly line
balancing. In European Journal of Operational Re-
search.
Syahputri, K., Sari, R. M., Rizkya, A. I., Leviza, J., and
Siregar, I. (2018). Improving assembly line balancing
using moodie young methods on dump truck produc-
tion. In IOP Conference Series: Materials Science
and Engineering.
Tak, C. S. and Yadav, L. (2012). Improvement in layout
design using slp of a small size manufacturing unit: A
case study. In IOSR Journal of Engineering.
Wiyaratn, W., Watanapa, A., and Kajondecha, P. (2013).
Improvement plant layout based on systematic layout
planning. In International Journal of Engineering and
Technology.
Yang, T., Su, C. T., and Hsu, Y. R. (2000). Systematic layout
planning: A study on semiconductor wafer fabrication
facilities. In International Journal of Operations &
Production Management.
Yemane, A., Haque, S., and Malfanti, I. S. (2017). Opti-
mal layout design by line balancing using simulation
modeling. In Proceedings of the International Confer-
ence on Industrial Engineering and Operations Man-
agement.
ICORES 2022 - 11th International Conference on Operations Research and Enterprise Systems
168
