
Unsupervised Activity Recognition using Trajectory Heatmaps from
Inertial Measurement Unit Data
Orhan Konak
a
, Pit Wegner, Justin Albert
b
and Bert Arnrich
c
Digital Health – Connected Healthcare,
Hasso Plattner Institute, University of Potsdam, Potsdam, Germany
Keywords:
Activity Recognition, Unsupervised Learning, Inertial Measurement Units.
Abstract:
The growth of sensors with varying degrees of integration and functionality has inevitably led to their entry
into various fields such as digital health. Here, sensors that can record acceleration and rotation rates, so-
called Inertial Measurement Units (IMU), are primarily used to distinguish between different activities, also
known as Human Activity Recognition (HAR). If the associations of the motion data to the activities are not
known, clustering methods are used. There are many algorithmic approaches to identify similarity structures
in the incoming sensor data. These differ mainly in their notion of similarity and grouping, as well as in
their complexity. This work aimed to investigate the impact of transforming the incoming time-series data
into corresponding motion trajectories and trajectory heatmap images before forwarding it to well-known
clustering models. All three input variables were given to the same clustering algorithms, and the results were
compared using different evaluation metrics. This work shows that transforming sensor data into trajectories
and images leads to a significant increase in cluster assignment for all considered models and different metrics.
1 INTRODUCTION
Human Activity Recognition (HAR), i.e., categoriz-
ing physical movements into different activity classes,
is becoming increasingly popular in healthcare. In
the field of digital health, it holds tremendous poten-
tial, such as in the prevention of diseases, the analysis
of movements over time according to specific disease
progression, the correct execution of activities, and
tasks requiring documentation. The emergence of this
research field is favored using increasingly accurate
and small, and thus portable, Inertial Measurement
Units (IMUs) to measure acceleration and angular
rate over time. Carrying the sensors on specific body
locations leads to certain patterns in the time series,
which can then be differentiated into activity classes.
Furthermore, in contrast to, e.g., video-based activity
recognition, sensor-based classification offers the ad-
vantage of privacy protection. This fact makes sensor-
based activity classification the preferred method, es-
pecially in areas of sensitive data such as healthcare.
Methodologically, sensor-based activity recognition
a
https://orcid.org/0000-0003-1884-8029
b
https://orcid.org/0000-0002-6121-792X
c
https://orcid.org/0000-0001-8380-7667
is closely intertwined with the field of machine learn-
ing.
Machine learning for activity recognition can be
roughly divided into two branches, supervised and un-
supervised learning. While the respective input data
is labeled in supervised learning, it is unavailable in
unsupervised learning. Besides the missing label, the
search for unknown similarity patterns in the data is
also relevant in unsupervised learning. This allows
the data to be divided into clusters of similar patterns.
Research in clustering often plays out at improving
model-based solution approaches given the same in-
put data. The transformation of the input data with
subsequent clustering, on the other hand, is less re-
searched (Ariza Colpas et al., 2020).
Previous work has already shown that transform-
ing the incoming time-series data from IMUs into
a motion trajectory and further 2D heatmap image
can help to improve the classification accuracy for
small datasets in a supervised manner (Konak et al.,
2020). The methodological and data basis for the
data transformation and the comparison of the results
is provided by (Huang et al., 2018). Building upon
these works, the contribution of this work is to com-
pare the effect of transforming the incoming IMU
data into different modalities on the clustering result.
304
Konak, O., Wegner, P., Albert, J. and Arnrich, B.
Unsupervised Activity Recognition Using Trajectory Heatmaps from Inertial Measurement Unit Data.
DOI: 10.5220/0010838800003116
In Proceedings of the 14th International Conference on Agents and Artificial Intelligence (ICAART 2022) - Volume 2, pages 304-312
ISBN: 978-989-758-547-0; ISSN: 2184-433X
Copyright
c
2022 by SCITEPRESS – Science and Technology Publications, Lda. All rights reserved
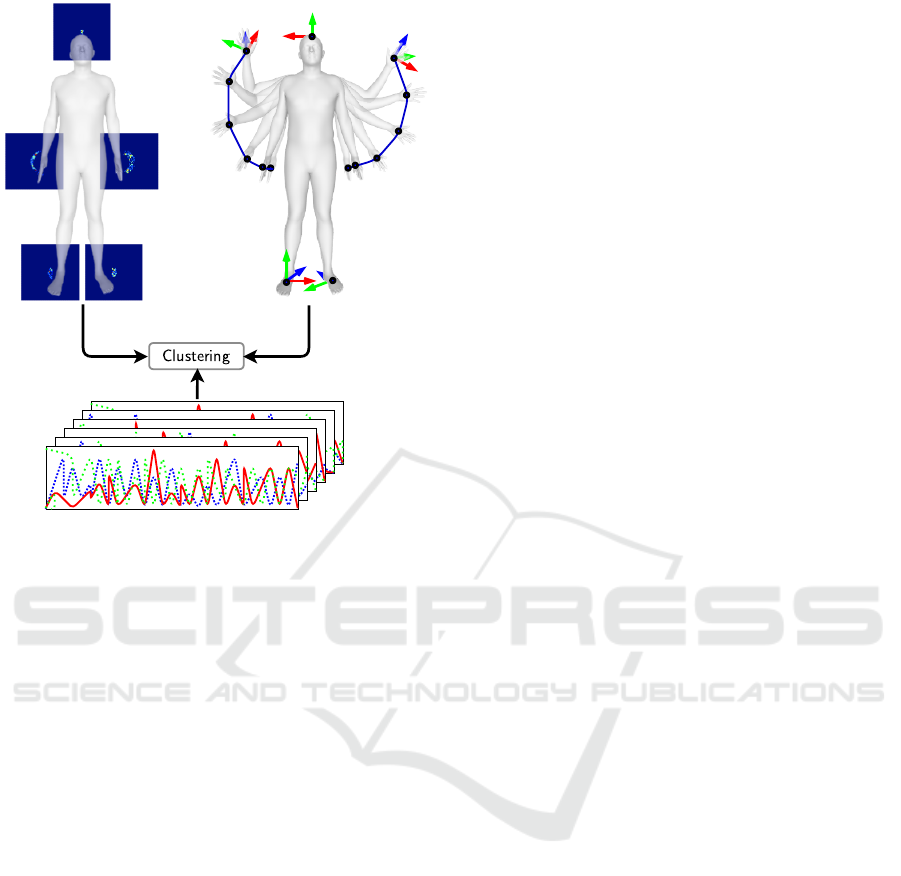
Figure 1: Clustering and evaluation of the three different
input modalities: raw sensor data (bottom), trajectory time
series (upper right), and heatmap images (upper left).
For this purpose, we make use of the Deep Inertial
Poser (DIP-IMU) dataset, the currently largest pub-
licly available IMU dataset (Huang et al., 2018), and
classical clustering algorithms for the three modalities
(1) raw input data from six sensors placed on different
body regions, (2) motion mapping 3D trajectories of
the sensors over time, and (3) 2D heatmaps of the mo-
tion trajectories for the respective sensors, by using
various performance metrics, as shown in Figure 1.
The remainder of this work proceeds as follows:
In section 2, the work is placed in the field of previ-
ous research on the effect of sensor modality transfor-
mation for unsupervised HAR. Section 3 is concerned
with the algorithmic approach to data transformation
and the methodology used for this study. The results
are subject of section 4. The findings are further dis-
cussed in section 5. Finally, the conclusions are part
of section 6.
2 RELATED WORK
Research on HAR based on IMU data with no ground
truth is mainly focused on the comparison of different
clustering techniques (Chen et al., 2021). There are
only a few works that researched the impact of data
transformation on the clustering outcome.
The idea to project human activities into an em-
bedding space in which similar activities are located
more closely was proposed in (Sheng and Huber,
2020). Using subsequent clustering algorithms can
benefit from the embeddings that represent the dis-
tinct activities performed by a person. The eval-
uation was carried out on three labeled benchmark
datasets. With improved performance in grouping
the underlying human activities compared to unsuper-
vised methods applied directly to the original dataset,
they showed the framework’s capability.
(Bai et al., 2019) proposed a deep learning varia-
tional autoencoder activity recognition model for the
representation of the activities in distinct time periods.
By applying the proposed method on a publicly avail-
able dataset, they showed that transforming the IMU
data (raw accelerometer and gyroscope data) to an en-
coded 128-dimensional vector has led to an improve-
ment in grouping the activities. Three traditional clus-
tering methods were used for evaluation.
Similarly, (Abedin et al., 2020) proposed a deep
learning paradigm for unsupervised activity represen-
tations for sensory data with strong semantic corre-
spondence to different human activities. Comparisons
were made with closely related approaches, includ-
ing traditional clustering methods for three diverse
HAR datasets, and the effectiveness of the proposed
approach could be shown. The proposed method is
inspired by techniques, which are more common in
image clustering (Xie et al., 2016; Min et al., 2018;
Li et al., 2018).
Although these methods achieve good results,
they share the common idea of a lower-dimensional
representation of the data. The architecture aims to
reproduce the input through a bottleneck of the tar-
get dimensionality, letting the network decide how
best to compress the given information into a latent
space (Wang et al., 2015). The method is often used
for image feature extraction because convolutional
layers are particularly powerful in detecting signifi-
cant structures (Bishop, 2007). In contrast, and to the
best of our knowledge, this is the first work examin-
ing the impact of data transformation from IMUs into
interpretable motion trajectories and 2D heatmap im-
ages before feeding it to the clustering algorithm.
3 METHODS
For this work, the clustering evaluation has been per-
formed for three kinds of input data: raw sensor data,
trajectory time series, and trajectory images. Also,
for each type of data, Principal Component Analy-
sis (PCA) was applied to observe the effect of dimen-
Unsupervised Activity Recognition Using Trajectory Heatmaps from Inertial Measurement Unit Data
305
Figure 2: Overview: Top: Implementation pipeline of modality transformation from IMU data for given time windows into 3D
trajectories and further 2D heatmap images via deep inertial poser. Bottom: Clustering for the three different input modalities
raw sensor data, trajectory time series, and trajectory images.
sionality reduction on the clustering results (Pearson,
1901). As depicted in Figure 2 the whole pipeline
starts with raw IMU readings. For short time win-
dows, the data is transformed into motion trajectories,
which are an exact reproduction of the sequence of the
movements with the help of a Skinned Multi-Person
Linear Model (SMPL), a realistic 3D model of the hu-
man body based on skinning and blend shapes (Loper
et al., 2015). The last step consists of reducing the di-
mensionality of the trajectory and highlighting more
frequently passed pixels in a heatmap (trajectory im-
age). All three modalities are passed to the cluster-
ing algorithms k-means and Density-Based Spatial
Clustering of Applications with Noise (DBSCAN)
for comparison with different distance and evaluation
metrics (Lloyd, 2019; Ester et al., 1996). In the fol-
lowing, the methodological approach is described in
more depth.
3.1 Dataset
In order to evaluate the impact of the proposed ap-
proach, the largest publicly available dataset DIP-
IMU was used (Huang et al., 2018). The dataset con-
sists of 17 IMU readings, containing approximately
90 minutes of real IMU data in conjunction with
ground-truth poses for ten subjects in 64 sequences
with 330,000 time instants and 13 different activities.
The performed activities are listed in Table 1.
3.2 Data Transformation
Transforming IMU readings into corresponding mo-
tion trajectories is challenging as it requires an algo-
rithmic detour because of the given error drift coming
along with sensors (Konak et al., 2020). Therefore,
we use SMPL, a skinned vertex-based model that rep-
resents a wide variety of body shapes. (Huang et al.,
2018) have shown that a Bidirectional Recurrent Neu-
ral Networks (BiRNN) with Long Short-Term Mem-
ory (LSTM) cells can map the IMU readings con-
sisting of acceleration and orientation onto the SMPL
pose parameters.
The SMPL model is composed of r = 6890 ver-
tices in three dimensions, which leads to a vector rep-
resentation of dimension R
3r
. For activity recogni-
tion, the recorded time range denoted as S, is divided
into smaller time windows S
i
. In each time window i,
ICAART 2022 - 14th International Conference on Agents and Artificial Intelligence
306

Input : S = {S
1
, . . . , S
m
} - List of m equally sized time windows where each time window consists
of k time series of measurement values S
i
= {S
i,1
, . . . , S
i,k
};
A ∈ N
m×l
- List of activity labels {a
1
, . . . , a
l
} for each time window;
vertices = 1, . . . , r - List of vertices to track, e.g., wrist, ankle;
d ∈ N - Dimension for heatmap;
n ∈ N - Time frames in each time window
Output : Cluster for different input signals
Procedure:
Initialize SMPL ∈ R
r×n×3
, T ∈ R
vertices×n×3
, T
0
∈ R
vertices×n×2
, H ∈ R
m×vertices×d×d
for i ← 1 to m do
SMPL ← PoseEstimation(S
i
);
T ← SMPL
r=vertices
;
T
0
← PCA(T, n components = 2);
H
i
← Heatmap(T
0
);
end
return Cluster({S
i
, T
0
, H, PCA(S
i
, n components = 2), PCA(T
0
, n components =
2), PCA(H, n components = 2)})
Algorithm 1: Clustering on the DIP-IMU dataset for different input modalities.
Table 1: Description of activities performed.
Category
# Frames Minutes
Motion
Upper Body 116,817 32.45
Arm Chest Crossings
Arm Circles
Arm Head Crossings
Arm Raises
Arm Stretches Up
Lower Body 70,743 19.65
Leg Raises
Squats
Lunges
Locomotion 73,935 20.54
Walking
Sidesteps
Crosssteps
Freestyle 18,587 5.16
Jumping Jacks
Sumos
a pose estimation is predicted for n time frames by the
BiRNN for the incoming acceleration and orientation
data a
a
a, ω
ω
ω:
f : IMU(a
a
a, ω
ω
ω) → SMPL
After reconstructing 3D human body poses from
IMU readings in each time frame, the position of an
arbitrary point over time can be tracked, hence allow-
ing to reconstruct the motion trajectory T .
Further, PCA is applied on the resulting trajec-
tory for dimensionality reduction from R
3
→ R
2
. To
preserve temporal relation, a heatmap H ∈ R
d×d
of
height and width d is generated. The sum h
i j
=
∑
i, j
PCA determines each pixel’s color of the trajec-
tories projection into the lower 2-dimensional space
boundaries of the pixel. With each modality’s first
two principal components - trajectory heatmap im-
ages, trajectory time series, and IMU readings - the
data was passed to different clustering algorithms for
further processing.
3.3 Clustering
As described in algorithm 1, the whole pipeline from
data acquisition to clustering consists of different al-
gorithmic layers in a prescribed order. To examine the
effect of data transformation, we used three different
clustering techniques for all three modalities and dif-
ferent evaluation metrics. As a well-known clustering
algorithm, k-means clustering was applied to deter-
mine the activities classification for the given number
of clusters, and the distance measures euclidean dis-
tance and Dynamic Time Warping (DTW) (M
¨
uller,
2007). DTW aims to find a non-linear mapping be-
tween two time-series of different lengths.
Contrary to k-means clustering, DBSCAN was
used as a second algorithm, which does not require
a predetermined number of clusters as parameter in-
put. Instead, it relies on connectivity between points
in a particular range. Hence, more densely con-
nected areas are grouped in one cluster, while out-
liers are detected as noise. The algorithm thus re-
quires two parameters, a threshold range for the ex-
amined neighborhood of a selected sample (ε) and
a measure for density, i.e., the number of points in
that range (ρ) (Ester et al., 1996). Like other clus-
tering algorithms, the distance measure can be cho-
sen arbitrarily, applying it to various input types, such
Unsupervised Activity Recognition Using Trajectory Heatmaps from Inertial Measurement Unit Data
307

as n-dimensional data points, time series, or images.
We used accuracy, Adjusted Rand Index (ARI), and
Adjusted Mutual Information (AMI) for the evalua-
tion. Since DIP-IMU also incorporates the ground
truth data, the accuracy can be determined by calcu-
lating the proportion of correct predictions among the
total number of the examined cases. Furthermore, we
used AMI and ARI as a metric (Vinh et al., 2009).
AMI is defined as:
AMI(U, V ) =
MI(U, V ) − E{MI(U, V )}
max{H(U), H(V )} − E{MI(U, V )}
where MI denotes the mutual information be-
tween two partitions, E{MI(U, V )} the expected mu-
tual information between two random clusterings, and
H(U), H(V ) the entropies associated with the parti-
tionings U, V . Using the permutation model, the ARI
Index is calculated as follows:
ARI =
∑
i j
n
i j
2
−
h
∑
i
a
i
2
∑
j
b
j
2
i.
n
2
1
2
h
∑
i
a
i
2
+
∑
j
b
j
2
i
−
h
∑
i
a
i
2
∑
j
b
j
2
i.
n
2
where n
i j
, a
i
, b
j
are values from the contingency
table, a table where the overlap between two group-
ings can be summarized.
Finally, we made use of a clustering technique
that relies on neural networks. Most neural network
architectures require manually labeled data, limiting
their use in unsupervised scenarios. However, con-
volutional layers pose a robust tool for pattern recog-
nition and feature extraction in image segmentation
and classification. Invariant Information Clustering
(IIC) makes these applicable to the unsupervised do-
main by generating artificially transformed images of
the training data as paired samples for similar infor-
mation in the image (Ji et al., 2019). Via convolu-
tional representation learning, the mutual information
is extracted to a latent space representing the cluster
probability distribution. With each epoch, the repre-
sentation is refined, and the optimal cluster mapping
is extracted.
4 EVALUATION
Unsupervised activity clustering enormously bene-
fits from the image representation to measure intra-
cluster similarity. Using trajectory images for unsu-
pervised classification significantly improves classifi-
cation accuracy over raw sensor data for the k-means
and DBSCAN algorithms.
Table 2: Clustering results for k-means performed on the
DIP-IMU dataset for different input modalities and distance
metrics.
Input modality Quality metric
Distance metric AMI ARI Acc
Raw sensor data
Euclidean 0.135 0.045 0.220
DTW 0.239 0.033 0.280
Raw sensor data (2D)
Euclidean 0.099 0.011 0.194
Trajectory time series
Euclidean 0.375 0.167 0.314
DTW 0.462 0.298 0.408
Trajectory time series (2D)
Euclidean 0.322 0.177 0.328
Trajectory image
Euclidean 0.462 0.264 0.366
Trajectory image (2D)
Euclidean 0.396 0.230 0.377
To evaluate this unsupervised approach to the
HAR problem, three different models, k-means, ARI-
optimized DBSCAN, and AMI-optimized DBSCAN
were trained on DIP-IMU in six different formats us-
ing all applicable distance metrics. The formats in-
clude the raw sensor data, the generated trajectory
time series, trajectory heatmap images, and the first
two principal components for each. The input di-
mensions for the clustering algorithms are as follow:
raw sensor inputs from six IMUs for acceleration and
rotation in three dimensions and for a time window
of 5s with 60 Hz leads to input size of 6 × 6 × 300;
trajectory time series with the positional coordinate
for all six sensors in each time frame produces the
dimension 6 × 3 × 300; the trajectory image of size
6 × 64 × 64 for all six sensors. Additionally, for com-
parison purposes, the metrics of a random classifier
and the accuracy of an IIC network trained on the tra-
jectory images were recorded.
As can be seen in Table 2, the DTW distance met-
ric produces the best clustering results for time se-
ries data, compared to euclidean distance. This holds
for both k-means and DBSCAN clustering. Also,
both clustering algorithms profit from the representa-
tion as trajectories, improving all three observed met-
rics. The transformation to trajectory images leads
to slightly worse k-means results than the trajectory
time series but still outperforms the clustering on raw
sensor data. PCA, for dimensionality reduction, does
not provide additional value, as almost all measured
evaluation metrics are lower than their original coun-
terpart.
The DBSCAN algorithms optimized by either
ARI or AMI show similar results regarding the dif-
ICAART 2022 - 14th International Conference on Agents and Artificial Intelligence
308

Table 3: Clustering results for AMI-optimized DBSCAN on the DIP-IMU dataset for different input modalities and distance
metrics.
Input modality Quality metric # of Parameters
Distance metric AMI ARI Acc clusters ε ρ
Raw sensor data
Euclidean 0.143 0.066 0.256 13 9.0 2
DTW 0.247 0.077 0.188 13 4.0 2
Raw sensor data (2D)
Euclidean 0.122 0.033 0.206 9 1.4 4
Trajectory time series
Euclidean 0.278 0.104 0.221 13 1.0 2
DTW 0.352 0.129 0.320 13 0.6 8
Trajectory time series (2D)
Euclidean 0.323 0.180 0.292 14 0.4 5
Trajectory image
Euclidean 0.171 0.053 0.243 13 1.6 4
Trajectory image (2D)
Euclidean 0.363 0.243 0.360 12 0.2 7
Table 4: Clustering results for ARI-optimized DBSCAN on the DIP-IMU dataset for different input modalities and distance
metrics.
Input modality Quality metric # of Parameters
Distance metric AMI ARI Acc clusters ε ρ
Raw sensor data
Euclidean 0.077 0.087 0.138 13 8.0 1
DTW 0.186 0.160 0.057 13 4.0 1
Raw sensor data (2D)
Euclidean 0.095 0.058 0.148 28 0.6 3
Trajectory time series
Euclidean 0.246 0.175 0.168 13 1.0 1
DTW 0.322 0.223 0.176 13 0.4 1
Trajectory time series (2D)
Euclidean 0.283 0.215 0.152 248 0.2 1
Trajectory image
Euclidean 0.086 0.105 0.188 13 1.2 1
Trajectory image (2D)
Euclidean 0.362 0.253 0.366 13 0.2 6
ferences in input modality and distance metric. Each
step in the transformation (sensor data → trajec-
tory time series → trajectory images) leads to im-
proved clustering results across all distance and qual-
ity metrics, as can be seen from the data in Ta-
ble 3 and Table 4. In particular, the clustering of the
dimensionality-reduced trajectory images performed
best, in contrast to the poor results achieved on the
full images. In general, it can be noted that the num-
ber of DBSCAN-found clusters often closely matched
the number of ground truth classes. Comparing the
results of the two different optimizations, the AMI-
maximization leads to higher accuracy and more sta-
ble cluster numbers.
The differences between all three clustering re-
sults on the two principal components of the image
dataset and a complete overview of 2D clustering re-
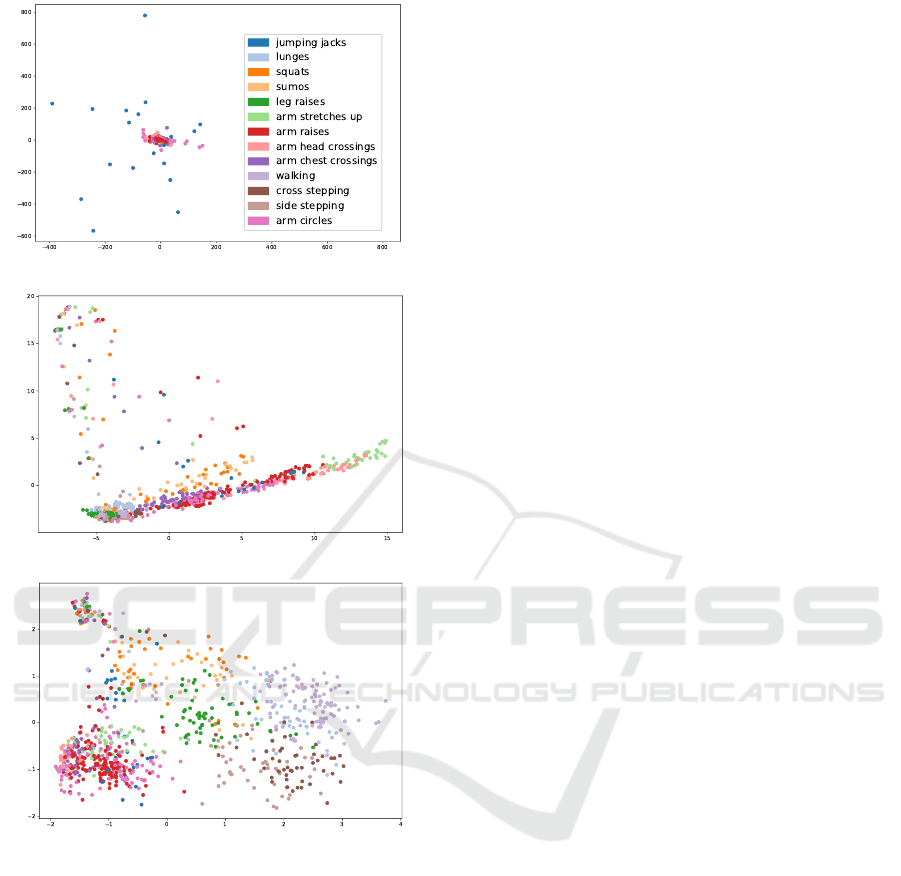
sults are shown in Figure 3. It is noticeable that the
distribution of the first two principal components of
the different activities are widely spread and grouped
in clusters for the trajectory images. The data from
different activities are cluttered for the first two prin-
cipal components of the raw sensor data.
A classifier choosing randomly from the given
number of classes achieved an accuracy of 12.8% and
AMI and ARI scores very close to zero. An IIC net-
work trained on the trajectory images achieved an ac-
curacy of 35.8%.
Unsupervised Activity Recognition Using Trajectory Heatmaps from Inertial Measurement Unit Data
309
(a) Raw sensor data
(b) 3D trajectories
(c) Trajectory images
Figure 3: Plot of the top two principle components of the
different data inputs. The ground truth classes are repre-
sented by distinct colors. Each type of data leads to a dif-
ferent spread.
5 DISCUSSION
In this work, an unsupervised learning approach for
HAR based on sensor data was presented. The higher
performance of the DTW distance metric over eu-
clidean distance is expected for time series data, as
similar activities are performed at different speeds by
different subjects, which DTW can compensate for by
mapping similar sections.
The significant difference between the results of
clustering the full trajectory images and their two
principal components is most likely due to the im-
proved sample distribution, as shown in Figure 3.
Looking at the labels, the principle components can
separate the arm from leg activities and overlapping
patches of activities within these areas. The fail-
ure cases of the clustering algorithms are mainly due
to this cluster overlap, which conventional clustering
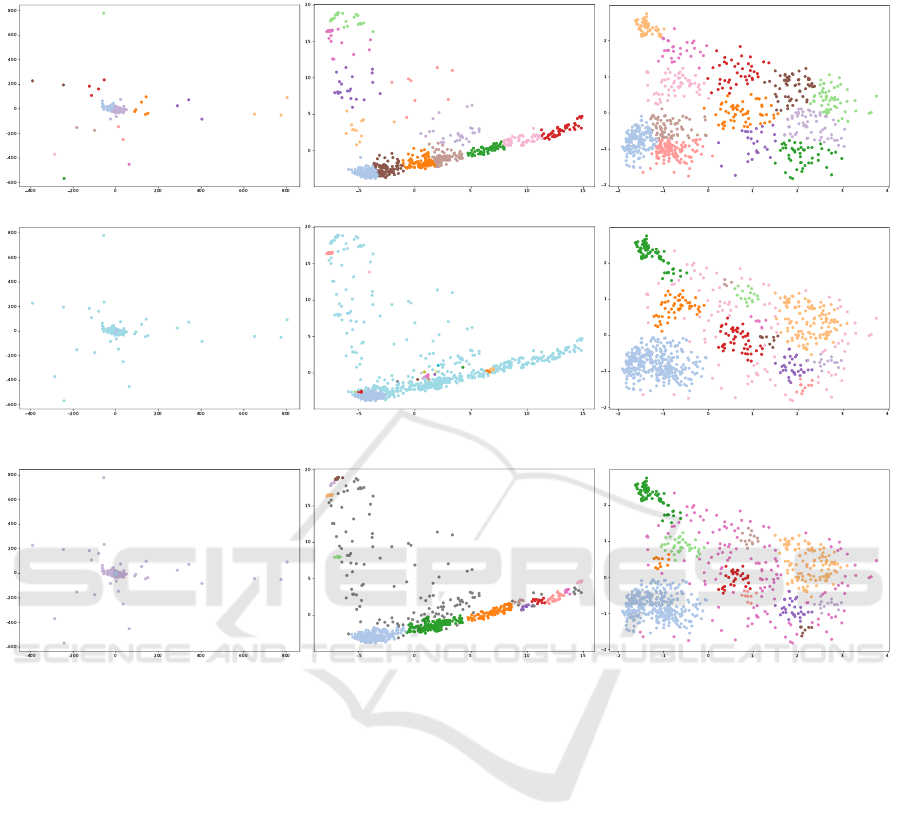
methods cannot detect. As visible in Figure 4, this
problem increases in severity for trajectories and even
more for raw sensor data.
The increased performance of trajectories over
raw sensor data can most likely be attributed to the
fact that the fixed-size 3D body model in some way
standardizes the paths. Thus, similar motions create
trajectories in similar regions, regardless of the sub-
ject’s size or physique. It also appears that the missing
temporal information in the trajectory images is not
critical for unsupervised classification performance,
leading to the conclusion that the computationally ex-
pensive DTW distance metric on time series could be
replaced with euclidean distance of trajectory images
for some use cases.
Comparing the k-means and DBSCAN models, it
is interesting to note that they perform very differ-
ently on the trajectory image representation but not on
their two principal components. Although DBSCAN
finds a similar number of clusters as the ground truth
classes, they do not necessarily represent each other.
Also, they do not correspond to the clusters found by
k-means, which is why the number of clusters can be
outruled as a reason for this finding. The reason might
be that k-means clustering creates more evenly shaped
clusters on an almost evenly spaced dataset, whereas
DBSCAN would group areas of similar density. In the
case of trajectory images, euclidean distance is calcu-
lated in 64 × 64 = 4096 dimensions, whereas trajec-
tories pose 12 and raw sensor data 60 dimensions. In
high dimensions, the ratio between the nearest and
farthest points approaches 1, i.e., the points essen-
tially become uniformly distant from each other (Ag-
garwal et al., 2001), making clustering much more
difficult for DBSCAN.
The accuracy of the IIC model is similar to the
best results of both DBSCAN and k-means on the
trajectory images. This implies that the features
extracted by the convolutional layers do not pro-
vide much additional information for better cluster-
ing. Comparing the accuracy rates across all mod-
els and input modalities, ARI-maximizing DBSCAN
performs by far the worst, often only slightly outper-
forming a random classifier.
ICAART 2022 - 14th International Conference on Agents and Artificial Intelligence
310

6 CONCLUSION AND FUTURE
WORK
The effect of using trajectories over raw sensor data
in unsupervised classification for HAR is striking.
Clustering algorithms using either trajectory time se-
ries or trajectory images outperform the sensor-based
variants. The potential power of unsupervised clas-
sification in activity recognition for videos was al-
ready indicated by (Niebles et al., 2008). The ap-
proaches used in such methods could be powerful
tools for trajectory image clustering and should be
explored further. Slightly different sensor setups or
using sensors from a different manufacturer can be
achieved through transfer learning from the origi-
nal synthetic Archive of Motion Capture as Surface
Shapes (AMASS) dataset(Mahmood et al., 2019).
Furthermore, euclidean distance in high-dimensional
space should be mitigated, for example, by using L
norms (Aggarwal et al., 2001).
REFERENCES
Abedin, A., Motlagh, F., Shi, Q., Rezatofighi, H., and
Ranasinghe, D. (2020). Towards Deep Clustering of
Human Activities from Wearables. In Proceedings of
the 2020 International Symposium on Wearable Com-
puters, ISWC ’20, page 1–6, New York, NY, USA.
Association for Computing Machinery.
Aggarwal, C. C., Hinneburg, A., and Keim, D. A. (2001).
On the Surprising Behavior of Distance Metrics in
High Dimensional Space. In Van den Bussche, J. and
Vianu, V., editors, Database Theory — ICDT 2001,
pages 420–434, Berlin, Heidelberg. Springer Berlin
Heidelberg.
Ariza Colpas, P., Vicario, E., De-La-Hoz-Franco, E.,
Pineres-Melo, M., Oviedo-Carrascal, A., and Patara,
F. (2020). Unsupervised Human Activity Recognition
Using the Clustering Approach: A Review. Sensors,
20(9).
Bai, L., Yeung, C., Efstratiou, C., and Chikomo, M. (2019).
Motion2Vector: Unsupervised Learning in Human
Activity Recognition Using Wrist-Sensing Data. In
Adjunct Proceedings of the 2019 ACM International
Joint Conference on Pervasive and Ubiquitous Com-
puting and Proceedings of the 2019 ACM Inter-
national Symposium on Wearable Computers, Ubi-
Comp/ISWC ’19 Adjunct, page 537–542, New York,
NY, USA. Association for Computing Machinery.
Bishop, C. M. (2007). Pattern Recognition and Ma-
chine Learning (Information Science and Statistics).
Springer, 1 edition.
Chen, K., Zhang, D., Yao, L., Guo, B., Yu, Z., and Liu,
Y. (2021). Deep Learning for Sensor-Based Human
Activity Recognition: Overview, Challenges, and Op-
portunities. ACM Comput. Surv., 54(4).
Ester, M., Kriegel, H.-P., Sander, J., and Xu, X. (1996). A
Density-Based Algorithm for Discovering Clusters in
Large Spatial Databases with Noise. In Proceedings
of the Second International Conference on Knowledge
Discovery and Data Mining, KDD’96, pages 226–
231. AAAI Press.
Huang, Y., Kaufmann, M., et al. (2018). Deep Iner-
tial Poser: Learning to Reconstruct Human Pose
from Sparse Inertial Measurements in Real Time.
ACM Transactions on Graphics, (Proc. SIGGRAPH
Asia), 37:185:1–185:15. Two first authors contributed
equally.
Ji, X., Henriques, J. F., and Vedaldi, A. (2019). Invariant
Information Clustering for Unsupervised Image Clas-
sification and Segmentation. In Proceedings of the
IEEE International Conference on Computer Vision
(ICCV), pages 9865–9874.
Konak, O., Wegner, P., and Arnrich, B. (2020). IMU-Based
Movement Trajectory Heatmaps for Human Activity
Recognition. Sensors, 20(24).
Li, F., Qiao, H., and Zhang, B. (2018). Discriminatively
Boosted Image Clustering with Fully Convolutional
Auto-Encoders. Pattern Recognition, 83:161–173.
Lloyd, S. (2019). Least Square Quantization in PCM. In
Proceedings of the IEEE Transactions on Information
Theory, volume 28, pages 129–137.
Loper, M., Mahmood, N., Romero, J., Pons-Moll, G., and
Black, M. J. (2015). SMPL: A Skinned Multi-Person
Linear Model. ACM Trans. Graphics (Proc. SIG-
GRAPH Asia), 34(6):248:1–248:16.
Mahmood, N., Ghorbani, N., Troje, N. F., Pons-Moll, G.,
and Black, M. J. (2019). AMASS: Archive of Motion
Capture as Surface Shapes. In International Confer-
ence on Computer Vision, pages 5442–5451.
Min, E., Guo, X., Liu, Q., Zhang, G., Cui, J., and Long, J.
(2018). A Survey of Clustering With Deep Learning:
From the Perspective of Network Architecture. IEEE
Access, 6:39501–39514.
M
¨
uller, M. (2007). Dynamic Time Warping. Information
Retrieval for Music and Motion, 2:69–84.
Niebles, J., Wang, H., and Fei-Fei, L. (2008). Unsupervised
Learning of Human Action Categories Using Spatial-
Temporal Words. International Journal for Computer
Vision, 3(79):299–318.
Pearson, K. (1901). On Lines and Planes of Closest Fit to
Systems of Points in Space. Philosophical Magazine,
2:559–572.
Sheng, T. and Huber, M. (2020). Unsupervised Embed-
ding Learning for Human Activity Recognition Using
Wearable Sensor Data.
Vinh, N. X., Epps, J., and Bailey, J. (2009). Information
Theoretic Measures for Clusterings Comparison: Is
a Correction for Chance Necessary? In Proceed-
ings of the 26th Annual International Conference on
Machine Learning, ICML ’09, page 1073–1080, New
York, NY, USA. Association for Computing Machin-
ery.
Wang, Y., Yao, H., and Zhao, S. (2015). Auto-Encoder
Based Dimensionality Reduction. Neurocomputing,
184.
Unsupervised Activity Recognition Using Trajectory Heatmaps from Inertial Measurement Unit Data
311
APPENDIX
(a) k-means on raw sensor data (b) k-means on trajectory time series (c) k-means on trajectory images
(d) ARI-optimized DBSCAN on raw sen-
sor data
(e) ARI-optimized DBSCAN on trajec-
tory time series
(f) ARI-optimized DBSCAN on trajec-
tory images
(g) AMI-optimized DBSCAN on raw sen-
sor data
(h) AMI-optimized DBSCAN on trajec-
tory time series
(i) AMI-optimized DBSCAN on trajec-
tory images
Figure 4: Clustering results on the top two principle components across all tested datasets and clustering algorithms.
ICAART 2022 - 14th International Conference on Agents and Artificial Intelligence
312
