
Experimental Comparison of Two Goal-oriented Analysis Techniques
Carlos Cano-Genoves
a
, Silvia Abrahão
b
and Emilio Insfran
c
Department of Computer Science, Universitat Politècnica de València, Camino de vera, s/n 46022, Valencia, Spain
Keywords: Goal-models, Goal-oriented Analysis Techniques, Controlled Experiment.
Abstract: Background: Goal-oriented analysis techniques help reason and make decisions about goal models. These
models may represent the stakeholders’ intentions with respect to the software system to be developed. In a
previous work, we proposed VeGAn, a goal-oriented analysis technique that follows a value-driven approach
in order to support decision-making. Aims: This paper compares the VeGAn technique with the GRL-Quant
technique, with respect to the accuracy of goal model element prioritization, the participants’ prioritization
time, and their perceptions of the quality of the analysis results (perceived satisfaction). Method: A controlled
experiment was carried out with 64 Computer Science undergraduate students who analyzed a goal model
using each of the techniques compared. Results: The results of the experiment show that there are no
significant differences between prioritization time. However, the perceived satisfaction was superior for
VeGAn, although the prioritization accuracy of GRL-Quant was better for one particular system. Conclusions:
While further research is required in order to strengthen these results, the experiment provides preliminary
results on the usefulness of both goal-oriented analysis techniques. Several insights have emerged from this
study, and also opportunities to improve both techniques.
1 INTRODUCTION
Goal models are often used in the early elicitation of
requirements, since they make it possible to represent
stakeholders’ motivations regarding the system to be
developed. Goal-oriented analysis techniques are
used to analyze goal models, and analyses of this
nature can help analysts to make decisions by
providing an assessment of the satisfaction of goals,
evaluating alternatives or identifying conflicts.
Several goal-oriented analysis techniques have
been proposed over the last 25 years. These
techniques employ different approaches for goal-
model analysis, including systematic propagation,
simulation, planning, or techniques based on
multiple-criteria decision-making. However, these
techniques assume a value-neutral approach in which
all goals are equally important. Moreover, little
attention has been paid to the empirical evaluation of
this kind of techniques.
In a previous work (Cano-Genoves et al. 2019),
we introduced VeGAn formerly known as GATHA
a
https://orcid.org/0000-0001-5201-9449
b
https://orcid.org/0000-0003-3580-2014
c
https://orcid.org/0000-0003-0855-5564
as a goal-oriented analysis technique that follows the
principles of Value-Based Software Engineering.
This technique allows the different intentional
elements of a goal model to be prioritized according
to the value that they provide to the system’s
stakeholders (Boehm 2006). The main contribution of
this technique is the performance of the prioritization
of intentional elements througth fuzzy logic. In this
way, we combine both quantitative and qualitative
values when initially assigning the relative
importance to intentional elements rather than
choosing between them, which is the common
practice of existing analysis techniques. The use of
fuzzy logic solves the existing difficulty of assigning
specific values (e.g. 37, 38, 39) to determine the
importance of intentional elements (quantitative
approaches), and avoids the problem of losing
precision when assigning values from a small set of
alternatives (e.g. low, medium, high) (qualitative
approaches).
In this paper we, therefore, present a controlled
experiment whose objective is to compare VeGAn
with GRL-Quant (Amyot et al. 2010), a goal-oriented
242
Cano-Genoves, C., Abrahão, S. and Insfran, E.
Experimental Comparison of Two Goal-oriented Analysis Techniques.
DOI: 10.5220/0010847000003119
In Proceedings of the 10th International Conference on Model-Driven Engineering and Software Development (MODELSWARD 2022), pages 242-251
ISBN: 978-989-758-550-0; ISSN: 2184-4348
Copyright
c
2022 by SCITEPRESS – Science and Technology Publications, Lda. All rights reserved

analysis technique that allows a quantitative
evaluation of the satisfaction of actors and intentional
elements of a goal model. The reason for selecting
this analysis technique is that both the authors and the
technique are well known and relevant within the
goal-oriented analysis community, GRL-Quant and
VeGAn use the same goal modeling language and this
technique appears partially proposed in the GRL
language standard. The two techniques are compared
with respect to the prioritization accuracy,
prioritization time and perceived satisfaction using
both techniques. This is the first experiment to
compare the use of a fuzzy logic-based goal-oriented
analysis technique with a quantitative technique as
regards the prioritization of intentional elements.
Among the motivations for conducting this
experiment is that there are very few studies
comparing goal-orianted analysis techniques. Of
those that do, two studies (Horkoff and Yu 2011),
(Horkoff and Yu 2013) should be highlighted. In the
first study, a classification of 25 analysis techniques
based on their characteristics was carried out without
considering their usefulness or which is better. In the
second one, a comparison of seven techniques was
performed under the premise that the techniques
should be reliable if the results obtained for all of
them are similar. The main difference between this
comparison and ours is that we are interested in not
only the precision of the results but also the
participants’ perceptions of the results of the analysis
performed.
With regard to empirical studies performed in the
goal-oriented analysis area, most of them analyze a
single goal-oriented analysis technique. For example,
(Ernst, Mylopoulos, and Wang 2009) performed an
experiment in order to evaluate the scalability of a
proposed technique. (Liaskos, Jalman, and Aranda
2012) performed an experiment in order to evaluate
whether the Analytic Hierarchy Process (AHP)
approach can be used to quantitatively assess
contribution relationships in goal models. (Horkoff
and Yu 2010) performed an experiment in order to
compare the manual analysis of a goal model with an
automated analysis through the use of an interactive
evaluation procedure that they proposed.
This paper is structured as follows. Section 2
provides the background to the goal-oriented analysis
techniques compared in this work, while Section 3
introduces the design and execution of the experiment
carried out to compare GRL-Quant and VeGAn,
whose results are subsequently presented in Section
4. Section 5 discusses the threats to validity. Finally,
Section 6 presents our conclusions and future work.
2 GOAL-ORIENTED ANALYSIS
TECHNIQUES COMPARED
The GRL-Quant (Amyot et al. 2010) approach is a
goal-oriented analysis technique that uses a
quantitative forward propagation to assess whether
the intentional elements of a goal model can be
satisfied. This technique has two activities.
The first activity (optional) is to prioritize the
intentional elements of a goal model, for this each
stakeholder assigns an importance of between 0 and
100 to each of his/her intentional elements. In the
event that no importance is assigned, the element is
considered to have an importance of 0 and therefore
it is not considered to calculate the actor's satisfaction.
The second activity is to select a set of intentional
elements from which to propagate, and then
automatically propagate through the relationships so
as to discover which intentional elements would be
satisfied. The satisfaction is a number between 100
(totally satisfied) and -100 (fully denied satisfaction).
The propagation rules used by the GRL-Quant
technique for each for the relationships are:
AND decomposition links: The satisfaction of
the decomposed intentional element is equal to
the minimum satisfaction of the elements that
compose it.
OR decomposition links: The satisfaction of the
intentional element decomposed is equal to the
maximum satisfaction of the intentional element
into which it is decomposed.
XOR decomposition links: It propagates the
elements as an OR decomposition, but only an
intentional element of the decomposition can be
initialized at the time of propagation.
Contribution links: The satisfaction of the
intentional element contributed is the
satisfaction of the intentional element that
contributes, multiplied by the weight of the
contribution divided by 100.
Dependency links: The satisfaction of the
intentional element depender is equal to the
minimum satisfaction of the depender and the
dependee.
We have made the following two minor
modifications to the GRL-Quant technique for the
purpose of comparing it with the VeGAn technique.
First, we have automated the propagation, such that
the result obtained is the propagation of each
individual intentional element (with the exception of
decompositions, in which the satisfaction score is
obtained from its children). The reason we have
automated the procedure is because it has scalability
Experimental Comparison of Two Goal-oriented Analysis Techniques
243

issues when working with large models, however we
continue to provide feedback on how satisfaction has
been calculated. Second, we have added a third
activity (evaluation) for the purpose of comparison.
The evaluation consists of the stakeholder assigning
a degree of agreement with the satisfaction score
obtained for each intentional element, comparing it
with the satisfaction of the elements of that actor. For
example, the element U.G1 (Learn) has been
evaluated as “Strongly Agree” because it is the
element that provides the most satisfaction for that
actor (24.12) and that is aligned with the highest
importance of this objective (100). However, if the
satisfaction resulting from this element were less than
the satisfaction of another intentional element of that
actor, the stakeholder might not be satisfied with it,
since he/she would say that there is something that is
more important than his/her objective.
Figure 1 shows an analysis result obtained for the
GRL-Quant technique by a participant in one of the
systems used in the experiment. The number on the
left-hand side of the arrow is the assigned importance,
while the number on the right-hand side is the
calculated satisfaction score. This score represents the
satisfaction of the stakeholder with the result obtained
by applying GRL-Quant. The text that appears below
it is the result of the evaluation phase, i.e., the
perceived satisfaction assigned by the participant to
each intentional element, whose values can be one of
the following: Strongly agree, Agree, Neither agree
nor disagree, Disagree or Strongly disagree.
The VeGAn (Cano-Genoves et al. 2019)
approach is a goal-oriented analysis technique that
uses a qualitative prioritization and systematic
propagation together with Fuzzy Multiple-Criteria
Decision-Making (FMCDM) to calculate how
valuable each intentional element of a goal model is.
This technique has three activities.
The first activity consists of prioritizing the
intentional elements. To do this, each stakeholder
assigns an importance level (Very High, High,
Medium, Low, Very Low) and a confidence level
(Possibly More, Confident, Possibly Less) regarding
the importance assigned to each of his/her intentional
elements. Note that from the point of view of the
stakeholder two qualitative values are assigned to
each intentional element (importance and confidence
levels), however, internally, these two values are
combined with fuzzy logic to obtain a more precise
measure of his/her intentional elements’ relative
importance.
The second activity (propagation) consists of
calculating the value of each intentional element
considering that each intentional element is not
isolated but related to other intentional elements in
the model. To do this, the impact that each intentional
element has on the rest of the model elements is
automatically calculated on the basis of the different
relationships among the elements in the model.
The calculated impact and the importance
assigned by the stakeholders are then fuzzified, i.e.,
the corresponding fuzzy number that represents the
range of possible values is determined. For example,
an intentional element with a Very High importance
level is fuzzified to (80, 100), meaning that this
element has an importance of between 80 and 100,
but without knowing the exact number.
A variation of the FTOPSIS (Fuzzy Technique of
Order Preference Similarity to the Ideal Solution)
(Chen 2000) technique is subsequently employed to
calculate the value of each intentional element by
using this fuzzified importance level and the impact
between the intentional elements.
The propagation rules used by VeGAn to
calculate the impact that an intentional element has on
another depending on the type of relationship are the
following:
Decomposition links: The impact of the
intentional element is distributed between the
intentional element that is composed, taking into
account its weight for the intentional element
that is decomposed. Furthermore, the impact of
the intentional elements of an AND
decomposition is propagated to the intentional
element that is composed. If the decomposition
is of type OR or XOR, only the impact of the
most valuable child will be obtained.
Contribution links: The impact of the intentional
element that contributes is the impact of the
element contributed multiplied by the weight of
the contribution divided by 100.
Dependency links: The impact the of intentional
element depended on has the maximum impact
on the element that depends.
Finally, the third activity is evaluation. This is
performed by the stakeholders in order to assess their
agreement with the calculated value of each
intentional element. This activity can help detect
problems in the prioritization of intentional elements,
in the weights that the different links of the goal
models may have, or in the propagation activity.
Figure 2 shows an analysis result obtained for the
VeGAn technique by a participant in one of the
systems of the experiment. The codes on the left-hand
side of the arrow are the acronyms of the assigned
importance level (i.e., VH, H, M, L, VL) and
confidence level (i.e., PM, C, PL) while the number
on the right-hand side of the arrow is the calculated
MODELSWARD 2022 - 10th International Conference on Model-Driven Engineering and Software Development
244
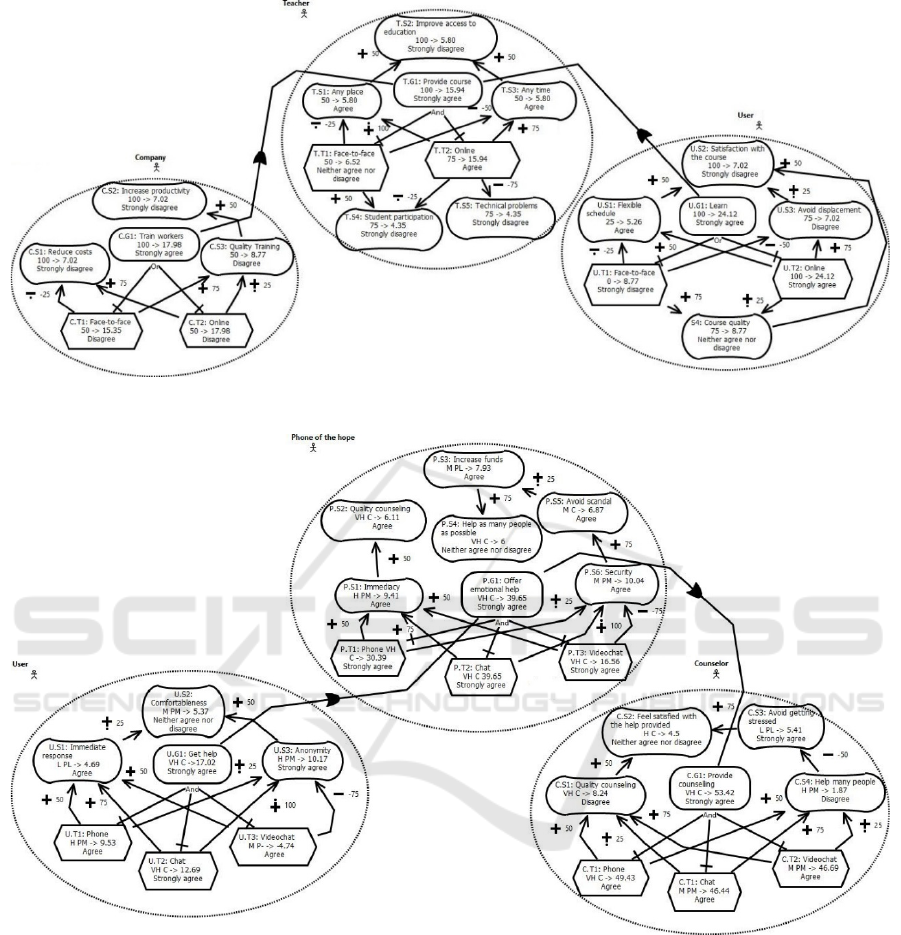
Figure 1: Analysis result of a participant using the edX system with the GRL-Quant technique.
Figure 2: Analysis result of a participant using the Hope system with the VeGAn technique.
value. For example, “VH C -> 6” from the intentional
element P.S4 means that this element has a Very High
level of importance, a Confident level of confidence
and a calculated value of 6. The text that appears
below it is the result of the evaluation phase (e.g., the
perceived satisfaction assigned by the participant to
the P.S4 element is “Neither agree nor disagree”).
3 CONTROLLED EXPERIMENT
On the basis of the Goal-Question-Metric (GQM)
template (Basili and Rombach 1988), the goal of the
experiment is to analyze GRL-Quant and VeGAn for
the purpose of assessing them with respect to the
accuracy of the prioritization (i.e., prioritization
accuracy), the participants’ prioritization time, and
their perceptions regarding the quality of the analysis
results (perceived satisfaction) from the point of view
Experimental Comparison of Two Goal-oriented Analysis Techniques
245

of novice software engineers in the context of
Computer Science undergraduate students. Although
experienced analysts and practitioners would have
been preferable, we focused on the profile of novice
software engineers since our objective was to obtain
initial insights into the usefulness of these techniques
as regards supporting decision making. The research
questions addressed were:
RQ1: Which technique allows analysts to
prioritize intentional elements more
accurately?
RQ2: Which technique allows analysts to
prioritize intentional elements faster?
RQ3: Which technique is perceived to provide
better analysis results?
3.1 Context Selection
The context of this study is the analysis of two goal
models when novice software engineers employ goal-
oriented analysis techniques.
Experimental Objects: The goal models to be
analyzed using both techniques were selected and
adapted from requirements engineering literature:
O1 – Hope (Horkoff and Yu 2016): the purpose
of this system is to offer users an online
counselling service for people in crisis
situations. This system is shown in Figure 2.
O2 – edX (Liu and Yu 2004): the purpose of
this system is to offer an online education
platform that helps increase access to
education. This system is shown in Figure 1.
Selection of Participants: The participants
comprised 64 Computer Science undergraduate
students at the Universitat Politècnica de València
enrolled in a Requirements Engineering course. The
participants were selected by means of convenience
sampling. Since we were focusing on the profile of
novice analysts, we selected participants with no
previous knowledge of goal models and goal-oriented
analysis. We verified this assumption by means of a
pre-questionnaire. All the participants were
volunteers and were aware of the practical and
pedagogical purposes of the experiment, but the
research questions were not disclosed to them. The
participants were not rewarded for their effort.
3.2 Variable Selection
The main independent variable was the goal-oriented
analysis technique, that could assume two possible
values: GRL-Quant and VeGAn. The secondary
independent variable was the experimental object,
which had two possible values: Hope and edX.
There are three dependent variables: prioritization
accuracy and prioritization time and perceived
satisfaction.
The Prioritization Accuracy (PA) variable was
used to assess the correctness (whether the
importance conforms to the expected importance) and
completeness (whether all the intentional elements
have been prioritized). This variable was measured by
using an information retrieval-based approach
(Frakes and Baeza-Yates 1992) that has been used in
other SE experiments (Abrahão et al. 2019) to
compare models with a Golden Solution (i.e., the
correct set of relative importance assigned by a
domain expert) regarding each intentional element.
One of the materials provided to the participants was
an Annex with a description of Personas (Cooper
1999) (for each stakeholder) in order to assist the
participants to assign the relative importance to the
elements in the goal model in an attempt to ensure that
the assignment would not be so subjective. As an
example, if the behavioral pattern of a Persona
suggests that is impatient, when the participant
assigns a relative importance to an intentional
element such as “fast response”, a value of Very High
(VeGAn) / 100 (GRL-Quant) or High (VeGAn) / 75
(GRL-Quant) should be assigned.
We, therefore, used the harmonic mean of
precision and recall, attaining a balance between the
correctness and completeness of the importance
assigned to each intentional element within a goal
model by employing the following equation:
F-measure
e
=
|
P
element
∩GS
element
|
|
P
e
l
e
m
e
nt
|
(1
)
Where P
element
indicates assigned importance
elements of a given goal model by a participant and
GSelement indicates the known correct set of
expected importance assigned that can be easily
derived by means of a Golden Solution. Since the
golden solution might have been biased by the
expert’s experience, the elements of a goal model can
have several prioritization solutions, we considered
only these first solutions as a baseline, which could
evolve if the participants added new correct solutions.
The Prioritization Time (PT) variable was
measured as the total time (in minutes) taken by a
participant to assign a relative importance to all the
intentional elements of the goal model.
The Perceived Satisfaction (PS) measured how
satisfied the participant was with the analysis results
obtained after using the technique. The participant,
MODELSWARD 2022 - 10th International Conference on Model-Driven Engineering and Software Development
246

therefore, had to evaluate the propagation result
obtained for each intentional element by using a 5-
point Likert scale, ranging from 1 (strongly disagree)
to 5 (strongly agree).
3.3 Hypotheses
The null hypotheses of the experiment can be
summarized as follows:
H1
0
: PA (GRL-Quant) = PA (VeGAn)
H2
0
: PT (GRL-Quant) = PT (VeGAn)
H3
0
: PS (GRL-Quant) = PS (VeGAn)
The goal of the statistical analysis was to reject
these hypotheses and possibly accept the alternative
ones (e.g., H1
1
= ¬H1
0
). All the hypotheses are two-
sided because we did not postulate that any effect
would occur as a result of the use of these goal-
oriented analysis techniques.
3.4 Experimental Design and Task
A balanced between-subjects with a confounding
effect design was employed, that is, a participant used
one of the techniques with one of the experimental
objects. We, therefore, had four treatments, owing to
the combinations of goal-oriented analysis technique
and system. The reason why two experimental objects
were used in each group was to minimize the
domain/system effect. The design chosen mitigated
possible learning effects, since none of the
participants repeated any goal-oriented analysis
technique or system while carrying out the
experiment. Table 1 shows the experimental design.
Table 1: Experimental Design.
Run 1 (Control
g
rou
p)
Run 1 (Experimental
g
rou
p)
Treatment
GRL-Quant,
Ho
p
e
VeGAn, Hope
GRL-Quant,
edX
VeGAn, edX
Prior to the experiment, the participants attended
a training session concerning the use of the goal-
oriented analysis techniques and performed an
exercise. The tasks to be carried out without imposed
time limit for both techniques were the following:
1. Goal Model Understanding: The participants
had to read a description of a goal model and
answer a set of control questions. These
questions helped the participants to focus on
understanding the goal model and allowed us to
control their comprehension of the problem.
2. Intentional Element Prioritization: The
participants had to assign an importance level
to each intentional element of the goal model.
To do this, the participant had to understand the
needs and goals of the stakeholders, through
the use of the Persona technique (Cooper
1999), and prioritize the intentional elements.
3. Goal-oriented Analysis: The participants used
an Excel file with macros that automated the
calculation of satisfaction / value of each
intentional element, given the level of
importance.
4. Evaluation: The participants evaluated the
analysis results obtained using the technique by
assigning a degree of agreement with the
results obtained to each intentional element of
the model. They had to use the Persona
technique to understand the stakeholders’
needs and goals.
The documents supporting the training in the
experimental task included:
Four kinds of booklets covering the four
possible combinations of both goal-oriented
analysis techniques and experimental objects
(GRL-Quant-O1, GRL-Quant-O2, VeGAn-
O1, VeGAn-O2). These booklets described the
experimental task to be performed.
Two appendices containing a detailed
explanation of each goal-oriented analysis
technique.
One appendix containing the Personas
employed to describe each stakeholder and
help the participants to understand the
stakeholders’ needs, goals and points of view.
Four Excel files with macros covering the four
possible combinations of both goal-oriented
analysis techniques and experimental objects
with which to automatize the propagation of
both techniques.
The experiment materials, including the
survey questionnaire, are available at
https://research.webs.upv.es/modelsward2022/. The
material is in Spanish, which is the mother tongue of
the participants in the experiment.
3.5 Data Analysis
The results were collected using the booklets (in order
to ascertain the time needed to prioritize (PT)), the
Excel files provided (in order to discover the
prioritization accuracy (PA) and perceived
satisfaction (PS)). We used descriptive analysis,
violin plots and statistical tests to analyze the data
Experimental Comparison of Two Goal-oriented Analysis Techniques
247

collected from the experiment. As is usual, in all the
tests, we accepted a probability of 5% of committing
a Type-I error, i.e., rejecting the null hypothesis when
it is actually true.
The data analysis was carried out by employing
the following steps:
1. We first carried out a descriptive study of the
measures for the dependent variables.
2. We analyzed the characteristics of the data in
order to determine which test would be most
appropriate to test our hypotheses. Since the
sample size of the experiment was less than 50,
we applied the Shapiro-Wilk and Brown-
Forsythe Levene-type tests in order to verify
the normality and homogeneity of the data.
3. We analyzed whether there was any interaction
between the independent variables. We used
ANOVA when the data was normally
distributed and the variances were
homogeneous, and the Kruskal-Wallis test
when the ANOVA assumptions were not met.
4. This depended on the results of step 3:
When an interaction was detected, we
performed a post-hoc analysis to
determine which treatments were
significant. A Mann–Whitney test or a t-
test was used for this purpose, depending
on the normality of the data distribution.
When an interaction between the
independent variables was not detected,
we combined the data and compared the
treatments by using a two-way ANOVA or
the Mann–Whitney test (when the
ANOVA assumptions were not met).
4 RESULTS
In this section, we discuss the experimental results by
quantitatively analyzing the data according to the
hypotheses stated. The results were obtained by using
SPSS v20 and R v4.0.1. A qualitative analysis based
on the feedback obtained from the open questions of
the post-task questionnaire is also provided.
4.1 Descriptive Statistics and
Exploratory Analysis
Table 2 shows a summary of the results of the goal
model analysis task performed, divided by Technique
and System. At a glance, it will be noted that the
participants prioritized more accurately when
analyzing the edX system with the GRL-Quant
technique. However, the participants perceived the
results obtained with the VeGAn technique to be
more satisfactory than when using the GRL-Quant
technique. With respect to the prioritization time,
there is no differences between the techniques or the
systems.
Table 2: Summary of Descriptive Analysis Grouped by
Technique.
Var. Tech. System Mean Median
Std.
Dev
PA
GRL-
Quant
All 68.4 67 10.3
Hope 62.2 64 7.44
edX 74.5 76 9.17
VeGAn
All 59.2 58.5 8.17
Ho
p
e 59 58 9.10
edX 58.9 59 7.41
PT
GRL-
Quant
All 17 16 7.47
Hope 17.1 15.5 7.72
edX 16.2 16 7.39
VeGAn
All 18 18 5.85
Ho
p
e 18.6 18.5 5.23
edX 17.3 17 6.45
PS
GRL-
Quant
All 3.38 3.45 0.38
Hope 3.38 3.52 0.41
edX 3.39 3.30 0.37
VeGAn
All 3.71 3.86 0.48
Ho
p
e 3.69 3.86 0.51
edX 3.64 3.85 0.56
Figure 3: Violin plot of PA, PT and PS variables split by
technique.
The overall comparison of the two techniques
without splitting by system is visually represented in
Figure 3 by means of violin plots. The visual
representation of the variable Prioritization Accuracy
(PA) suggests that there is a difference between both
techniques in favor of GRL-Quant, but the
representation of the variables Prioritization Time
MODELSWARD 2022 - 10th International Conference on Model-Driven Engineering and Software Development
248

(PT) and Perceived Satisfaction (PS) the suggest that
there is no difference between the techniques.
4.2 Hypotheses Testing
Table 3 shows the results obtained after testing the
effects of the technique, system, and their interactions
for the Prioritization Accuracy (PA), Prioritization
Time (PT) and Perceived Satisfaction (PS).
Table 3: Summary of statistics for the dataset.
Var. Inter. Tech.
In
favor
of
System
In
favor
of
PA 0.000* 0.000#
GRL-
Quant
0.203# -
PT 0.970 $ 0.557$ - 0.399$ -
PS 0.009* 0.000# VeGAn 0.973# -
$ ANOVA; *Kruskal-Wallis; #Mann-Whitney
4.2.1 Testing Prioritization Accuracy
The Kruskal-Wallis test indicates that there is an
interaction between the technique and the system (p-
value = 0.000), signifying that it was necessary to
carry out a post-hoc analysis. The results of the
analysis detect two interactions, as shown in Table 4.
The interactions show that the participants obtained
greater accuracy when they used the GRL-Quant
technique to prioritize the edX system. This
interaction leaded us to detect a significant difference
between techniques, which occurred only when the
edX system was analyzed.
Table 4: Test results for the post-hoc analysis for PA.
Interaction Combination p-value
In favor
of
Technique
over
System
G vs V with edX 0.000 # G
G vs V with
Ho
p
e
0.357 & -
System
over
Technique
edX vs Hope
with G
0.001 # edX
edX vs Hope
with V
0.264 & -
G GRL-Quant; V VeGAn; $ ANOVA; #Mann-Whitney
These results can be seen in Table 2, in which the
mean of GRL-Quant is higher when the edX system
is analyzed. The null hypothesis H1
0
could not,
therefore, be rejected except when the edX system
was analyzed. This result may indicate that the
participants’ accuracy was greater when using the
GRL-Quant technique to analyze goal models of
domains like edX, but this assumption should be
validated in further experiments.
These results may be owing to the fact that both
techniques prioritize in different ways. On the one
hand, GRL-Quant uses a quantitative scale, on which
the user has to assign a value of between 0 and 100.
On the other, VeGAn uses a qualitative scale on
which the user has to assign one of the following
values: Very High, High, Medium, Low, Very Low.
4.2.2 Testing Prioritization Time
The ANOVA test performed did not detect an
interaction or a significant difference as regards the
technique used or the system analyzed. The
difference between the two techniques in terms of
prioritization time is not statistically significant. The
null hypothesis H2
0
could not consequently be
rejected, since the time taken by the participants to
prioritize was similar when using both techniques.
These results may be owing to the fact that the
prioritization of both techniques is quite similar and
that the difference between them does not affect the
time required to prioritize.
4.2.3 Testing Perceived Satisfaction
The Kruskal-Wallis test indicates that there is an
interaction between the technique and the system (p-
value = 0.009), signifying that it was necessary to
carry out a post-hoc analysis. We then performed a
post-hoc analysis using a t-test and a Mann-Whitney
test (depending on the normality of the data) to detect
which pairs of treatments were significantly different.
The results suggest that there are two significant
interactions, as shown in Table 5. The interactions
detected show that the participants perceived the
analysis results obtained by the VeGAn technique to
be more satisfactory, regardless of the system.
Table 5: Test results for the post-hoc analysis for PS.
Interaction Combination p-value
In favor
of
Technique
over
System
G vs V with edX 0.027 & V
G vs V with
Hope
0.014 # V
System
over
Technique
edX vs Hope
with G
0.663 # -
edX vs Hope
with V
0.850 # -
G GRL-Quant; V VeGAn; $ ANOVA; #Mann-Whitney
One of the possible reasons for this is that the
techniques analyze differently, and that VeGAn takes
more factors into account such as the importance of
the stakeholders or their confidence level as regards
the assigned relative importance.
Experimental Comparison of Two Goal-oriented Analysis Techniques
249

4.5 Summary of the Results
A summary of the results obtained is provided in
Table 6. The most prominent result is that the
participants perceived the analysis results obtained by
VeGAn to be more satisfactory.
Table 6: Summary of results.
H
yp
otheses Status In favor of
H1
0
: PA
Could not be
re
j
ected*
GRL-Quant
anal
y
zin
g
edX
H2
0
: PT
Could not be
rejecte
d
-
H3
0
: PS Re
j
ecte
d
VeGAn
*Interaction detected
The H1
0
could not be rejected because no
significant difference was detected when we
compared the PA of the techniques regarding the
analysis of the Hope system. However, the
interactions detected shown that the participants’
accuracy was greater when using GRL-Quant to
analyze the edX system. Overall, these results may
suggest that the scale of VeGAn can be improved by
experimenting with different ranges.
Regarding the PT, the results show that there is
neither an interaction effect nor a difference in means
between technique and system for this variable.
Hypothesis H2
0
could not, therefore, be rejected, as
no significant difference was detected as regards the
time taken by the participants to prioritize.
Regarding the PS, we found interaction between
the technique and the system, but this interaction
occurred between the techniques, regardless of the
system. It was, therefore, possible to reject hypothesis
H3
0
in favor of VeGAn. These may suggest that the
results of VeGAn are perceived more satisfactorily
than those of GRL-Quant.
5 THREATS TO VALIDITY
In this section, we discuss some of the issues that
might have threatened the validity of this experiment.
Regarding the internal validity the design of the
experiment helped mitigate the learning effect, since
each participant used only one goal-oriented analysis
technique. In addition, none of the participants had
prior experience of goal-oriented analysis techniques.
The exchange of information between the participants
was avoided by using two different experimental
objects and monitoring the participants during the
experiment. The understandability of the materials
was assessed by conducting a pilot study.
Regarding the external validity the
representativeness of the results could have been
affected by the experimental objects used, the context
and the participants selected. The experimental task
can be considered realistic for small-sized projects,
and they are not trivial. The experiment was
conducted with students with no experience in goal-
oriented analysis techniques who received only
limited training in the techniques. However, their
profile was not very different to that of junior
software analysts. Experiments in industrial contexts
are, therefore, required in order to increase our
awareness as regards these results.
With regard to the measures used to quantify the
dependent variables, the prioritization accuracy was
measured using an information retrieval-based
approach together with the Persona (Cooper 1999)
technique in order to avoid any subjective evaluation.
In the case of the prioritization time, we asked the
participants to write down their starting and finishing
times when they accomplished the prioritization time.
The main threat is the validity of the statistical
tests applied. This threat was alleviated by using
commonly accepted tests employed in the empirical
SE community (Maxwell 2002), but more
replications are needed in order to confirm these
results. These results could be owing to the fact that
GRL-Quant and VeGAn calculate the results
differently and that VeGAn takes more factors into
account, such as the importance of the stakeholders or
confidence with the assigned importance.
6 CONCLUSIONS
The results show that the participants perceived the
results of VeGAn more satisfactorily than those of
GRL-Quant. Although this is still a preliminary
result, it encourages us to continue improving VeGAn
and to explore its use in more complex scenarios. An
interaction for the prioritization accuracy was
identified when GRL-Quant was used on the edX
system. We did not anticipate this interaction, since
we expected VeGAn to have greater prioritization
accuracy owing to the scale it uses (qualitative),
which is closer to natural language. We shall further
investigate this result in order to understand the
reasons behind it and to improve VeGAn. However,
since VeGAn’s major contribution is its fuzzy logic-
based propagation, which performs the value
calculation, we consider that the overall result of this
preliminary experiment is satisfactory.
From a research perspective, these results may be
of interest since we compared the accuracy of the
MODELSWARD 2022 - 10th International Conference on Model-Driven Engineering and Software Development
250

prioritization of intentional elements when using a
quantitative propagation technique, GRL-Quant, with
a fuzzy logic one, VeGAn. Moreover, the
participants’ use of the Persona (Cooper 1999)
technique helped them understand the stakeholders’
point of view and these could be considered as
surrogates for actual stakeholders when performing
these kind of studies. Of course, if the VeGAn
technique is used in a context with practitioners and
customers, the prioritization should be performed by
the actual stakeholders, and we would also need to
study how the technique behaves in this scenario.
As future work, we plan to implement a tool that
will provide technological support to the VeGAn
technique. Given the high number and complexity of
calculations, we consider that this tool will potentially
make it possible to reach a large number of users of
goal models interested in a value-driven analysis of
their models. We additionally plan to carry out
replications of this experiment in order to be able to
verify and generalize the results obtained. Finally, we
also plan to compare VeGAn with other goal-oriented
analysis techniques in order to see whether or not
there are significant differences among them.
ACKNOWLEDGEMENTS
This work was supported by the grant TIN2017-
84550-R (Adapt@Cloud project) funded by
MCIN/AEI/10.13039/501100011033 and the
“Programa de Ayudas de Investigación y Desarrollo”
(PAID-01-17) from the Universitat Politècnica de
València.
REFERENCES
Abrahão, S., Insfran, E., Gonzalez-Ladron-de-Guevara, F.,
Fernandez-Diego, M., Cano-Genoves, C., & de
Oliveira, R. P. (2019). Assessing the effectiveness of
goal-oriented modeling languages: A family of
experiments. Information and Software
Technology, 116, 106171.
Amyot, D., Ghanavati, S., Horkoff, J., Mussbacher, G.,
Peyton, L., & Yu, E. (2010). Evaluating goal models
within the goal ‐ oriented requirement language.
International Journal of Intelligent Systems, 25(8),
841-877.
Basili, V. R., & Rombach, H. D. (1988). The TAME
project: Towards improvement-oriented software
environments. IEEE Transactions on software
engineering, 14(6), 758-773.
Boehm, B. W. (2006). Value-based software engineering:
Overview and agenda. In Biffl, S., Aurum, A., Boehm,
B., Erdogmus, H., & Grünbacher, P. (Eds.) Value-based
software engineering, 3-14. Springer.
Cano-Genoves, C., Insfran, E., Abrahao, S., Fernandez-
Diego, M., & González-Ladrón-de-Guevara, F. (2019).
A value-based approach for reasoning with goal
models. In Proceedings of the 28th International
Conference on Information Systems Development
(ISD2019), Toulon, France
Chen, C. T. (2000). Extensions of the TOPSIS for group
decision-making under fuzzy environment. Fuzzy sets
and systems, 114(1), 1-9.
Cooper, A. (1999). The inmates are running the asylum. In
Software-Ergonomie’99 (pp. 17-17). Vieweg+ Teubner
Verlag, Wiesbaden.
Ernst, N. A., Mylopoulos, J., & Wang, Y. (2009).
Requirements evolution and what (research) to do about
it. In Design Requirements Engineering: A Ten-Year
Perspective (pp. 186-214). Springer, Berlin,
Heidelberg.
Frakes, W. B., & Baeza-Yates, R. (Eds.). (1992).
Information retrieval: data structures and algorithms.
Prentice-Hall, Inc.
Horkoff, J., & Yu, E. (2010). Interactive analysis of agent-
goal models in enterprise modeling. International
Journal of Information System Modeling and Design
(IJISMD), 1(4), 1-23.
Horkoff, J., & Yu, E. (2011). Analyzing goal models:
different approaches and how to choose among them.
In Proceedings of the 2011 ACM Symposium on
Applied Computing (pp. 675-682).
Horkoff, J., & Yu, E. (2013). Comparison and evaluation of
goal-oriented satisfaction analysis techniques.
Requirements Engineering, 18(3), 199-222.
Horkoff, J., & Yu, E. (2016). Interactive goal model
analysis for early requirements engineering.
Requirements Engineering, 21(1), 29-61.
Liaskos, S., Jalman, R., & Aranda, J. (2012). On eliciting
contribution measures in goal models. In 20th IEEE
International Requirements Engineering Conference
(RE) (pp. 221-230). IEEE.
Liu, L., & Yu, E. (2004). Designing information systems in
social context: a goal and scenario modelling approach.
Information systems, 29(2), 187-203.
Maxwell, K. D. (2002). Applied Statistics for Software
Managers. Prentice-Hall, Inc.
Experimental Comparison of Two Goal-oriented Analysis Techniques
251
