
Quality Analysis and Colour Decoding of Printed Matters using a
Portable 2D Chroma Meter
Cheng-Ru Li
1
, Chih-Chung Yang
1
, Chun-Han Chou
1
, Ming-Yen Lin
2
and Yu-Hsuan Lin
1,*
1
Taiwan Instrument Research Institute, National Applied Research Laboratories, Hsinchu, Taiwan
2
Division of Nephrology, Department of Internal Medicine, Kaohsiung Medical University, Kaohsiung, Taiwan
Keywords: Chroma Meter, Colour Distribution, Printed Matters.
Abstract: The paper presents an optical imaging system for the colour distribution measurement of objects. It has the
advantages of portable, accuracy and high resolution. The lens barrel and the ring sunlight LEDs are
designed to achieve regional darkroom, high illumination uniformity and high color rendering. After using a
small color chart for calibration, the average color deviation (ΔE*ab) of the imaging system will be lower
than 3. The uniformity of the printed papers could be successfully analysed and achieve color encryption
application. This technology provides a useful solution for imaging and print technology that is very
demanding on color correctness.
1 INTRODUCTION
Color is a kind of human visual characteristic. In the
visible spectrum, all the wavelengths of light mixed
together is known as white light. The eyes collect
the lights bounced off by the objects and form a
color perception in the brain (Nathans, 1999). The
color reflects the spectral results of the interaction of
light and material. Colors categories can be
numerically identified by the coordinates in various
color space or the wavelength range of
electromagnetic radiation. In physical space, the
presentation reproduces of color need to compare the
measured result and traceable standard sample by a
calibration device. The color space is an effective
mathematical model to serve as the basis for the
calibration process (Connolly, 1997). The CIELAB
color space defined by the International Commission
on Illumination (CIE) in 1976 is a commonly used
standard because it contains all colors that humans
can see (Luo,2001) (Schanda, 2007). The LAB color
space expressed through three parameters: L for the
lightness and a and b for the green–red and blue–
yellow components. In general, the color measuring
instrument of object is a chroma meter or
spectrophotometer (Gras, 1990) (Martínez, 2001)
(Smith, 1931). An optical sensor with filters or a
spectrometer was used to separate the wavelength of
light, and then calculate an accuracy numerical value
of color (Zhang, 1997). They can measure the color
of flat material such as paper, plastics and metal, to
help the people to specify and communicate the
color accuracy. However, these devices have a non-
negligible disadvantage. That is, each measurement
can only obtain a single value. We believe that the
single point of measurement cannot represent the
condition of entire sample.
In this study, an optical imaging system for the
color distribution measurement of objects was
developed. The purpose is to make a specific chroma
meter that can obtain two-dimensional information
of samples. This system is composed of white light
LED, darkroom tube and optical imaging device.
The system achieves color analysis capability with
high accuracy, repeatability and resolution
characteristics through a complete color calibration
process. Compared to conventional chroma meter,
the developed system was designed for multi-point
measurement. Therefore, the uniformity and
distribution of color on objects can be measured and
analyzed. This system has advantage of being
portable and is not affected by the external
environment during measurement. In the experiment,
the measured samples are standard color charts and
printed papers. The printing industry has always
attached great importance to color deviation.
However, many kinds of printing equipment may
not be able to supply stable and consistent color
quality for paper. In this system, the average ΔE*ab
between the measured results and the standard color
Li, C., Yang, C., Chou, C., Lin, M. and Lin, Y.
Quality Analysis and Colour Decoding of Printed Matters using a Portable 2D Chroma Meter.
DOI: 10.5220/0010853600003121
In Proceedings of the 10th International Conference on Photonics, Optics and Laser Technology (PHOTOPTICS 2022), pages 123-127
ISBN: 978-989-758-554-8; ISSN: 2184-4364
Copyright
c
2022 by SCITEPRESS – Science and Technology Publications, Lda. All rights reserved
123
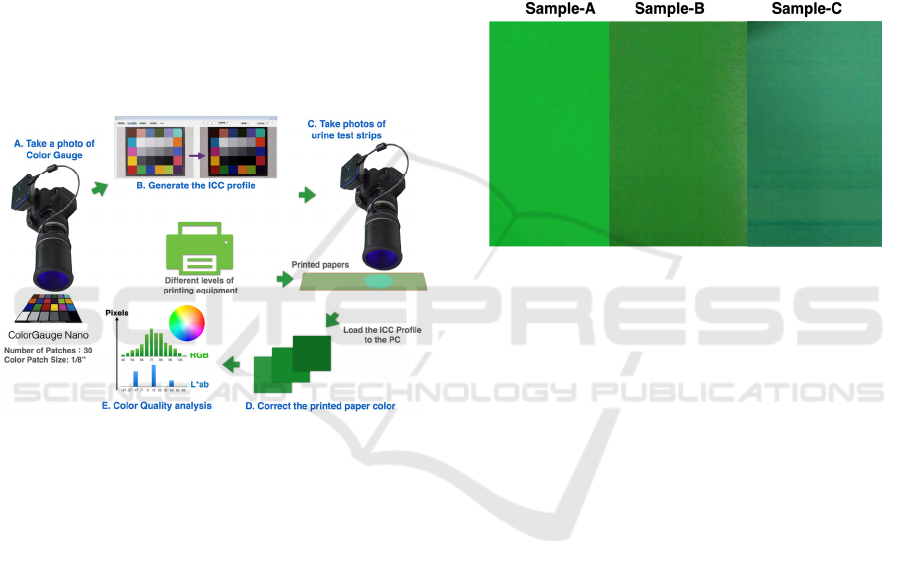
chart is less than 3 (Xu, 2012) (Gómez-Polo, 2016).
This means that the system can identify color
difference which is hard to recognize by human eyes.
After measuring the printed samples, the color
distribution and statistical contribution in LAB color
space was successfully acquired. For cipher
application, four colors with smaller ΔE*ab value was
picked up to make a special color card with them. In
addition, there are other similar colors that are
randomly distributed in the card. It is difficult to
distinguish from the naked eye. Through this system,
the color distribution of this color card can be
obtained correctly. The RGB values of the top five
major colors are used as a tool for encryption coding.
Inaccurate color measurement will not get the correct
private key. The development of this instrument will
contribute to the researches of colorimetry in the field
of print, cipher and relative applications.
Figure 1: The experimental setup of the 2D chroma meter
for the measurement of printed papers.
2 EXPERIMENTAL SETUP AND
SAMPLE PREPARTION
Fig. 1 shows the schematic diagram of the color
correction procedure of the developed instrument.
The system is designed for the color distribution
measurement of printed papers. A CCD camera
(Canon, 77D)and a macro lens (EF-S 60 mm)were
used to capture the optical images of samples. The
field of view of this optical system is 50 mm × 30
mm, and the resolution is about 15 μm. For uniform
illumination and reflection measurement, a ring light
module that has sunlight LEDs was used. The
uniformity of lighting is better than 95% and the
spectrum of the LEDs is similar to sunlight. In order
to isolate the ambient light, a darkroom module was
used between the lens and sample. A small color
checker(ColorGauge Nano, Matte, Edumnd optics)
was measured by the system and provides a
calibration standard. Through the compensation of
ICC profile, the relatively accurate colors could be
obtained by the system. We have verified that the
system can achieve that the average ΔE*ab is less
than 3. The experimental samples are various printed
papers, as shown in Fig.2. The first one is a
commercial color chart without a rigorous
calibration standard. The second and third ones are
normal paper printed by the business and home
printer, respectively. The specified color parameter
when printing is R:0 G:255 B:0. This means that
they theoretically are all pure green.
Figure 2: Various printed papers were measured and
analysed by the 2D chroma meter.
3 RESULTS AND DISCUSSION
The measured results are shown in Fig. 3. The color
of each pixel in the measured optical image is
correctly described and located in the Lab color
space. Since the printed papers are green, the
measured values should be within the third and
fourth quadrants of color space, as shown in the red
frame of Fig 3(a). Figure (b), (c) and (d) indicate the
color distribution of color chart, professional print
and general print in Lab color space. For easy
viewing, only the a-b plane is shown. It indicates
that the 3D color space is flattened to display only
pure color information. Therefore, the lightness (L
value) in Figure 3 may not be correct. This does not
actually affect the results of the analysis. Obviously,
it can be found that a perfect monochrome does not
exist in all kinds of printed matter. The distributions
of colors are regional, not single points. Excellent
print quality of color chart allows color to be
concentrated in a very small area, as shown in Fig
3(a). High end and entry printer will also cause
obvious differences in the degree of color
centralizing, as shown in Fig 3(b) and (c). Although
the color uniformity should be related to printer
level, ink quality, paper material and environment,
PHOTOPTICS 2022 - 10th International Conference on Photonics, Optics and Laser Technology
124
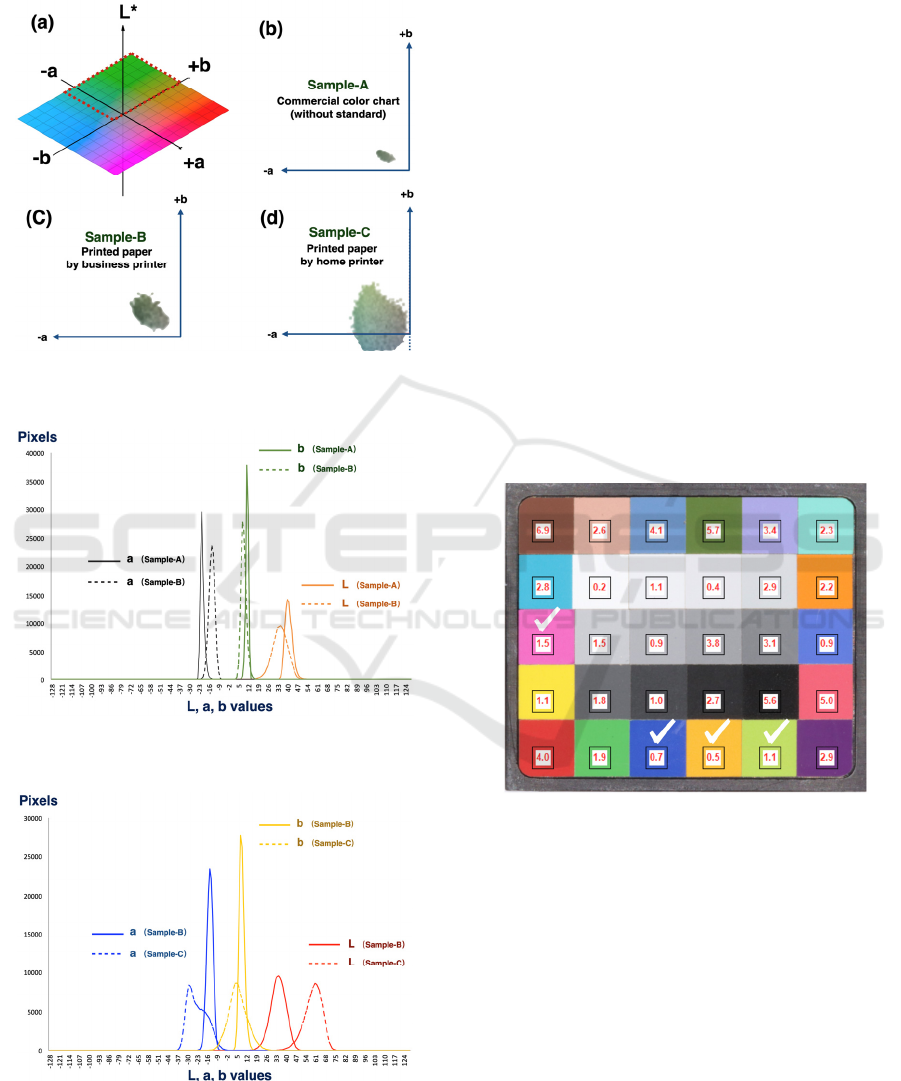
this system provide people a 2D visualization
function to perform the quality judgment for the
final printing product.
Figure 3: Color distributions of the various printed papers
in Lab color space (Only ab plane).
Figure 4: Comparing the colour numerical distribution of
the color chart and paper printed by the business printer.
Figure 5: Comparing the colour numerical distribution of
the papers printed by the home and business printer.
The color distributions of samples were
quantified by drawing the statistical charts. Figure 4
shows the colour numerical distributions of the color
chart and paper printed by the business printer.
Figure 5 shows the colour numerical distributions of
the paper printed by the home and business printer.
The vertical axis of the figure is the amount of pixels,
and the horizontal axis is the values of Lab. In
contrast to the printed papers, most pixels of the
color chart image are concentrated in a narrow band.
It is easy to understand that the larger the bandwidth,
the poorer the print quality. The peak of each
distribution represents the dominant color of the
image in Lab color space. Therefore, the peak
deviation represents the degree of color difference
between the samples. The dominant color of any
kinds of sample could be easily decided by the
statistical chart. For example, the dominant color of
the color chart (sample-A) should be: a: -21, b: 11.
Also, the respective contribution of the border color
could be obtained by comparing the Fig. 3 and 4.
We believe that this 2D chroma meter is very useful.
The future work is improving the color accuracy to
ΔE*ab <1.
Figure 6: Four colors with relatively small color deviation
were selected for encoding.
In addition to the quality analysis of printed
materials, the system can also develop cryptography
in printing and display, such as anti-counterfeiting,
identification and digital keys. Password information
is hidden in the image in a color-distributed manner.
A precise two-dimensional colorimeter can get the
correct color values and perform subsequent
calculations. In order to select the color that is morer
suitable for encoding, we measured and calculated
the color deviation of the system. The smaller the
color deviation, the better the color is suitable for
decoding through the system. Figure 6 shows the
ΔE*ab values for 25 typical colors. Although white
Quality Analysis and Colour Decoding of Printed Matters using a Portable 2D Chroma Meter
125
has good color accuracy, it is not flexible for color
printing. In Fig. 6, the selected color is ticked. They
are blue (0.7), yellow (0.5), and green (1.1). The
color of the red series is generally not too small,
which is due to the original condition of the camera
itself. The pink with an ΔE*ab value of 1.5 is chosen.
These colors will be used as the primary colors for
encoding. If the print or display shows these colors,
the developed system will be able to morer
accurately distinguish its color.
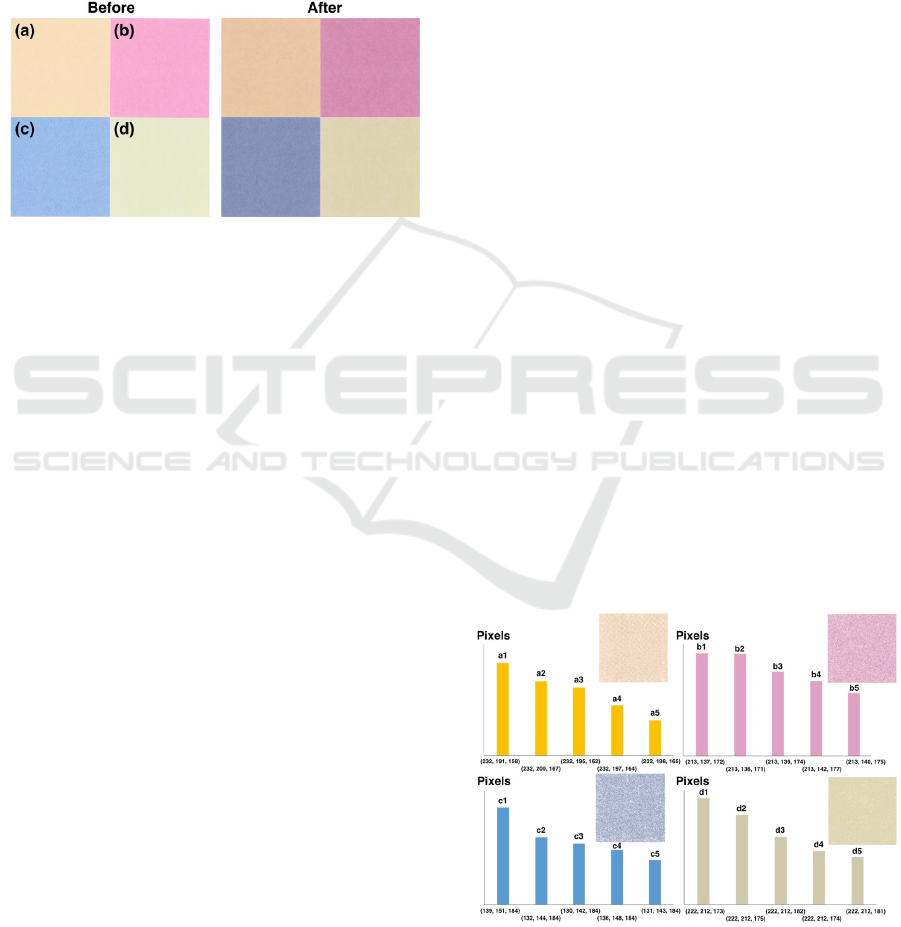
Figure 7: Color blocks with data encryption: (a) Before
color calibration, (b) After color calibration.
Figure 7 shows a photograph printed with these
four colors. (a) is yellow, (b) is pink, (c) is blue, and
(d) is green. The image on the left represents the
image before the color calibration, and the image on
the right represents the image after the calibration.
It’s not easy to find the morer color information
were hidden in the photo. In other words, these color
blocks are not monochromatic. Each color block
contains other colors that are randomly distributed.
These colors are very similar to each other and are
difficult to distinguish. If the optical system for
measuring color has a large deviation (ΔE*ab >1.5),
the obtained color information will be wrong, and
the decoding will fail. The insertion of color for data
encryption can be designed according to the opinion
of each manufacturer. In this study, it is proposed to
perform coding or decoding in the form of color
quantity statistics. Since the encrypted information is
independent to visual perception of the human eye, it
is not represented by the statistical graph of Lab
color gamut. The RGB gamut is consistent with
digital sensation and easier for numerical processing.
The number of colors in each color block of Fig. 7 is
counted and analyzed.
Figure 8 shows the quantitative statistics of
colors in each color block of Fig. 7. Only the five
colors that contribute the most are displayed. The
horizontal axis is the RGB value of the color, and
the vertical axis is the pixel amount. Four square
blocks shown in Fig. 8 represents the color block of
Fig. 7 image described only in five main colors. It
can be found that these key colors are enough to
represent the entire image, but the differences
between them are indistinguishable to the naked eye.
If applied to image encryption, the image does not
have to be square, or it can be a cartoon image or
any geometric shape. Traditionally, the cipher colors
hidden in regular areas might be mistaken for
uneven printing. However, the system has high color
accuracy and resolution, and can distinguish very
small color differences. That is to say, the printed
matter can be made almost uniform. Data encryption
can be easily accomplished as long as a very small
color difference can be formed. Taking this method
as an example, the output of the color information is:
(R
,𝐺
,𝐵
)
~, ~
There are 20 numbers available. If you want to
establish a password of 009-075-010, you can
simply define as follows:
(R
,𝐺
,𝐵
)
,
− (R
,𝐺
,𝐵
)
,
Of course, the real password architecture is
always not so simple, and there are endless ways to
design this part. When the value measured by the
optical system is slightly deviated, the final
calculated value will be incorrect. Therefore, if the
darkroom module, high color rendering lighting and
color calibration program of the system are lacking,
this goal cannot be achieved. This study proposes an
innovative concept for color data encryption of print
matters using a two-dimensional colorimeter.
Printing technology also requires complete color
management to print images with the correct code. If
the home display will all have enough color
accuracy in the future, the concept of this study can
also be extended to related applications.
Figure 8: Quantitative statistics of colors in each color
block and the RGB values of the five most contributing
colors.
PHOTOPTICS 2022 - 10th International Conference on Photonics, Optics and Laser Technology
126

4 CONCLUSIONS
This study succeeded in developing a portable, rapid
and accurate system for the color measurement. The
information it captures is two-dimensional, so all
kinds of images can be directly measured. Through
darkroom modules, ring sunlight LED illumination
and standard color calibration procedures, the
average color deviation of the system is less than 3.
In experiment, various printed papers were measured
by the system. Color distribution in Lab space and
colour numerical distribution of the samples were
sucssufully analysed. This system can also be
applied to the field of color encoding or encryption.
Colors with data information are hidden in color
blocks and can be decoded correctly. This
technology can be widely used in the fields of
printing, display, cipher and relative applications.
ACKNOWLEDGEMENTS
The authors would like to express their appreciation
for financial aid from the Ministry of Science and
Technology, R.O.C under grant numbers MOST
109-2622-E-492-020. The authors would also like to
express their gratitude to the Instrument Technology
Research Center of National Applied Research
Laboratories for the support.
REFERENCES
Nathans, J. (1999). The evolution and physiology of
human color vision: insights from molecular genetic
studies of visual pigments. Neuron, 24(2), 299-312.
Connolly, C., & Fleiss, T. (1997). A study of efficiency
and accuracy in the transformation from RGB to
CIELAB color space. IEEE transactions on image
Luo, M. R., Cui, G., & Rigg, B. (2001). The development
of the CIE 2000 colour‐difference formula:
CIEDE2000. Color Research & Application: Endorsed
by Inter‐Society Color Council, The Colour Group
(Great Britain), Canadian Society for Color, Color
Science Association of Japan, Dutch Society for the
Study of Color, The Swedish Colour Centre
Foundation, Colour Society of Australia, Centre
Français de la Couleur, 26(5), 340-350.
Schanda, J. (Ed.). (2007). Colorimetry: understanding the
CIE system. John Wiley & Sons.
Gras, P. W., Bason, M. L., & Esteves, L. A. (1990).
Evaluation of a portable colour meter for assessment
of the colour of milled rice. Journal of Stored Products
Research, 26(2), 71-75.
Martínez, J. A., Melgosa, M., Pérez, M. M., Hita, E. A. I.
N. S., & Negueruela, A. I. (2001). Note. Visual and
instrumental color evaluation in red wines. Food
Science and Technology International, 7(5), 439-444.
Smith, T., & Guild, J. (1931). The CIE colorimetric
standards and their use. Transactions of the optical
society, 33(3), 73.
Zhang, X., & Wandell, B. A. (1997). A spatial extension
of CIELAB for digital color‐image reproduction.
Journal of the society for information display, 5(1),
61-63.
Xu, B. T., Zhang, B., Kang, Y., Wang, Y. N., & Li, Q.
(2012). Applicability of CIELAB/CIEDE2000 formula
in visual color assessments of metal ceramic
restorations. Journal of dentistry, 40, e3-e9.
Gómez-Polo, C., Muñoz, M. P., Luengo, M. C. L.,
Vicente, P., Galindo, P., & Casado, A. M. M. (2016).
Comparison of the CIELab and CIEDE2000 color
difference formulas. The journal of prosthetic
dentistry, 115(1), 65-70.
Quality Analysis and Colour Decoding of Printed Matters using a Portable 2D Chroma Meter
127
