
The Impact of COVID-19 on Crime: A Study from the
Spatial-temporal Perspective in the Montgomery County, AL
Long Ma
1
and Connor Y. H. Wu
2
1
Department of Computer Science, Troy University, Troy, AL, U.S.A.
2
Department of Geospatial Informatics, Troy University, Troy, AL, U.S.A.
Keywords: COVID-19, Crime Trend, Spatial-temporal, Machine Learning, Montgomery.
Abstract: The policies curbing the spread of COVID-19 can influence the chance of committing a crime. This study
aimed to investigate the impacts of COVID-19 on the spatial and temporal patterns of crime in Montgomery
City, AL, by wavelet analysis, spatial point test, and machine learning tools. We obtained the crime case
records between January 1, 2015 to March 12, 2021 from the police department in the City of Montgomery,
and we downloaded demographical data from the U.S. Census. Results show that the overall crime rate in
Montgomery decreased during the COVID-19 pandemic. However, crime rates would increase in a shorter
time than COVID-19 confirmed cases when the social activities increased. Meanwhile, spatial distributions
of simple assault, burglary, and vehicle theft had clustered in Montgomery business and shopping areas. These
findings are helpful for the police institution in preventing and minimizing crimes as new COVID-19 variants
emerge in the future.
1 INTRODUCTION
The COVID-19 pandemic has spread globally and
impacts every aspect of people’s daily life (Boman &
Mowen, 2021). Governments have implemented
stay-at-home orders and social distancing
requirements to curb the spread of the COVID-19
virus within communities (Piquero, et al., 2021).
People have been requested to limit social contacts,
avoid social gatherings, close schools, and stop
unnecessary business activities (Koh, 2020). Crimes,
therefore, have been changed. For instance, overall
crimes are reported to drop sharply, with approximate
37% worldwide (Boman & Mowen, 2021), 35% in
the United States (Abrams, 2021), 41% in the United
Kingdom (Halford, et al., 2020) during the COVID-
19 pandemic. However, the impacts are varied on
different types of crimes. For instance, some crimes
decreased (e.g., burglary and robbery), some crimes
increased (e.g., domestic violence), some crimes had
no changes (e.g., assault-battery) in Los Angeles and
Indianapolis (Mohler et al., 2020).
This study aims to investigate the impacts that
COVID-19 has had on the spatial and temporal
patterns of crime in Montgomery City, AL, through
spatial and temporal crime analysis approaches.
Specifically, we analyzed the temporal pattern
between COVID-19 and crimes through wavelet
analysis. Then, we explored the spatial pattern
changes of different crimes on March 13, 2020 (the
date with the first COVID-19 confirmed case
reported) through March 12, 2021 (one year after the
first confirmed case) by using the spatial point pattern
test (SPPT) and utilized the local Moran’s I to identify
regional clusters and local spatial outliers.
2 RELATED WORKS
Some studies have analyzed the impact of the
COVID-19 pandemic on the spatial and temporal
distributions of crimes. For instance, Yang, Chen,
Zhou, Liang, and Bai (2021) found that the
distributions of crime in Chicago significantly
changed in 2020, with local changes in theft, battery,
burglary, and fraud displaying an aggregative cluster
in the downtown area. However, because of the
geographical variation, whether their results in a big
city like Chicago can be applied to a middle-sided city
like Montgomery is unknown. Additionally, existing
studies have mainly considered the crime and
COVID-19 data a few months after the COVID-19
occurred in February and March 2020 ( Mohler et al.,
2020). The holiday months at the end of 2020 with
532
Ma, L. and Wu, C.
The Impact of COVID-19 on Crime: A Study from the Spatial-temporal Perspective in the Montgomery County, AL.
DOI: 10.5220/0010856700003116
In Proceedings of the 14th International Conference on Agents and Artificial Intelligence (ICAART 2022) - Volume 3, pages 532-539
ISBN: 978-989-758-547-0; ISSN: 2184-433X
Copyright
c
2022 by SCITEPRESS – Science and Technology Publications, Lda. All rights reserved

the highest numbers of confirmed cases occurred in
many states, and the months when many people got
vaccinated are not considered.
3 MATERIAL AND METHODS
3.1 Study Area and Data
Montgomery is the second-largest city in Alabama,
with a population of 205,764 according to the 2010
census. Montgomery was divided into 199 block
groups, the smallest geographic area for which the
U.S. Census collects and tabulates decennial census
data. In Montgomery, the first case of COVID-19 was
reported on March 13, 2020. The number of
confirmed cases increased and reached 22,232, of
whom 526 had died in its county as of March 12,
2021. During the COVID-19 period, the Stay-at-
Home order was issued on April 3, 2020, which was
canceled on April 30, 2020. The Safer-at-Home
order, which required wearing a mask and social
distancing, was issued on April 30, 2020 and
withdrawn on April 4, 2021.
We obtained the crime case records with date,
time, location (X and Y), crime description, and type
between January 1, 2015 to March 12, 2021 in
Montgomery City from the police department from
the City of Montgomery. Demographical data
(including income and race) at the block group level
used in the analysis were downloaded from U.S.
Census. A block group is a subdivision of a census
tract and consists of blocks. One block group usually
has between 250 and 550 housing units (The United
States. Bureau of the Census, 1994). We used block
groups in the spatial analysis because they are the
smaller geographic areas than census tracts and Zip
codes, and they have a higher number of housing
units for the sample size than blocks.
3.2 Proposed Methods
3.2.1 Wavelet Analysis
The wavelet approach is a proper statistical method
that has been applied in various academic fields (Wu
& Loo, 2017). Because crime and climate data are
constantly varying time series variables influenced by
factors, such as changes in the physical environment,
related laws and policies, and criminal demographics,
we applied wavelet coherency analysis to examine the
possible non-linear and non-stationary connection
between environmental factors and crime rates.
Wavelet coherence allows us to explore the correlation
between two non-stationary signals at a given time and
frequency. Also, we conduct phase analyses to figure
out how the signals are associated. The phase
difference [i.e., in-phase (positively correlated) or out
of phase (negatively correlated)] indicates their
association. Before the wavelet analysis, we normalize
the time-series data by using the formula:
𝑋
=
𝑋−𝜇
𝜎
which X is the time-series data, µ is the mean of X,
and σ is the standard deviation of X.
3.2.2 Spatial Point Pattern Test
This study used SPPT to exam changes or differences
in two different spatial patterns of points based on the
unit area (Andresen, 2009), and SPPT GUI is an open
source software in GitHub (https://github.com/
nickmalleson/spatialtest, accessed on March 6, 2021).
This study applied SPPT to compare the similarity of
spatial distribution patterns of crime in 2020, 2019,
2018, 2017, and 2016 and investigated the local
changes in crime on the level of block groups to
explore whether the pandemic had affected the spatial
distribution of crime. The global S-index (the index
of similarity used to confirm the similar degree of two
spatial point patterns) value of census tracts is larger
than community areas. The global S-index value of
blocks is the largest, yet it needs too much computing
time. Therefore, we took the Montgomery block
groups as the unit area of SPPT.
SPPT includes three parameters: the number of
iterations, sample size, and confidence interval. The
number of iterations is the number of repeated
samplings of the test dataset. The sample size is the
percent size of the test dataset randomly sampling, and
confidence interval based on the test dataset is used to
determine the similarity significance of the two
samples. According to existing spatial analysis
(Andresen, et al., 2017), the number of iterations was
set to 200, the sample size to 85 percent, and the
confidence interval to 95 percent in the analysis. SPPT
identifies the spatial point patterns that diverge in areas
and aggregates the similarities at the local level into a
global index (Wheeler, et al., 2018). Taking the
calculation of the global S-index of crimes in 2020
compared with 2019 as an example, the test can be
described as follows: 1) Adopt crimes in 2020 as the
base dataset and crimes in 2019 as the test dataset (the
test detects spatial pattern variations of the base dataset
relative to the test dataset); 2) Randomly sample 85%
of the test dataset 200 times, and then calculate the
percentage of crimes in census tracts to generate a 95%
The Impact of COVID-19 on Crime: A Study from the Spatial-temporal Perspective in the Montgomery County, AL
533

confidence interval, and 3) Determine whether the
percentage of the primary data in the census tracts falls
into the confidence interval, obtain the value of the
local S-index, and calculate the global S-index.
There are two critical values. One of them is the
global S-index. Another is the local index, which is
applied to identify statistically significant changes on
the micro-scale (local changes). The local S-index has
three values (−1, 0, 1), which means the base dataset
is lower than, similar, or higher than the test dataset
in a spatial unit, respectively. The global S-index
value is the count of the local S-index, which equals
zero, and then divides the number of all spatial units.
The value of the global S-index ranges from 0 (no
similarity) to 1 (perfect similarity), and 0.80 is used
as the threshold to indicate that two spatial point
patterns are similar. Furthermore, we used Moran’s I
to explore the spatial autocorrelation of local changes
to observe the epidemical impact on local areas.
3.2.3 Crime Trend Discovery
As the continuing pandemic of the COVID-19, many
of us face a long-term impact on our lives. Since the
COVID-19 pandemic and the resulting economic
recession have negatively affected many people’s
financial situation and mental health, people’s lives
and relations have dramatically changed over the past
years. Our research expects to discover the local
crime trends in Montgomery during the COVID-19.
As a branch of artificial intelligence, machine
learning is used in many areas that enable a computer
to learn without being explicitly programmed.
Machine learning has already been applied to
COVID-19 related research in these years; however,
few research studies are focused on criminal justice.
Thaipisutikul, et al., in 2021 proposed a framework
to classify the illegal and violent activities from
online Thai news during the COVID-19 pandemic. In
our research, the hidden correlations between crime
trends and the effect of the pandemic are challenging
to disclose; therefore, we apply machine learning to
reveal the relationships between the number of
reporting crimes and the number of COVID-19 cases
in Montgomery from March 13, 2020 to March 13,
2021. We rely on two types of COVID-19 cases in
Montgomery; one is the number of confirmed cases,
and the other is the number of deaths caused by
COVID-19.
Our research adopts one of the most widely used
machine learning methods, supervised learning.
Under supervised learning, the data set is well
labeled; every data instance is tagged with a pre-
defined category. Therefore, each data example is a
pair that consists of an input (X) and corresponding
output (Y). During the training phase, labeled data
has been fed into a machine learning algorithm, which
produces a mapping function to map the input data
with the output value. The generated mapping
function can map the unseen examples to a label in
the test step. Some widely used metrics can be applied
to evaluate the performance of the inferred function
used in the test data. In a word, supervised learning
aims to learn a mapping function from the labeled
data and discover the relationship between the input
and data output. Supervised learning can further be
categorized into classification and regression.
Because our data output is continuous, we will apply
the regression to our research.
To investigate the relationship between the crime
trends and the COVID-19 pandemic, we examine
how the confirmed cases or/and deaths affect the
number of total crimes and the number of individual
crime types in Montgomery. In our research study,
the number of crimes in Montgomery is used as the
output (Y); the number of confirmed cases or/and
deaths is used as input of data (X). We use two state-
of-art machine learning algorithms to fulfill our tasks,
the Support Vector Regression (SVR) and the Linear
Regression. SVR uses the same strategy as Support
Vector Machine (SVM) but is used for regression
tasks. Linear regression models a linear relationship
between input variables and the single output.
Additionally, we use the Root Mean Square Error
(RMSE) method to evaluate the regression
performance of machine learning models.
4 RESULTS AND DISCUSSION
There were 22,944 criminal cases in Montgomery
County from March 13, 2020 to March 13, 2021.
Compared to the pre-pandemic year of 2019 (i.e.,
March 13, 2019 to March 12, 2020), total crime fell
by around 8.26%. For different types of crime, the
numbers of burglary, larceny, traffic violations,
vehicle theft, simple assault, and suicide decreased by
27.47%, 25.30%, 19.72%, 13.43%, 2.91%, and
1.52%, while the numbers of manslaughter,
aggravated assault, robbery, murder, domestic crime,
and rape increased by 42.24%, 38.36%, 18.86%,
14.43%, 6.02%, and 4.41% (Table 1). The number of
crimes of different crime types and the rate of crime
change one year after (March 13, 2020 to March 12,
2021) and before (March 13, 2019 to March 12, 2020)
the first COVID-19 confirmed case are illustrated in
Table 1. The symbol "+" means an increment, and
the symbol "−" refers to a decrement.
ICAART 2022 - 14th International Conference on Agents and Artificial Intelligence
534

Table 1: The number of crimes of different crime types and the rate of crime change.
Crime Type
Number of Crimes in one
year before (March 13, 2019
to March 12, 2020
)
Number of Crimes in one
year after (March 13,
2020 to March 12, 2021
)
Rate of Change
Murde
r
970 1,110 +14.43%
Manslau
g
hte
r
490 697 +42.24%
Rape 68 71 +4.41%
Aggravated Assault 73 101 +38.36%
Simple Assault 3784 3674 -2.91%
Robber
y
350 416 +18.86%
Bur
g
lar
y
5101 3700 -27.47%
Larcen
y
4249 3174 -25.30%
Vehicle Theft 1117 967 -13.43%
Domestic Crime 5120 5428 +6.02%
Suicide 261 257 -1.53%
Traffic Violations 71 57 +19.72%
Table 2: The means and standard deviations of crime rates (per 1,000 people) in the communities with different population
density and races in one year after (March 13, 2020 to March 12, 2021) and before (March 13, 2019 to March 12, 2020) the
first COVID-19 confirmed case.
Year Popu_Density Mean (SD) P-value Race Mean (Sd) P-value
One year
after
Low 0.199 (0.073)
<0.001
White 0.166(0.055)
<0.001
High 0.326 (0.079)
Africa
America
0.351(0.070)
Five
years
before
Low 0.237 (0.055)
<0.001
White 0.185(0.058)
<0.001
High 0.373(0.087)
Africa
America
0.412(0.082)
In Table 2, when we grouped the crime cases by
the population density of the block groups they
located in, the results show that block groups with a
low population density would have a significantly
lower crime rate than the ones with a high population
density [i.e., 0.199 (SD=0.073) vs. 0.326 (0.079).
p<0.001]. The crime rate in the white community was
significantly lower than the rate in the Africa
American communities [i.e., 0.166 (SD=0.055) vs.
0.351 (0.070). p<0.001], even though similar findings
can be found in the past five years.
Table 3 shows the results of the global Moran’s I,
which is generally used to indicate the global spatial
autocorrelation. Values of the global Moran’s I range
from -1 to +1. Values above zero indicate positive
spatial autocorrelation, and values below zero
indicate negative spatial autocorrelation. Moreover,
the significance of the global Moran’s I values can be
transformed to the p-value and Z-score. The p-value
is the significance level of Moran’s I, and the Z-value
is the Moran’s I statistic standard deviation. Table 3
also displays that the p-values of rape, simple assault,
and burglary were less than 0.05. The Z-scores are
greater than 1.96, indicating that crimes' spatial
distributions were significantly autocorrelated. The
global Moran’s I value of simple assault and burglary
Table 3: Global Moran’s I of local changes between 2020
and 2019 in different crimes.
Crime Types
Global
Moral's I
p-Value Z-Score
Murde
r
-0.055 0.222 -1.222
Manslaughte
r
-0.086 0.052 -1.941
Rape -0.104 0.018 -2.358
Aggravated
Assault
0.015 0.635 0.475
Simple Assault 0.094 0.020 2.325
Robbery -0.055 0.243 -1.167
Bur
g
lar
y
0.101 0.012 2.499
Larcen
y
-0.006 0.974 -0.032
Vehicle Theft -0.015 0.810 -0.241
Domestic
Crime
0.063 0.113 1.584
Suicide 0.064 0.106 1.617
Traffic
Violations
0.033 0.355 0.924
were larger than 0, proving that local changes in these
two crime types display a positive spatial
autocorrelation. In contrast, the global Moran’s I
value of rape was smaller than 0, suggesting that local
changes in these two crime types exhibit a negative
spatial autocorrelation. The significant
autocorrelations of rape, simple assault, and burglary
The Impact of COVID-19 on Crime: A Study from the Spatial-temporal Perspective in the Montgomery County, AL
535
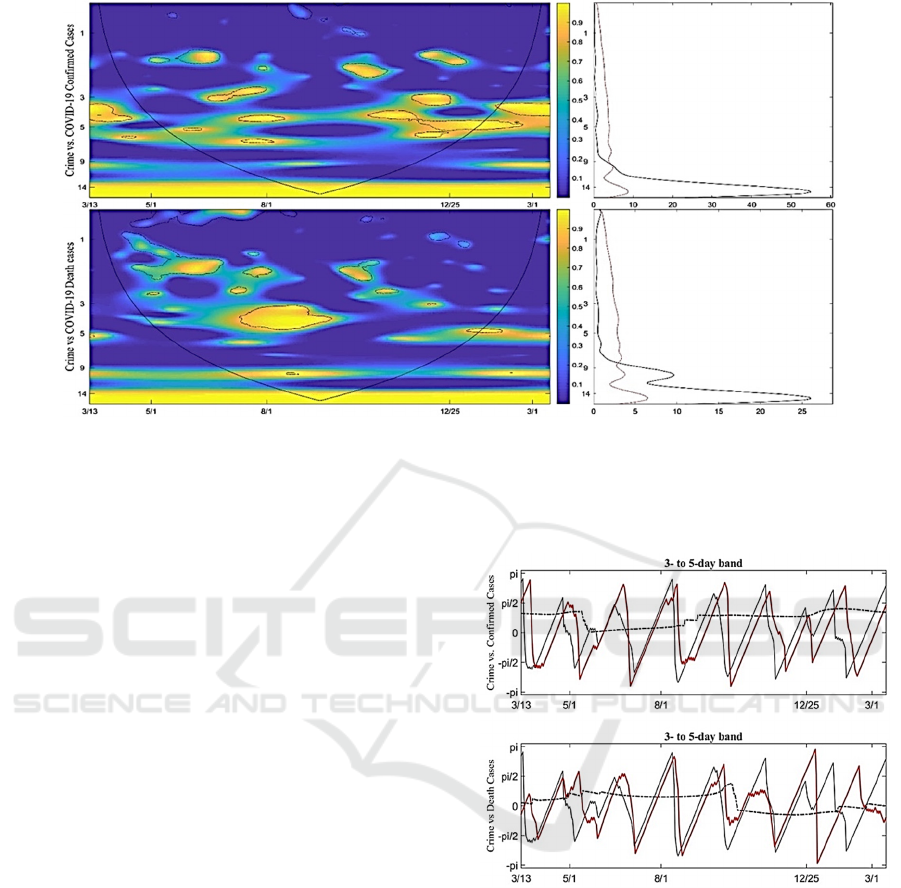
Figure 1: Continuous wavelet power spectra (left) and global wavelet spectrum (right) of the time series.
verified that the spatial distributions of some types of
crimes are associated with the COVID-19 pandemic.
Turning to wavelet analysis, we first present the
wavelet power spectra of the time series in Figure 1
after minimizing the red-noise bias by dividing the
wavelet power by the period. In our crime rates time
series, there is a 3 to 5-day periodicity band in the
panels of COVID-19 confirmed cases, particularly
during the holiday season (November 2020 to January
2021). A similar band in 3 to 5 days also can be found
from August to November 2020 in the panel of
COVID-19 death cases. In Figure 1, Blue represents
lower power values, while yellow represents high
values. The red curve shows the influence cone
delimiting the region from the edge effect. The
dashed black line indicates the 95% confidence
interval based on 10,000 Markov bootstrapped series.
We compute the phases of criminal cases and
COVID-19 cases (e.g., confirmed and death cases)
and their phase difference to obtain additional
information about the linkage between COVID-19
and crime. Figure 2 reveals that the number of
COVID-19 confirmed cases was out of phase with the
number of crime cases, with a delay of ½ of a quasi-
cycle in the holiday season in 2020. The number of
crime cases leads the number of COVID-19 death
cases by ¼ quasi-cycle between July and October
2020. Blue represents lower power values, while
yellow represents high values. The red curve shows
the influence cone delimiting the region from the
edge effect. The dashed black line indicates the 95%
confidence interval based on 10,000 Markov
bootstrapped series. The number of crime cases, with
a delay of ½ of a quasi-cycle in the holiday season in
2020. The number of crime cases leads the number of
COVID-19 death cases by ¼ quasi-cycle between
July and October 2020.
Figure 2: Phases of crime and COVID-19 cases were
computed in the 3- to 5-day periodic band (cf. Figure 1).
After the SPPT test, all crime types (except traffic
violations) had a global S-index value of less than 0.8.
These values are low between 2019 (base dataset) and
2018 (test dataset), similar to the values between 2020
(base dataset) and 2019 (test dataset). The global S-
index values described that the spatial distribution
trend of crimes is not stable and usually changes
significantly every year. We cannot determine
whether the COVID-19 pandemic has impacted the
spatial distributions of crimes with the global S-index
values. However, results of the local S-index showed
that changes in some regional areas are relatively
ICAART 2022 - 14th International Conference on Agents and Artificial Intelligence
536
stable. Andresen et al. observed the spatial
characteristics of crimes based on local changes and
proved the importance of smaller spatial units of
analysis before our research. Thus, we investigated
the variation of crimes in local spatial units in the
following part. We subdivided the percentage
difference of spatial units between 2020 and 2019
into several classes when local S-index values are not
equal to zero. Then, we used gradation color symbols
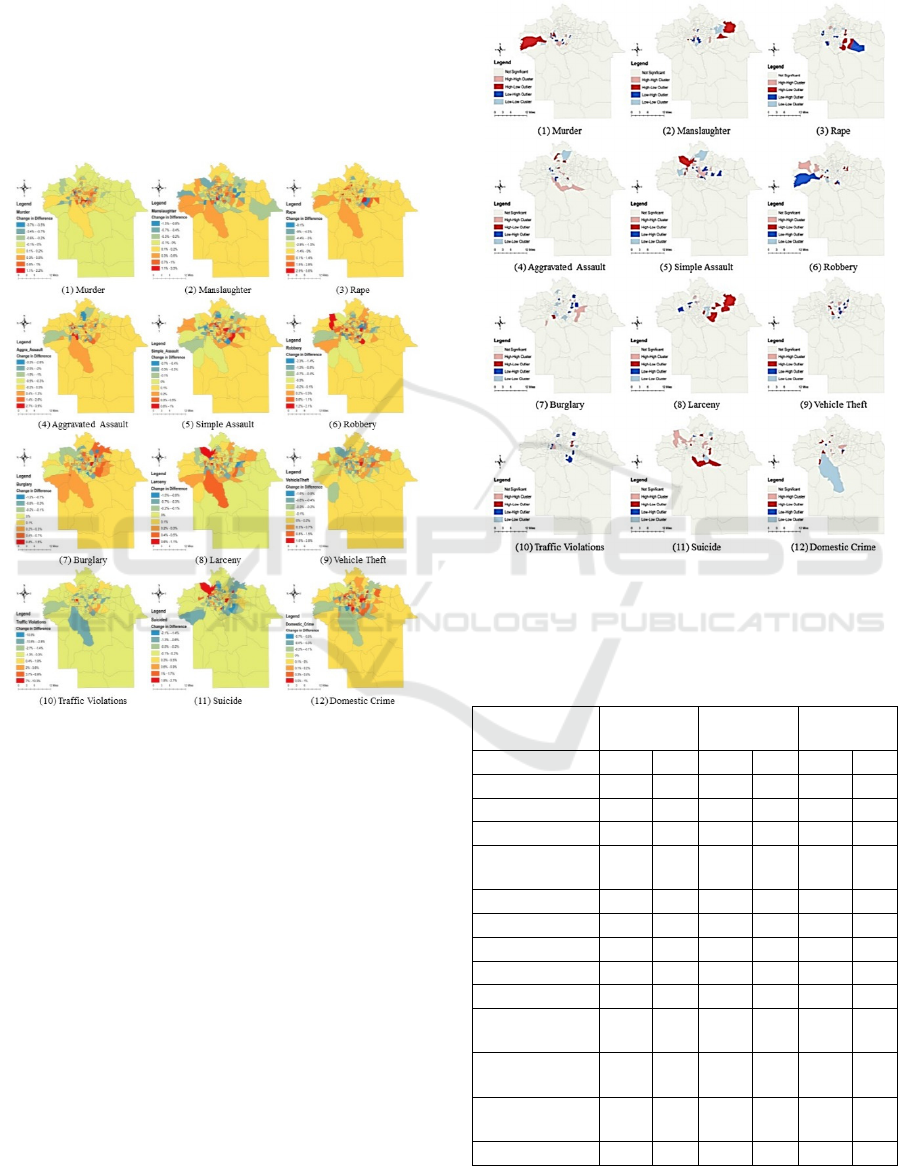
to display the percentage differences in Figure 3.
Figure 3: Differences in the percentages between 2020 and
2019 of different crimes’ spatial distributions based on the
spatial unit when SPPT results are significant.
There is an aggregation region of simple assault,
suicide, domestic crime in the eastern business
district. The aggregation regions of simple assault and
domestic display much growth in crimes in 2020
compared with 2019, and suicide shows a decline in
crimes in 2020 compared with 2019. These results
indicated a significant difference in the spatial pattern
of crimes during the pandemic, and the differences in
space are mainly reflected on the microscopic scale.
The local Moran’s I result displays different
clusters (including high-high clusters, low-low
clusters, low-high spatial outliers, and high-low
spatial outliers). In Figure 4, there are high-high
clusters of simple assault, burglary, and vehicle theft
in east-central Montgomery. We also found that
suicide contains high-high clusters in western
Montgomery. The high-low spatial outliers
representing the higher level of this region than
surrounding areas should be noted.
Figure 4: The local Moran’s I for theft, battery, burglary,
and fraud.
Table 4: RMSE scores for evaluating the performance of
predicting the number of all individual crime types by
utilizing the confirmed cases or/and deaths in Montgomery.
Combined
Cases
Confirmed
Cases Onl
y
Deaths Only
SVR LR SVR LR SVR LR
Murder 3.73 3.59 3.78 3.6 3.73 3.6
Manslau
g
hter 1.29 1.29 1.29 1.28 1.29 1.3
Ra
p
e 0.44 0.44 0.44 0.44 0.44 0.44
Aggravated
Assault
0.68 0.66 0.68 0.66 0.68 0.65
Sim
p
le Assault 3.42 3.43 3.41 3.44 3.44 3.43
Robber
y
1.63 1.57 1.63 1.57 1.63 1.57
Bur
g
lar
y
4.96 5.02 4.95 5.02 4.91 5.03
Larcen
y
3.61 3.61 3.61 3.62 3.61 3.61
Vehicle theft 1.77 1.74 1.71 1.74 1.88 1.77
Domestic
Crime
5.05 5.1 5.07 5.15 5 5.08
Suicided-
related Crime
0.98 0.97 0.97 0.97 0.98 0.98
Traffic
Violations
1.19 1.11 1.19 1.12 1.19 1.11
Others 4.81 4.75 4.81 4.75 4.78 4.62
The Impact of COVID-19 on Crime: A Study from the Spatial-temporal Perspective in the Montgomery County, AL
537

Table 4 illustrates the RMSE scores calculated for
each crime type, such as murder, robbery, rape, and
so forth. We group and count the same crime type
every day in Montgomery from
March 13, 2020 to
March 12, 2021
. Next, we build machine learning
models to predict the number of individual crime
types via using combined cases or/and deaths on a
specific date. The machine learning algorithms SVR
with kernel “Linear” and Linear Regression are also
adopted in this experiment.
5 DISCUSSIONS
The ongoing COVID-19 pandemic has made a
significant impact on people's activities and daily
lives. This study investigated the changes of 12 types
of crime in Montgomery, AL, over one year after the
first COVID-19 confirmed case reported (from
March 13, 2020 to March 12, 2021) based on spatial
and temporal crime analyses.
Compared with one year before the first COVID-
19 confirmed case, the general crime fell by around
8.26% numbers of some specific crime types
increased, such as manslaughter (42.24%), aggravated
assault (38.36%), robbery (18.86%), murder (14.43%),
domestic crime (6.02%), and rape (4.41%). These
results are similar but different from the findings in
existing research. For instance, Yang et al. (2021)
found that total crime fell by 23.7% in Chicago from
February to June in 2020 (with -34.21% in theft, -
29.11% decrease in fraud, -18.97% in the assault, -
18.15% in battery, -7.53% in robbery, -6.54% in
criminal damage, and 3.13% in the burglary). Nivette
et al. (2021) found that overall crime declined by 37%
following stay-at-home restrictions due to COVID-19
in 27 cities across 23 countries in the Americas,
Europe, the Middle East, and Asia.
One of the contributions this study makes is
investigating the impact of COVID-19 on crime from
the spatial perspective. For instance, we grouped
crime cases based on the population density of the
block group. We found that the crime rate in high
populated block groups was significantly higher than
in low populated block groups. However, their
difference became smaller than their difference in the
past years. Meanwhile, when the criminal cases were
grouped by race, we found that the crime rate in the
block groups dominated by Africa America was
significantly higher than that in the white-dominated
block groups. The difference in crime rates between
African America and white-dominated block groups
also narrowed down compared with the rate
difference in the past five years. These results suggest
that the crime rates decreased in different
communities in the COVID-19 pandemic.
Our wavelet analysis results show a 3 to 5-day
periodicity band in the panels of COVID-19
confirmed cases during the holiday season
(November 2020 to January 2021). Moreover, the
number of crime cases leads to the number of
COVID-19 confirmed cases by 1/2 quasi-cycle. This
result suggests that crime rates would increase in a
shorter time than COVID19 confirmed cases when
the social activities increased (such as stay at home
order ended, reopened economy, back-to-school,
presidential election, holidays). It might be possible
that when the social activities decreased, the virus-
prone environment would be clean. When social
activities resumed, the crime-related actions would
occur immediately, but the virus would take time to
spread in a cleaned environment.
There is an aggregation region of simple assault,
burglary, and vehicle theft in east-central
Montgomery. This location coincides with the
business and shopping mall areas, including famous
shopping malls (e.g., The Shoppers at Eastchase,
Dillard’s, Costco, and Target) and restaurants. It is the
most crowded area in Montgomery and is usually a
hot spot for crimes. As the wave of the COVID-19
pandemic poured in, senior centers, libraries, parks,
and other city services were forced to close.
Moreover, this region contains many commercial
buildings with many employees who began to work
at home during this period. The stay-at-home orders
urged most people to quarantine at home, resulting in
an insufficient flow of visitors here. Previous works
have shown that the contextual characteristics of
different areas would impact some crimes, such as the
fact that the busy streets of the city center can attract
more cases of robbery and theft, and the commercial
land can attract more violence. Unlike these crime
types, the aggregation region of burglaries shows
significant growth, resulting from many closed
business districts and the lack of regulators. The
aggregation region of burglaries suggested that the
police department prevent these crimes from
increasing in this region again in the future.
Through looking into the machine learning
performance in Table 5, the crime trend analysis
reveals the confirmed cases or/and deaths in the
COVID-19 pandemic have noticeable relations with
a few certain crime types, e.g., rape and aggravated
assault. Existing research discovers a rise in sexual
violence during the COVID-19 pandemic in
Bangladesh (Sifat, 2020). Another research study
conducted by Roesch et al., devised violence against
women during pandemic restriction.
ICAART 2022 - 14th International Conference on Agents and Artificial Intelligence
538

6 CONCLUSIONS
In sum, we obtained the following conclusions: 1)
The overall crime rate decreased in Montgomery
during the COVID-19 pandemic, but some crimes
were very sensitive to some policies or events during
the pandemic, like the number of manslaughters,
aggravated assault, robbery, and murder; 2) crime
rates would increase in a shorter time compared with
COVID19 confirmed cases when the social activities
increased; 3) spatial distributions of simple assault,
burglary, and vehicle theft had clustered in
Montgomery business and shopping areas. These
conclusions are significant for preventing and
controlling crimes when the second wave of the
COVID-19 outbreak in Montgomery, such as which
types of crimes should be focused on, and which
regions should be concerned with crime.
REFERENCES
Abrams, D. S. (2021). COVID and crime: An early
empirical look. Journal of Public Economics, 194,
104344.
Andresen, M. A. (2009). Testing for similarity in area-
based spatial patterns: A nonparametric Monte Carlo
approach. Applied Geography, 29(3), 333-345.
Andresen, M. A., Linning, S. J., & Malleson, N. (2017).
Crime at places and spatial concentrations: Exploring
the spatial stability of property crime in Vancouver BC,
2003–2013. Journal of quantitative criminology, 33(2),
255-275.
Boman, J. H., & Mowen, T. J. (2021). Global crime trends
during COVID-19. Nature Human Behaviour, 5(7),
821-822.
Halford, E., Dixon, A., Farrell, G., Malleson, N., & Tilley,
N. (2020). Crime and coronavirus: social distancing,
lockdown, and the mobility elasticity of crime. Crime
Science, 9(1), 1-12.
Koh, D. (2020). COVID-19 lockdowns throughout the
world. Occupational Medicine, 70(5), 322-322.
Mohler, G., Bertozzi, A. L., Carter, J., Short, M. B., Sledge,
D., Tita, G. E., Brantingham, P. J. (2020). Impact of
social distancing during COVID-19 pandemic on crime
in Los Angeles and Indianapolis. Journal of Criminal
Justice, 68, 101692.
Piquero, A. R., Jennings, W. G., Jemison, E., Kaukinen, C.,
& Knaul, F. M. (2021). Domestic violence during the
COVID-19 pandemic - Evidence from a systematic
review and meta-analysis. Journal of Criminal Justice,
74, 101806.
Roesch, E., Amin, A., Gupta, J., & García-Moreno, C.
(2020). Violence against women during covid-19
pandemic restrictions. In (Vol. 369): British Medical
Journal Publishing Group.
Sifat, R. I. (2020). Sexual violence against women in
Bangladesh during the COVID-19 pandemic. Asian
journal of psychiatry, 54, 102455.
Thaipisutikul, T., Tuarob, S., Pongpaichet, S.,
Amornvatcharapong, A., & Shih, T. K. (2021).
Automated Classification of Criminal and Violent
Activities in Thailand from Online News Articles. Paper
presented at the 2021 13th International Conference on
Knowledge and Smart Technology.
Wheeler, A. P., Steenbeek, W., & Andresen, M. A. (2018).
Testing for similarity in area‐based spatial patterns:
Alternative methods to Andresen's spatial point pattern
test. Transactions in GIS, 22(3), 760-774.
Wu, C. Y. H., & Loo, B. P. Y. (2017). Changes in novice
motorcyclist safety in Hong Kong after the
probationary driving license scheme. Transportmetrica
A: Transport Science, 13(5), 435-448.
Yang, M., Chen, Z., Zhou, M., Liang, X., & Bai, Z. (2021).
The Impact of COVID-19 on Crime: A Spatial
Temporal Analysis in Chicago. ISPRS International
Journal of Geo-Information, 10(3), 152.
The Impact of COVID-19 on Crime: A Study from the Spatial-temporal Perspective in the Montgomery County, AL
539
