
Ensemble of Patches for COVID-19 X-Ray Image Classification
Thiago Dong Chen, Gabriel Bianchin de Oliveira and Zanoni Dias
Institute of Computing, University of Campinas, Campinas, SP, Brazil
Keywords:
COVID-19, Deep Learning, X-Ray Images Classification.
Abstract:
With the COVID-19 pandemic, several efforts have been made to develop quick and effective diagnoses to
assist health professionals in decision-making. In this work, we employed convolutional neural networks to
classify chest radiographic images of patients between normal, pneumonia, and COVID-19. We evaluated the
division of the images into patches, followed by the ensemble between the specialist networks in each of the
image’s parts. As a result, our classifier reached 90.67% in the test, surpassing another method in the literature.
1 INTRODUCTION
The new Sars-CoV-2 coronavirus, also known as
COVID-19, first discovered in Wuhan (China) in
2019, is a virus capable of producing a dangerous
infection and can place high pressure on the health-
care system with the need for several hospital beds
in hospitals for the recovery of the infected. In
March 2020, the World Health Organization (WHO)
declared COVID-19 a pandemic, pointing to more
than 118,000 cases of coronavirus disease in more
than 110 countries and territories around the world
and the sustained risk of further spread global (World
Health Organization, 2020). Since this statement,
there have been drastic changes in the way we live
concerning health (Coelho et al., 2020), psycho-social
issues (Dubey et al., 2020) and economic (Ozili and
Arun, 2020).
With the increase in cases of COVID-19 since its
discovery, major impacts on public and private health
systems have been taking place, such as the lack
of hospital beds and respirators, as well as the lack
of RT-PCR tests (Real-Time Reverse-Transcription
Polymerase Chain Reaction) (Gibson et al., 1996),
which is the most common method to test for poten-
tial infected. Even with the RT-PCR method, some
cases of false positives and false negatives can hap-
pen (Tahamtan and Ardebili, 2020), requiring the
evaluation of radiographs and CT scans by special-
ists, which achieves high rates of effectiveness (Bai
et al., 2020; Feng et al., 2020).
X-ray images taken by radiologists have visual
characteristics that provide initial indications that
the person may be infected with the disease, and
these characteristics are usually noticed by special-
ized physicians. Due to the need to analyze a large
number of patient images and the time required for
each expert analysis, several efforts have been made
to develop efficient and effective methods for the di-
agnosis of COVID-19.
Driven by their effectiveness in analyzing medical
images (Ronneberger et al., 2015; Sato et al., 2020;
Teixeira et al., 2020; Zhou et al., 2017), convolutional
networks have been seen as a possible alternative to
automatically diagnose patients with COVID-19 from
chest X-rays (Oliveira et al., 2020).
Some works in the literature deal with the prob-
lem of classification of medical images with machine
learning and deep learning techniques. Oliveira et
al. (Oliveira et al., 2020) performed a comparison be-
tween different convolutional network architectures,
such as ResNet’s, EfficientNet’s, MobileNet’s, and
DenseNet’s, traditional machine learning classifica-
tion methods, such as Random Forest, XGBoost,
Support Vector Machine (SVM), logistic regression
and SVM-Linear, and ensemble techniques, reaching
93.0% in the test set in COVIDx database, version 3.
Barstugan et al. (Barstugan et al., 2020) developed
a COVID computed tomography (CT) image classi-
fier using convolutional networks analyzing patches
in different sizes. The extracted characteristics were
classified in the SVM model, reaching an accuracy of
98.77% in a database with 150 computed tomogra-
phy (CT) images. Amyar et al. (Amyar et al., 2020)
also performed CT image analysis, however, based on
multi-task deep machine learning for COVID-19 and
pneumonia, performing both segmentation and classi-
fication, obtaining an accuracy of 94.67% in the clas-
sification task.
With the recent success of patching images (Doso-
vitskiy et al., 2020), in this work, we evaluate the
division of X-ray images into nine patches, with
Chen, T., Oliveira, G. and Dias, Z.
Ensemble of Patches for COVID-19 X-Ray Image Classification.
DOI: 10.5220/0010864500003116
In Proceedings of the 14th International Conference on Agents and Artificial Intelligence (ICAART 2022) - Volume 3, pages 561-567
ISBN: 978-989-758-547-0; ISSN: 2184-433X
Copyright
c
2022 by SCITEPRESS – Science and Technology Publications, Lda. All rights reserved
561
one specialist convolutional neural network for each
patch. After the prediction of each specialist net-
work, we make the ensemble between them. As a
result, our method achieved 90.67% of balanced ac-
curacy on the test set, surpassing the classifier devel-
oped by Oliveira et al. (Oliveira et al., 2020) applied
on COVIDx (Wang et al., 2020a), version 7.
The rest of the text is organized as follows. In
Section 2, we detail the database applied in this work.
In Section 3, we describe the proposed method and
the evaluation metric used. In Section 4, we present
and discuss the experimental results achieved by our
method. In Section 5, we describe the conclusions
and possible lines for future work.
2 DATASET
For this work, we used the COVIDx (Wang et al.,
2020a) dataset, which is a combination of multi-
ple public database repositories, with images rang-
ing from 157 x 156 resolution to 5623 x 4757. The
databases that make up COVIDx are listed below:
• COVID-19 Image Data Collection, COVID-19
Chest X-ray Dataset Initiative (Cohen et al.,
2020);
• ActualMed COVID-19 Chest X-ray Dataset Ini-
tiative (Wang et al., 2020b);
• RSNA Pneumonia Detection Challenge
dataset (Radiological Society of North America,
2019);
• COVID-19 radiography database (Chowdhury
et al., 2020; Rahman et al., 2021).
As the COVID-19 X-ray image classification task
is a problem of worldwide interest and new radio-
graphs are made every day, the bases that make up
COVIDx are constantly updated, adding new images
in short periods. Therefore, we chose to use version
7, the latest available in March 2021.
The data set has 15,411 X-ray images, extracted
from the thoracic part of the patients, and, for each
one of the patients, there may be more than one im-
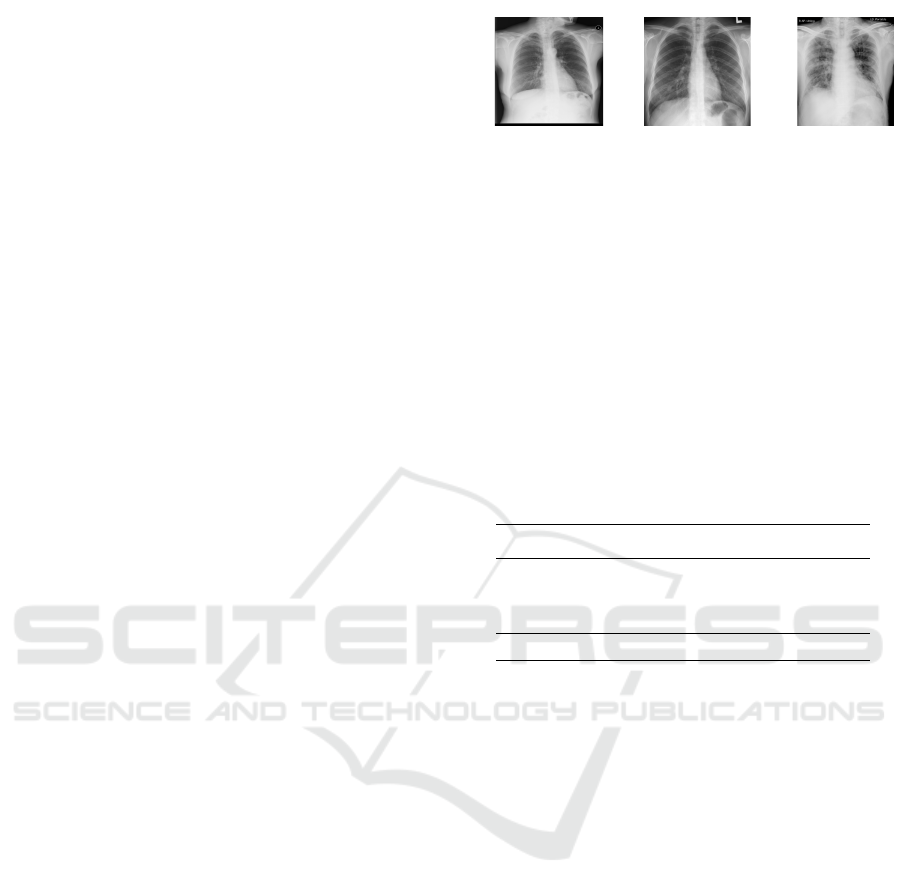
age. Each X-ray image belongs to one of three pos-
sible classes: normal, pneumonia, and COVID. Fig-
ure 1 presents example image of each classes.
To divide the data into training, validation, and
testing, we applied the same approach indicated in the
original repository, i.e., we separated the 300 images
designated as test set by the dataset, with 100 images
of each one of the classes, and 15,111 remaining for
training and validation. These 15,111 remaining im-
ages are from different patients from the test set, i.e.
(a) (b) (c)
Figure 1: Example of X-ray image of each class: (a) Nor-
mal, (b) Pneumonia, and (c) COVID-19.
there are no images from the same patient into the test
set and the 15,111 remaining images.
From the remaining 15,111 images, we divided
the patients, ensuring that there were no images of
the same patient in training and validation sets. To
perform the division, we separated 75% of patients in
training and 25% in validation. Regarding the images,
the proportion was equal to 74.9% for the training set
and 25.1% for the validation set, as shown in Table 1.
Table 1: Number of X-ray images on train, validation and
test sets.
Class
Train
Validation
Test
Normal 5,983 1,983 100
Pneumonia 4,123 1,352 100
COVID-19 1,212 458 100
Total
11,318 3,793 300
3 METHODOLOGY
In this section, we describe the steps of the method
used for multi-class classification using machine
learning techniques. The section is subdivided into
preprocessing steps, classification models, and evalu-
ation metric.
3.1 Preprocessing Steps
As the images in the database vary in size, we re-
sized all the data to a dimension of 224 x 224 for the
experiments. In addition, we shuffled the data from
the training and validation sets to prevent the machine
learning model from being biased to some pattern in
the ordering of images. Then, we used the prepro-
cessing function indicated for each of the networks
pre-trained.
3.1.1 Patches
To evaluate specific regions of the images, we made
square cuts with sizes corresponding to 25% of the
ICAART 2022 - 14th International Conference on Agents and Artificial Intelligence
562
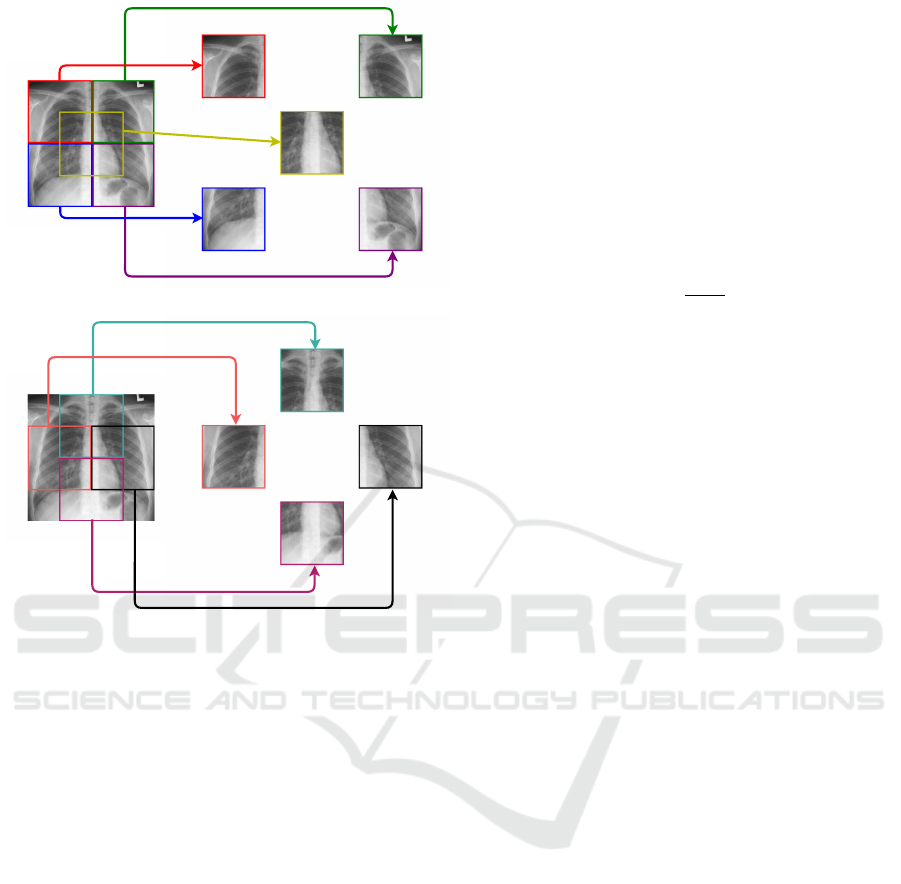
(a)
(b)
Figure 2: Representation of patches in the quadrants: (a)
top left, top right, bottom left, bottom right, and central. (b)
left, right, top, and bottom.
original X-ray (half of the height and half of the
width).
We divided each original image into nine regions,
or patches, using the four quadrants of the original im-
age, the central region of the image, which has parts
of the four quadrants (these five representations are
shown in Figure 2a), plus four more regions, created
from the intersections between two adjacent quad-
rants (represented in Figure 2b).
During the experiments, we will refer to the four
quadrants as upper left, upper right, lower left, and
lower right. For the central region of the image, we
will use the term central, while for the intersections
between the quadrants, we will employ top, bottom,
left, and right terms.
3.1.2 Class Weights
As the training set in the COVIDx database is unbal-
anced, that is, it does not have the same amount of
data for all classes, the most frequent class can bias
the training according to the distribution of the data.
To reduce this phenomenon, we applied class
weights during training, weighting the error function
according to the frequency of samples, making the
network “pay more attention” to classes with fewer
samples.
To assign weights to each of the classes, we ap-
plied Equation 1, where D
max
represents the amount
of data from the most frequent class and D
i
represents
the amount of data from the i class. By Equation 1,
the most frequent class received the weight equal to
1, while the other classes received greater weights.
P
i
=
D
max
D
i
(1)
3.2 Classification Models
In order to make the classification of the X-ray im-
ages, we used convolutional neural networks. Fig-
ure 3 shows an overview of the methodology applied
to classify lung X-ray images, which consists of pre-
processing the images and then training the model.
After this training step, the model predicts the image
into the normal, pneumonia, or COVID-19 class. In
this work, we run several experiments to compare the
performance of the models with different ensemble
techniques. All experiments use stochastic gradient
descent as optimizer.
With the success of ResNet50 (He et al., 2016) for
lung X-ray image classification (Oliveira et al., 2020),
we opted by using this convolutional network for this
task. After the preprocessing step, we trained one
ResNet50 network for each specific patch of the im-
age. For each convolutional network, we fine-tuned
the weights starting from the pre-trained network on
ImageNet (Krizhevsky et al., 2012).
After, we evaluated different ensemble techniques
for the complete analysis of the lung radiographic im-
ages, which consists of the combination of all the spe-
cific predictions of different patches of the image.
We performed three types of ensembles from the
results of different layers. In the first experiment,
we combined the output probabilities of each class of
each of the specific models to make the final predic-
tion. In the second experiment, we used the results of
the layer before the output layer to carry out the en-
semble, which we called deep features, to make the
ensemble. In the last experiment, we employed the
output prediction of the models to make two voting
systems, one using the average of the probabilities of
each class by all model, which we called soft vot-
ing, and another using the classes predicted by each
model, which we call the hard voting.
In the case of the first and the second experi-
ments using ensemble techniques, we applied meta-
Ensemble of Patches for COVID-19 X-Ray Image Classification
563
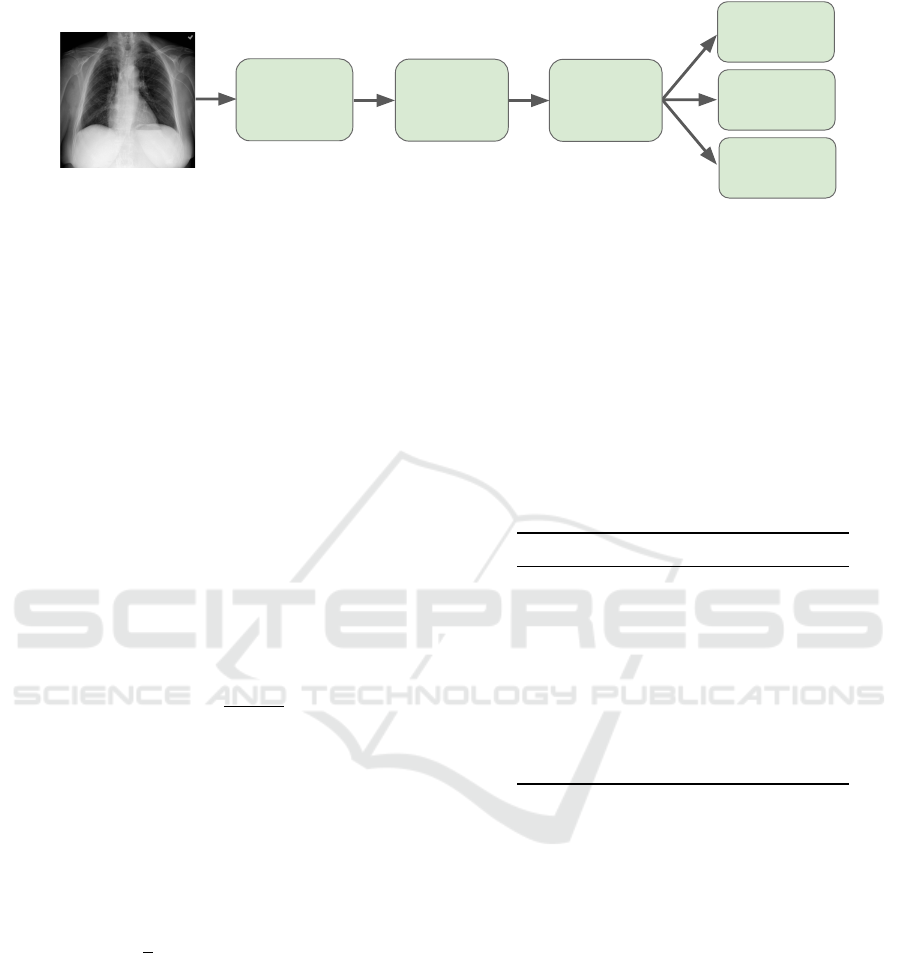
Imagem
Raio X
Normal
Pneumonia
COVID-19
Preprocessing
Prediction
Training
Figure 3: The methodology applied for the classification of lung X-ray images.
classifiers to make the ensemble. Each meta-classifier
receives the probabilities or deep features of the nine
convolutional networks as input, and it predicts the
class between normal, pneumonia, and COVID-19.
For the meta-classifiers, we evaluated multi-layer per-
ceptrons with a different number of fully connected
layers, varying from one up to three.
3.3 Evaluation Metric
For binary classification problems, recall is the frac-
tion of true positive elements divided by the total
number of positively classified units, described in
Equation 2, where T
p
is the number of true positives
and F
p
is the number of false positives. True values
refer to samples that the model correctly predicted,
while false values are those that were incorrectly pre-
dicted.
Recall =
T
p
T
p
+ F
p
(2)
In this work, we evaluated the results using the
balanced accuracy score, due to that it prevents the
result of the predictions of classes with more samples
to predominate, in cases where the dataset is unbal-
anced. The balanced accuracy is essentially the av-
erage of the recall values for each class, described in
Equation 3.
Balanced Acc. =
1
3
×
∑
i∈{Normal,Pneumonia,COV ID}
Recall
i
(3)
4 RESULTS AND DISCUSSION
In this section, we present and discuss the results ob-
tained by our method. We start by choosing the best
ensemble technique on the validation set, then we
evaluate our method on the test set, apply an expli-
cability technique, and compare our results with the
literature.
4.1 Patches
In the first experiment, we evaluated the classification
of each patch of the images. Each patch was trained
by one specific ResNet50. Table 2 shows the results
achieved using each patch, indicating that the region
that obtained the best validation accuracy was the cen-
tral patch, which could happen because of the way the
X-ray image is taken, where the lung is centered.
Table 2: Balanced accuracy in the validation set with differ-
ent patches.
Patch
Balanced Accuracy (%)
Central 91.70
Lower left 91.08
Bottom 91.02
Upper left 90.41
Lower right 90.30
Left 90.00
Top 89.76
Upper right 89.65
Right 88.15
4.2 Ensemble
After the experiments considering each of the patches,
we performed the ensemble between them. Table 3
shows the results of each of the ensemble techniques
used, indicating higher values of balanced accuracy
for all ensemble methods compared to the fine-tuned
ResNet50 network on ImageNet and with each of
them individually.
Between the ensemble techniques, the best re-
sults were achieved by multi-layer perceptron meta-
classifier using deep features as input and with three
fully connected layers (FCL), which obtained 93.60%
of balanced accuracy on the validation set.
4.3 Evaluation on Test
We found our best model found on validation data,
which consists of the ResNet50 architecture with
ICAART 2022 - 14th International Conference on Agents and Artificial Intelligence
564
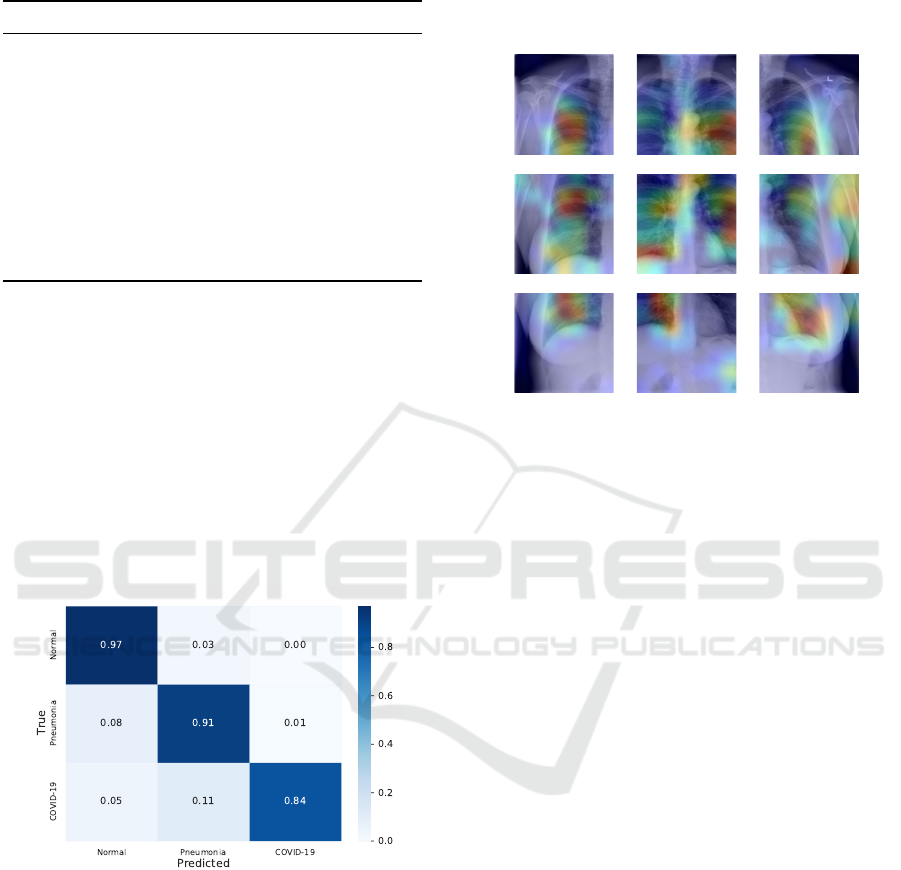
Table 3: Balanced accuracy in the validation set with differ-
ent ensemble techniques.
Method
Balanced Accuracy (%)
Probabilities
ResNet50 with 1 FCL 92.87
ResNet50 with 2 FCL 92.39
ResNet50 with 3 FCL 92.19
Deep Features
ResNet50 with 1 FCL 93.46
ResNet50 with 2 FCL 93.30
ResNet50 with 3 FCL
93.60
Voting
Soft 92.75
Hard 92.76
three fully connected layers using the deep features
as input. As a result, we obtained a balanced accu-
racy score of 90.67% on the test set. This result is
slightly lower than the validation accuracy, an accept-
able difference meaning that the model manages to
generalize adequately.
Then, we analyzed the confusion matrix of the
predictions on the test set (Figure 4). The matrix
shows that the model obtained good results for all the
classes, especially for the normal class. The main er-
rors occurred in the COVID-19 class, where 11% of
the images were predicted as pneumonia and 5% of
the images were predicted as normal.
Figure 4: Confusion matrix of our model in the test set.
4.4 Grad-CAM
Grad-CAM (Selvaraju et al., 2017) is a tool that cre-
ates a heatmap indicating where CNN is “paying most
attention” in the image. To better understand our
model, we used Grad-CAM to identify whether the
classifier is learning in specific regions in the lungs or
if some noise of it X-ray artifact is biasing the model.
Figure 5 shows the Grad-CAM applied to an ex-
ample input from our test set, using our final model.
We can see that the most focused regions are mainly
parts of the lung. It is also worth noting that a consid-
erable amount of the images have letters written on
the X-ray (this artifact can be seen in the upper right
corner of our example, where it has an “L” written on
it), however our model managed to ignore the letter.
Figure 5: Grad-CAM of the nine patches from an X-ray
example on our model. Warmer colors represent greater ac-
tivation of convolutional network weights.
4.5 Comparison with Literature
To compare our results with the literature, we applied
the methodology of Oliveira et al. (Oliveira et al.,
2020) using the database of this project. We opted
for this because there are no works that report results
in this version of the COVIDx base, mainly because
of its quick update.
With that, this methodology achieved an accu-
racy of 84.00% in the test set of COVIDx, version 7.
Our method reached 6.67 percentage points above this
method. Therefore, we conclude that performing the
ensemble of the specialist networks in the patches pre-
dicts better than using the ensemble with different ar-
chitectures analyzing the complete image, as the pro-
posed method in Oliveira et al. (Oliveira et al., 2020).
5 CONCLUSIONS AND FUTURE
WORKS
The pressure on the healthcare system caused by
COVID-19 is one of the pandemic’s greatest impacts.
Those infected need immediate care and treatment.
In addition, the prolonged period of the pandemic
that people are experiencing exposes the generalized
physical, mental and emotional exhaustion suffered
by health professionals. Thus, it is necessary to in-
clude diagnostic methods that are efficient in helping
health professionals.
Ensemble of Patches for COVID-19 X-Ray Image Classification
565

In this work, we evaluated patching images to
improve the results on the classification of lung X-
ray images into normal, pneumonia, and COVID-19
classes. Our classification model, which consists of
performing an ensemble of the expert models of each
patch, presented an accuracy of 90.67% in the test set,
allowing us to help in the task of classifying the X-ray
images between COVID-19, pneumonia, and normal.
The results obtained by our method surpassed the re-
sults achieved by another method in the literature ap-
plied on COVIDx, version 7.
As future works, the evaluation of more prepro-
cessing steps, as data augmentation, as well as dif-
ferent ensemble techniques, can help the model to
achieve better results.
ACKNOWLEDGEMENTS
This research was supported by s
˜
ao Paulo Research
Foundation (FAPESP) [grant numbers 2015/11937-
9 and 2017/12646-3] and the National Council for
Scientific and Technological Development (CNPq)
[grant numbers 161015/2021-2 and 304380/2018-0].
REFERENCES
Amyar, A., Modzelewski, R., Li, H., and Ruan, S. (2020).
Multi-task deep learning based CT imaging analysis
for COVID-19 pneumonia: Classification and seg-
mentation. Computers in Biology and Medicine,
126:104037.
Bai, H. X., Hsieh, B., Xiong, Z., Halsey, K., Choi, J. W.,
Tran, T. M. L., Pan, I., Shi, L.-B., Wang, D.-C., Mei,
J., Jiang, X.-L., Zeng, Q.-H., Egglin, T. K., Hu, P.-
F., Agarwal, S., Xie, F.-F., Li, S., Healey, T., Ata-
lay, M. K., and Liao, W.-H. (2020). Performance
of radiologists in differentiating COVID-19 from non-
COVID-19 viral pneumonia at chest CT. Radiology,
296(2):E46–E54.
Barstugan, M., Ozkaya, U., and Ozturk, S. (2020). Coro-
navirus (COVID-19) Classification using CT Images
by Machine Learning Methods. arXiv:2003.09424,
pages 1–10.
Chowdhury, M. E., Rahman, T., Khandakar, A., Mazhar,
R., Kadir, M. A., Mahbub, Z. B., Islam, K. R., Khan,
M. S., Iqbal, A., Al Emadi, N., Reaz, M. B. I., and
Islam, M. T. (2020). Can AI help in screening viral
and COVID-19 pneumonia? IEEE Access, 8:132665–
132676.
Coelho, F. C., Lana, R. M., Cruz, O. G., Codeco, C. T., Vil-
lela, D., Bastos, L. S., y Piontti, A. P., Davis, J. T.,
Vespignani, A., and Gomes, M. F. (2020). Assess-
ing the potential impacts of COVID-19 in Brasil: Mo-
bility, Morbidity and Impact to the Health System.
medRxiv, pages 1–14.
Cohen, J. P., Morrison, P., and Dao, L. (2020). COVID-19
Image Data Collection. arXiv:2003.11597, pages 1–4.
Dosovitskiy, A., Beyer, L., Kolesnikov, A., Weissenborn,
D., Zhai, X., Unterthiner, T., Dehghani, M., Min-
derer, M., Heigold, G., Gelly, S., and Uszkoreit, Jakob
abd Houlsby, N. (2020). An image is worth 16x16
words: Transformers for image recognition at scale.
arXiv:2010.11929, pages 1–22.
Dubey, S., Biswas, P., Ghosh, R., Chatterjee, S., Dubey,
M. J., Chatterjee, S., Lahiri, D., and Lavie, C. J.
(2020). Psychosocial impact of COVID-19. Dia-
betes & Metabolic Syndrome: Clinical Research &
Reviews, 14(5):779–788.
Feng, H., Liu, Y., Lv, M., and Zhong, J. (2020). A case
report of COVID-19 with false negative RT-PCR test:
necessity of chest CT. Japanese Journal of Radiology,
38(5):409–410.
Gibson, U. E., Heid, C. A., and Williams, P. M. (1996).
A novel method for real time quantitative RT-PCR.
Genome Research, 6(10):995–1001.
He, K., Zhang, X., Ren, S., and Sun, J. (2016). Deep
residual learning for image recognition. In Conference
on Computer Vision and Pattern Recognition (CVPR),
pages 770–778. IEEE.
Krizhevsky, A., Sutskever, I., and Hinton, G. E. (2012).
ImageNet classification with deep convolutional neu-
ral networks. In Advances in Neural Information
Processing Systems (NIPS), pages 1097–1105. Curran
Associates, Inc.
Oliveira, G., Padilha, R., Dorte, A., Cereda, L., Miyazaki,
L., Lopes, M., and Dias, Z. (2020). COVID-19 X-
ray Image Diagnostic with Deep Neural Networks. In
2020 Brazilian Symposium on Bioinformatics (BSB),
pages 57–68. Springer.
Ozili, P. K. and Arun, T. (2020). Spillover of COVID-19:
impact on the Global Economy. SSRN, pages 1–27.
Radiological Society of North America (2019). RSNA
pneumonia detection challenge. https://www.kaggle.
com/c/rsna-pneumonia-detection-challenge.
Rahman, T., Khandakar, A., Qiblawey, Y., Tahir, A., Ki-
ranyaz, S., Abul Kashem, S. B., Islam, M. T., Al
Maadeed, S., Zughaier, S. M., Khan, M. S., and
Chowdhury, M. E. (2021). Exploring the effect of im-
age enhancement techniques on COVID-19 detection
using chest X-ray images. Computers in Biology and
Medicine, 132:104319.
Ronneberger, O., Fischer, P., and Brox, T. (2015). U-
Net: Convolutional networks for biomedical image
segmentation. In 18th International Conference on
Medical Image Computing and Computer-Assisted In-
tervention (MICCAI), pages 234–241. Springer.
Sato, G. T. S., da Silva Segundo, L. B., and Dias, Z. (2020).
Classification of musculoskeletal abnormalities with
convolutional neural networks. In 2020 Brazilian
Symposium on Bioinformatics (BSB), pages 69–80.
Springer.
Selvaraju, R. R., Cogswell, M., Das, A., Vedantam, R.,
Parikh, D., and Batra, D. (2017). Grad-CAM: Vi-
sual explanations from deep networks via gradient-
ICAART 2022 - 14th International Conference on Agents and Artificial Intelligence
566

based localization. In 2017 International Conference
on Computer Vision (ICCV), pages 618–626.
Tahamtan, A. and Ardebili, A. (2020). Real-time RT-PCR
in COVID-19 detection: issues affecting the results.
Expert Review of Molecular Diagnostics, 20(5):453–
454.
Teixeira, V., Braz, L., Pedrini, H., and Dias, Z. (2020). Du-
aLAnet: Dual Lesion Attention Network for Thoracic
Disease Classification in Chest X-Rays. In 27th Inter-
national Conference on Systems, Signals and Image
Processing (IWSSIP), pages 69–74. IEEE.
Wang, L., Lin, Z. Q., and Wong, A. (2020a). COVID-Net: a
tailored deep convolutional neural network design for
detection of COVID-19 cases from chest X-ray im-
ages. Scientific Reports, 10(1):1–12.
Wang, L., Wong, A., Lin, Z. Q., McInnis, P., Chung,
A., and Gunraj, H. (2020b). Actualmed COVID-
19 chest X-ray data initiative. https://github.com/
agchung/Actualmed-COVID-chestxray-dataset.
World Health Organization (2020). WHO Director-
General’s opening remarks at the media briefing
on COVID-19. https://www.who.int/director-
general/speeches/detail/who-director-general-s-
opening-remarks-at-the-media-briefing-on-covid-
19---11-march-2020.
Zhou, Z., Shin, J., Zhang, L., Gurudu, S., Gotway, M.,
and Liang, J. (2017). Fine-tuning convolutional neural
networks for biomedical image analysis: actively and
incrementally. In Conference on Computer Vision and
Pattern Recognition (CVPR), pages 7340–7351.
Ensemble of Patches for COVID-19 X-Ray Image Classification
567
