
Evaluation of Deep Learning based 3D-Point-Cloud Processing
Techniques for Semantic Segmentation of Neuromorphic Vision Sensor
Event-Streams
Tobias Bolten
1
, Felix Lentzen
1
, Regina Pohle-Fr
¨
ohlich
1
and Klaus D. T
¨
onnies
2
1
Institute of Pattern Recognition, Niederrhein University of Applied Sciences, Reinarzstr. 49, Krefeld, Germany
2
Department of Simulation and Graphics, University of Magdeburg, Universit
¨
atsplatz 2, Magdeburg, Germany
Keywords:
Semantic Segmentation, 3D Space-time Event Cloud, PointNet++, Dynamic Vision Sensor.
Abstract:
Dynamic Vision Sensors are neuromorphic inspired cameras with pixels that operate independently and asyn-
chronously from each other triggered by illumination changes within the scene. The output of these sensors
is a stream with a sparse spatial but high temporal representation of triggered events occurring at a variable
rate. Many prior approaches convert the stream into other representations, such as classic 2D frames, to adapt
known computer vision techniques. However, the sensor output is natively and directly interpretable as a 3D
space-time event cloud without this lossy conversion. Therefore, we propose the processing utilizing 3D point
cloud approaches.
We provide an evaluation of different deep neural network structures for semantic segmentation of these 3D
space-time point clouds, based on PointNet++(Qi et al., 2017b) and three published successor variants. This
evaluation on a publicly available dataset includes experiments in terms of different data preprocessing, the
optimization of network meta-parameters and a comparison to the results obtained by a 2D frame-conversion
based CNN-baseline. In summary, the 3D-based processing achieves better results in terms of quality, network
size and required runtime.
1 INTRODUCTION
Dynamic Vision Sensors (DVS) are biologically-
inspired chips, originating from the research field of
neuromorphic engineering, that have a fundamentally
different output paradigm compared to classical im-
agers. These classical CCD or CMOS sensors are typ-
ically operating at a fixed output speed (frames per
second) independent of the captured scene. In con-
trast, a DVS which is also called silicon retina, cap-
tures the scene in terms of changes rather than record-
ing the entire scene at regular intervals.
The pixels of a DVS work independently and
asynchronously from each other and are triggered
by local brightness changes above a defined thresh-
old (Gallego et al., 2020). This leads to a data-
driven output at a highly variable datarate, depend-
ing on the changes in the scene. An activation of one
DVS-pixel is called an “event” and encodes its posi-
tion in the pixel array (x, y), a highly accurate times-
tamp of triggering t and the polarity p indicating the
sign of brightness change. Dynamic Vision Sensors
offer several positive features compared to conven-
tional cameras, such as high temporal resolution, high
dynamic range, low power consumption and a non-
redundant output (Gallego et al., 2020). These sensor
properties provide an interesting opportunity to use
DVSs in outdoor measurement scenarios.
In this work, we address the challenges arising for
the generation of an event-wise semantic segmenta-
tion for DVS sensor data based on recordings in such
an outdoor scenario. For this purpose, the publicly
available DVS-OUTLAB (Bolten et al., 2021) dataset
is utilized. This dataset contains recordings of a long-
time monitoring of an urban public area including
multi-class labels. The data is challenging as it in-
cludes objects at different scales and artifacts due to
sensor noise and environmental influences.
The DVS output paradigm leads to the fact that
long-established computer vision methods are not di-
rectly applicable to the provided event stream. To
avoid the common conversion of the event stream
into classical 2D frames, we propose analogously to
(Wang et al., 2019) the use of 3D point cloud based
deep learning networks. We do this on the belief that
frame encodings only insufficiently preserve the in-
168
Bolten, T., Lentzen, F., Pohle-Fröhlich, R. and Tönnies, K.
Evaluation of Deep Learning based 3D-Point-Cloud Processing Techniques for Semantic Segmentation of Neuromorphic Vision Sensor Event-streams.
DOI: 10.5220/0010864700003124
In Proceedings of the 17th International Joint Conference on Computer Vision, Imaging and Computer Graphics Theory and Applications (VISIGRAPP 2022) - Volume 4: VISAPP, pages
168-179
ISBN: 978-989-758-555-5; ISSN: 2184-4321
Copyright
c
2022 by SCITEPRESS – Science and Technology Publications, Lda. All rights reserved

herent sensor properties. We summarize our main
contributions, extending previous work like (Wang
et al., 2019), as follows:
• analytical and quantitative comparison of differ-
ent input and network parameters for a 3D Point-
Net++ (Qi et al., 2017b) based semantic event
stream segmentation
• the extension of this analysis to three enhanced
point cloud based network structures, which try to
improve the plain PointNet++
• the comparison of the achieved results utilizing
these 3D point cloud deep neural network struc-
tures to an event-to-frame based 2D-CNN base-
line in terms of quality and runtime.
Furthermore, the exact network configurations of
the trained models as well as pre-trained weights and
other supplemental material is available at http://dnt.
kr.hsnr.de/DVS-3DSemSeg/ to support further devel-
opments and comparisons.
The rest of this paper is structured as follows.
Section 2 summarizes related work and their concept
of used event encoding. A description of the evalu-
ated network structures follows in Section 3. Section
4 describes the used processing pipelines in detail,
presents the obtained results and provides a compar-
ison of the results. Finally, a short summary is given
in Section 5.
2 RELATED WORK
In many event-based processing applications the
event stream is transformed into alternative represen-
tations (Gallego et al., 2020). Many of these applica-
tions use a conversion of the event stream into clas-
sic 2D frames, as this is a simple way of conversion
that also allows the use of established computer vi-
sion techniques. However, this conversion is gener-
ally also associated with a loss of information (e.g.
the dense time resolution) of the stream. Recently,
there is a tendency towards graph- or point-cloud-
based methods noticeable, which try to minimize this
information loss in the event encoding.
Frame-based Conversion Approaches. Common
techniques for generating frames from DVS event
streams are based on considering (a) a fixed number
of events or (b) the selection of a time window of fixed
length. Depending on the focus of the application,
different encoding rules are used, which try to pre-
serve different aspects of the underlying event stream.
Usually, the frames generated in this way are then an-
alyzed using well-known 2D network structures and
computer vision techniques.
For example, in (Chen et al., 2019a) three dif-
ferent frame encodings are presented, each of which
is intended to represent another characteristic of the
data stream like the event frequency, timestamp in-
formation or time-continuous aspects. These frames,
as well as composited multi-channel combinations of
them, are subsequently processed by a 2D object de-
tection approach. In (Wan et al., 2021) a new frame
encoding called “neighborhood suppression time sur-
face” is introduced to address issues related to ar-
eas with highly different event densities, whereas in
(Jiang et al., 2019) the special DAVIS sensor prop-
erty of being able to record classical intensity im-
ages in combination with derived event-frame encod-
ings is exploited. All approaches mentioned here
are subsequently based on the use of the well known
YOLO (Redmon et al., 2016) based 2D object detec-
tor framework.
In (Damien. et al., 2019) three frames are gen-
erated by accumulating the events in different time
windows with lengths of 40ms, 100ms and 200ms to
be able to detect objects with different speeds. These
frames are subsequently processed in parallel by a
SSD and Faster-RCNN (Ren et al., 2017) based pro-
cessing pipeline.
Graph-based Processing. Using graphs the spatio-
temporal relations between the events can be de-
scribed without leaving the asynchronicity and spar-
sity of the events. In (Zhou et al., 2020), all events are
mapped into an image before the graph is created. The
2D graph derived from the image is then converted
into a 3D graph for further processing. However, this
initialization is very time-consuming. In (Bi et al.,
2020), a 3D graph is built directly. For saving compu-
tation time, the complete event stream is divided into
short temporal sections so that only few events are
considered for the respective graph construction. Dif-
ferent filtering algorithms are used in (Bi et al., 2019;
Chen et al., 2020; Wang et al., 2021) for substantial
event reduction prior to their analysis. Compared to
applications such as gesture or gait classification, our
data contains artifacts from the environment (such as
rain) and the size of objects varied largely. Hence, it
was difficult to decide which events to remove and we
did not consider these approaches further.
Point-cloud based Processing. In contrast to the
previously mentioned approaches, the event stream
can also be considered as an unordered point cloud.
Since each event is described at least by its (x, y) co-
ordinate and the timestamp t, a 3D space-time event
Evaluation of Deep Learning based 3D-Point-Cloud Processing Techniques for Semantic Segmentation of Neuromorphic Vision Sensor
Event-streams
169

cloud is created automatically without any further
processing steps. The dense time information is pre-
served in this interpretation and converted into geo-
metric information. Subsequently, network architec-
tures specifically designed for unordered point clouds
can be used for processing. In (Wang et al., 2019),
PointNet and PointNet++ are first applied on event
streams to classify hand gestures, utilizing a rolling
buffer mechanism to the event stream. The data in the
buffer is then down sampled for classification. A spe-
cial feature is, that previous classification results are
used in deciding the current classification by continu-
ous averaging. In contrast to (Wang et al., 2019), we
use PointNet++ for semantic segmentation. As clas-
sification here occurs at the event level, the idea of the
sliding window cannot be adopted.
3 PROPOSED METHODS
In the following, the basic concepts of the evaluated
3D point cloud networks, as well as the applied 2D-
CNN comparison method are outlined.
PointNet++ Hierarchical feature learning (Qi et al.,
2017b)
PointNet++ builds upon the PointNet (Qi et al.,
2017a) framework by the same authors, which
was the first neural network to be successfully di-
rectly applied to point clouds. First of all, it uses
max-pooling as a symmetric function to make the
network invariant towards input point ordering.
The MLPs used for feature extraction are shared,
resulting in a relatively small network. After ex-
tracting geometric features, an MLP is trained for
either classification or segmentation.
PointNet++ expands the network by hierarchical
processing. It recursively applies Farthest Point
Sampling (FPS) to select representative points to-
gether with small PointNet feature extractors ap-
plied on the local neighborhood of each represen-
tative point (Set Abstraction (SA) Layer), which
helps capturing not only global geometric features
but also neighborhood information. Due to the
consecutive sampling, an interpolation is needed
to produce point-wise features for segmentation
(Feature Propagation (FP) Layer).
The following networks aim to utilize the relation-
ships (e.g. distances, directions) of the points in-
stead of processing each point independently.
A-CNN Annularly Convolutional Neural Network
(Komarichev et al., 2019)
The main concept of A-CNN is to apply a con-
volution to the point clouds, leveraging their re-
lationships. Therefore, a method for ordering the
points is needed. The authors project every point
inside a local neighborhood into an approximated
tangential plane at the representative point. In the
plane, angles can be calculated and used for or-
dering. Then, a one-dimensional convolution can
be applied.
LSANet Feature Learning by Local Spatial Aware
Layers (Chen et al., 2019b)
In LSANet, the process of abstraction and lo-
cal feature learning is accompanied by a paral-
lel branch which learns so called spatial distribu-
tion weights from the coordinates of all points in
a local neighborhood. These implement the con-
cept of attention in neural networks, which means
that some parts of the input are considered to be
more important than others. The attention mask
is multiplied element-wise with the features. In
LSANet, the attention weights are based on the
coordinates, thus on the geometric properties of a
local region, which should enable the network to
better learn details of the structures.
SpiderCNN Parameterized Convolutional Filters
(Xu et al., 2018)
The authors of SpiderCNN do not try to order the
point cloud like in A-CNN. Instead, they adapt the
filter to support unordered input. In classical dis-
crete convolution, only discrete weights for each
position, defined by the kernel size, are needed.
The positions of the neighboring points are not
known in point clouds, so instead of defining dis-
crete weights, a function is used that calculates a
weight based on the coordinates of a point. Dur-
ing the learning phase parameters of the function
generating the weights are learned instead of the
weights themselves. The structure differs from
PointNet++, as the point cloud is not sampled and
therefore no interpolation is needed.
PointNet++ was selected because it represents the
pioneering fundament work for the direct application
of neural networks to point clouds and many other
methods use it as a basis (compare to (Guo et al.,
2021) for a comprehensive method review). The se-
lected further methods were chosen because (a) they
each aim at an improvement compared to the vanilla
PointNet++ and (b) their reference implementations
are also freely available.
Frame-based Baseline as Comparison. As a base-
line comparison of the afore-mentioned 3D point
cloud processing networks we also evaluated a tra-
ditional 2D convolutional neural network (CNN) ap-
proach applied on event-frame encodings generated
VISAPP 2022 - 17th International Conference on Computer Vision Theory and Applications
170
by means of DVS-stream to frame conversion.
For further processing and fair comparison a
pixel-precise labeling is required on these event-
frames (compare to following section 4.3). Estab-
lished state-of-the-art CNN structures such as U-Net
(Ronneberger et al., 2015) or Mask-R-CNN (He et al.,
2017) are well suited methods for generating this se-
mantic frame segmentation.
However, several comparative studies have found
that Mask-R-CNN is able to learn a better and more
robust prediction. This has been shown in medical
image processing, which is the original application
domain of U-Net, as detailed in (Alfaro et al., 2019;
Vuola et al., 2019; Durkee et al., 2021) - but also for
other application domains (Zhao et al., 2018; Quoc
et al., 2020).
Therefore, we utilized a Mask-R-CNN structure
for the performed comparison in this work. The pre-
dicted object masks are subsequently considered on
the level of a semantic segmentation.
4 EXPERIMENTS
We first briefly introduce the dataset used, followed
by a detailed description of the respective 3D or 2D
processing pipelines. This is followed by the quantita-
tive analysis of the obtained results, which is divided
into multiple parts: (a) the optimization of the base
PointNet++ network in terms of input and network
parameters, (b) the evaluation of 3D PointNet++ suc-
cessor network variants and (c) the comparison of the
obtained results including the 2D frame-based base-
line.
4.1 Dataset
In contrast to the long-established frame-based com-
puter vision, the set of publicly available datasets is
smaller in the event-based vision field. This becomes
even more noticeable focusing on a specific applica-
tion domain, such as long-time monitoring scenarios.
Related to the development of advanced vehicle
driver-assistance systems larger event-based monitor-
ing datasets are available. The datasets DDD17 (Bi-
nas et al., 2017) and DDD20 (Hu et al., 2020) can
be listed as examples. Despite the fact that these
datasets are composed of many hours of real-world
DVS recordings, these datasets cannot directly be
used for the purpose of semantic segmentation due to
the lack of appropriate semantic labeling. The GEN1
dataset (de Tournemire et al., 2020) also provides
recordings in the automotive application domain. In
this case, object annotations are given for the two
(a)
PERSON
(b) DOG
(c)
BICYCLE
(d)
SPORTS-
BALL
(e) BIRD
(f) INSECT (g) TREE
CROWN
(h) TREE
SHADOW
(i) RAIN (j) BACK-
GROUND
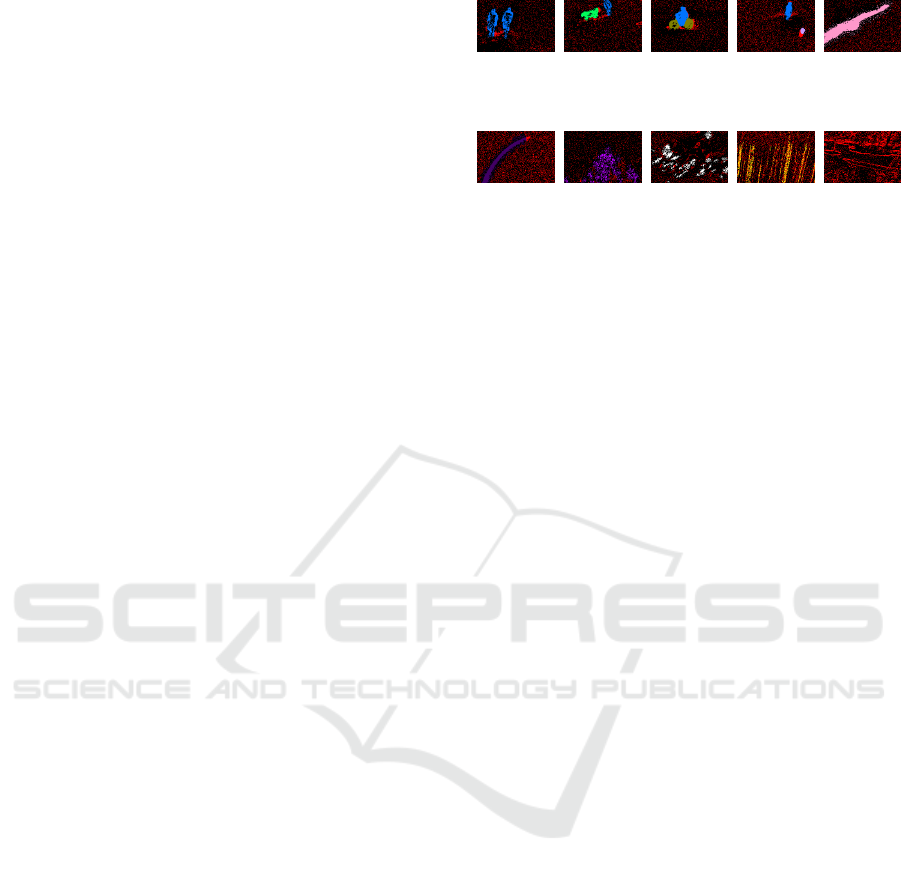
Figure 1: False-color label examples of included classes
in DVS-OUTLAB (projected from 60ms event-stream snip-
pets into 2D frame, modified from (Bolten et al., 2021), best
viewed in color).
classes person and car. However, these annotations
were carried out in the form of bounding boxes and
not on the level of a semantic segmentation.
Miao et al. offer with (Miao et al., 2019) another
dataset addressing a related scenario of pedestrian de-
tection. However, this dataset consists of only 12
short recordings with an average length of about 30
seconds and furthermore offering only bounding-box
labels for the two classes of background and person.
Hence, a meaningful evaluation of the proposed meth-
ods on these datasets does not appear to be purpose-
ful.
Therefore, the provided semantic labeling from
the DVS-OUTLAB dataset (Bolten et al., 2021) were
selected for this work. This dataset contains DVS
recordings of three CeleX4 neuromorphic sensors
(Guo et al., 2017) form a performed multi-sensor
long-time monitoring of an urban public outdoor
space. These recordings provide a spatial resolution
of 768 × 512 pixels. Furthermore the DVS-OUTLAB
dataset includes a semantic per-event-labeling for 10
classes in about ≈ 47k regions of interest (see Fig-
ure 1), partitioned in train/test and evaluation sets.
This labeling includes different challenges in the form
of environmental influences and plain sensor back-
ground noise in addition to various objects included
at very different sizes through their perspective dis-
tances.
4.2 Point Cloud Representations and
Processing Pipeline
Prior work applying 3D point cloud processing tech-
niques on DVS event data processes temporal win-
dows of the stream that includes the entire spatial
resolution of the sensor. In (Wang et al., 2019) the
used DVS128 sensor offers a spatial resolution of
128px × 128px, whereas the CeleX4 sensor record-
ings used in this work have a spatial resolution of
Evaluation of Deep Learning based 3D-Point-Cloud Processing Techniques for Semantic Segmentation of Neuromorphic Vision Sensor
Event-streams
171

Figure 2: Patch-of-Interest (PoI): Data selection within
DVS-OUTLAB.
768px × 512px. This considerably higher resolution
leads to a significantly higher number of possible
events per temporal window of the same length.
Over the entire recordings used in (Wang et al.,
2019), the mean event count per 60ms time window
is approximately 3175 events. Considering the DVS-
OUTLAB database used here, this mean count per
60ms time window is about 30 times higher at about
≈ 97k events. Therefore, we decided to apply spatial
patching in addition to the temporal windowing. We
patch the provided stream data into 16 equal patches
of size 192px ×128px × 60ms, as illustrated in Figure
2. This divide and conquer approach allows to keep
smaller objects and finer structures intact in the subse-
quent filtering and sampling steps to generate the final
point clouds, since the mean event count per patch is
lowered to around 7.5k events.
To generate a point cloud per patch, the follow-
ing preprocessing steps are carried out (compare with
Figure 3a for clarification):
1. Spatio-temporal filtering: As reported by the
DVS-OUTLAB authors, the provided database
contains a high amount of sensor background
noise. Analogously to their analysis of different
spatio-temporal filters (Bolten et al., 2021), we
also apply a filtering in the first processing stage.
The event stream is filtered by removing each
event that is not supported by at least one other
event at the same spatial (x, y) coordinate within
its preceding 10ms. The selection of this filter
is based on the aforementioned filter analysis in
(Bolten et al., 2021), as it reduced background
noise by about 50% while keeping the highest pro-
portion of other class events compared to other
considered spatio-temporal filter variants.
2. Subsampling: A requirement for the application
of PointNet++ and the other 3D network variants
is that the event count given as input must be
constant. Hence, a uniform random subsampling
of the time-filtered events is performed such that
each event has equal probability of appearance.
After applying the previous time filtering step, the
average event count per patch is approximately
4.8k events. Based on this event count evaluation,
n = 4096 events was selected as suitable subsam-
pling target. For patches with fewer events, copies
of randomly selected events are inserted until the
required number is reached. Due to the usage of
max-pooling in the point cloud network process-
ing logic the influence of these duplicates is neg-
ligible.
3. Spatio-temporal scaling: Subsequently, the en-
tire patch of 192px × 128px × 60ms is shifted into
the coordinate origin so that the upper left bound-
ary point of the patch is located at x = 0, y = 0, t =
0. This leads to the following 3D space time point
cloud definition:
S
T
native
= {e
i
= (x
i
, y
i
,t
i
) | (1)
t
i
∈ T, i = 1, . . . , 4096,
x
i
∈ N : 0 ≤ x
i
< 192,
y
i
∈ N : 0 ≤ y
i
< 128,
t
i
∈ R : 0 ≤ t
i
< 60.0}
where T is the current temporal event stream win-
dow of 60ms.
In addition, two other variants were considered
within the experiments in which the 3D event co-
ordinates were rescaled accordingly on the time
axis or on all three axes:
S
T
tScaled
= {e
i
= (x
i
, y
i
,t
i
) | (2)
t
i
∈ T, i = 1, . . . , 4096,
x
i
∈ N : 0 ≤ x
i
< 192,
y
i
∈ N : 0 ≤ y
i
< 128,
t
i
∈ R : 0 ≤ t
i
< 1.0}
S
T
cube
= {e
i
= (x
i
, y
i
,t
i
) | (3)
t
i
∈ T, i = 1, . . . , 4096,
x
i
, y
i
,t
i
∈ R : −1 ≤ x
i
, y
i
,t
i
≤ 1}
A semantic segmentation is then generated from
these point clouds using the network structures, cre-
ating an event-wise labeling.
4.3 Frame-based Representations and
Processing Pipeline
To ensure fair comparability to the 3D-PointCloud
methods, the frame-based Mask-R-CNN analysis is
based on input data that has been pre-processed in
the same manner. This means that the generated in-
put frame representations originated from the same
DVS event-stream temporal sections and patches
VISAPP 2022 - 17th International Conference on Computer Vision Theory and Applications
172
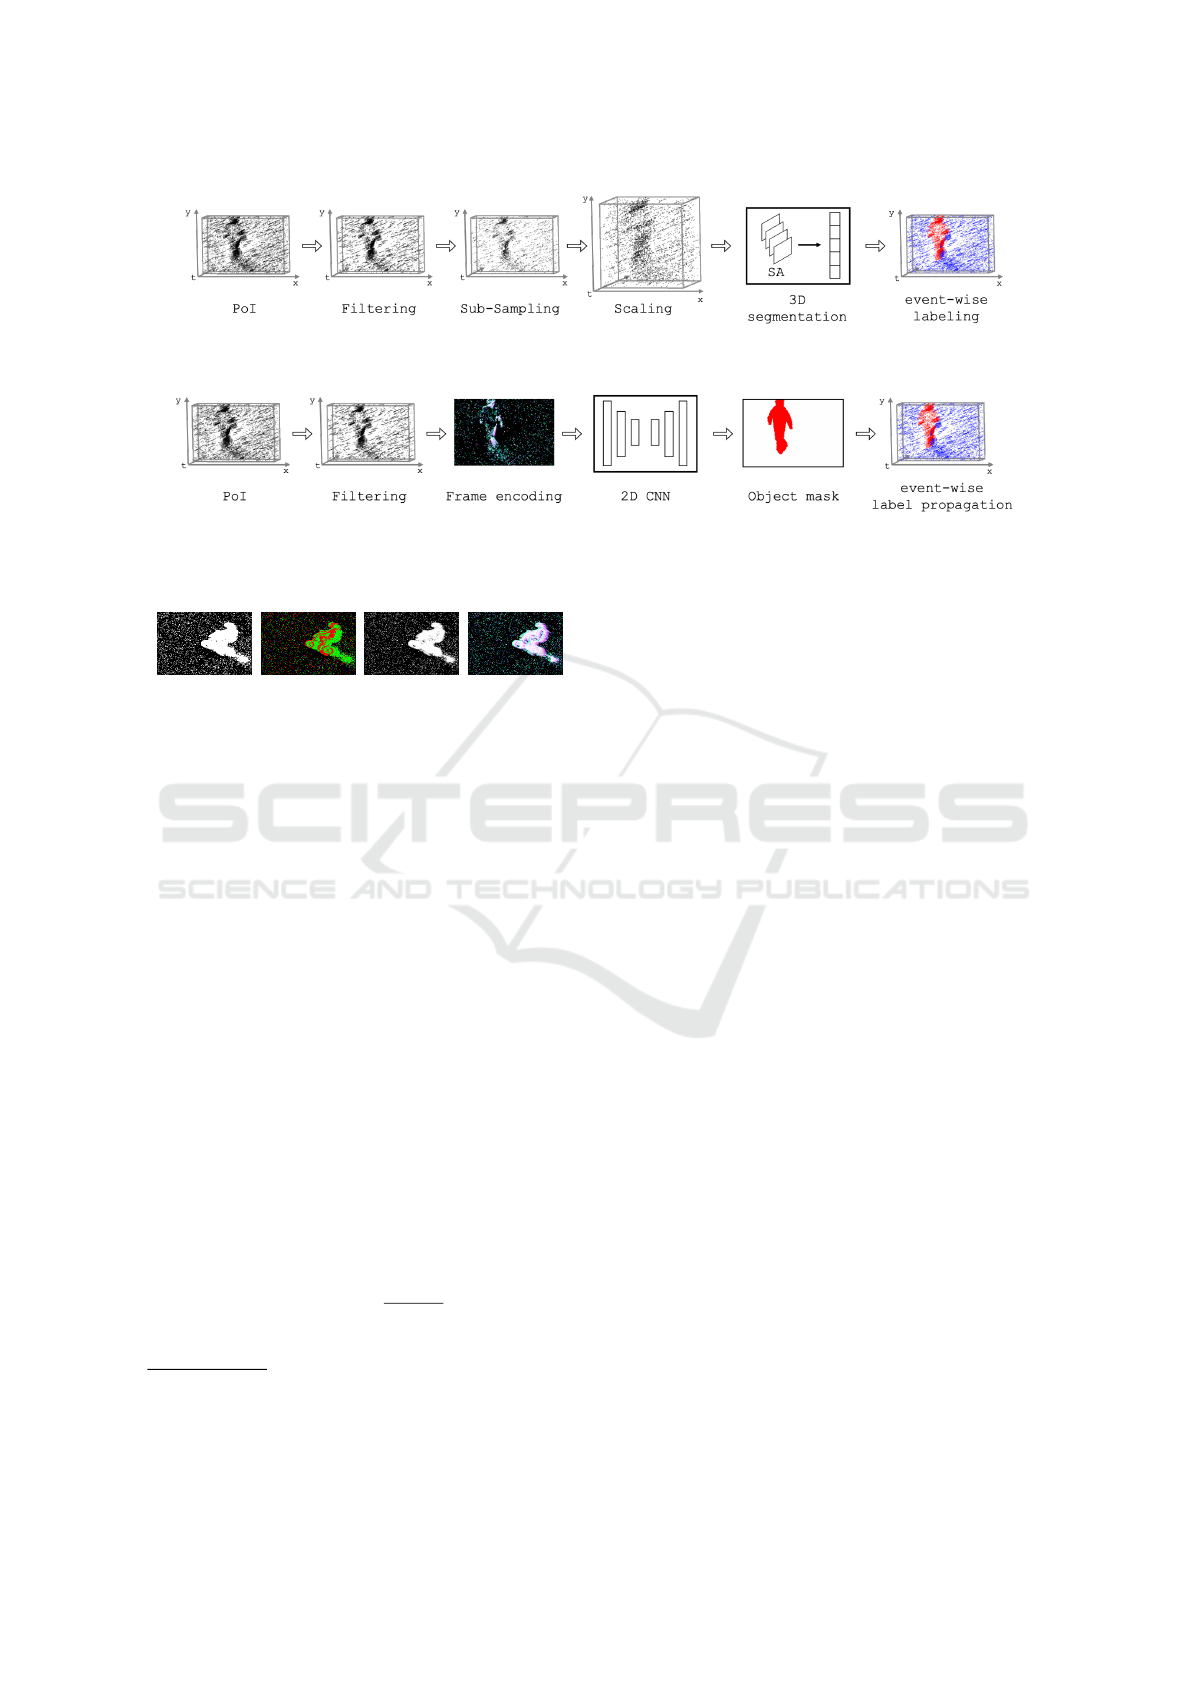
(a) 3D based PointCloud processing
(b) 2D frame based CNN processing
Figure 3: Visualization of performed processing steps per Patch-Of-Interest (PoI).
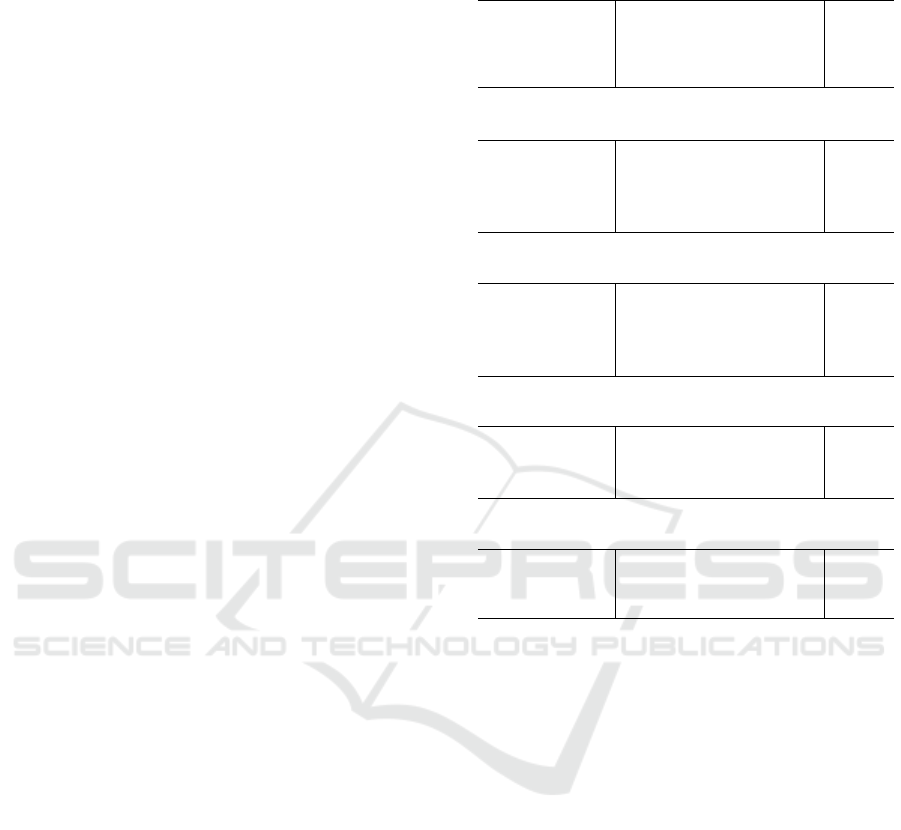
(a) Binary (b) Polarity (c) Frequency (d) MTC
Figure 4: Examples of different frame encodings (best
viewed in color).
of 192px × 128px × 60ms, which were also spatio-
temporally pre-filtered with the same threshold pa-
rameter of 10ms.
These patches are encoded into frame representa-
tions according to the following description (compare
to examples in Figure 4):
Binary representation
The frame pixel at (x, y) is set to white if a cor-
responding event with the same spatial coordinate
exists in the patched DVS data.
Polarity representation
The frame pixel at (x,y) encodes the polarity of the
latest event that occurred at that spatial position.
The direction of brightness change is encoded by
the following colors: (a) decrease in red, (b) no
change in blue and (c) increase in green.
1
Frequency representation
The frame pixel at (x,y) encodes the normalized
count of event occurrences at that spatial position
as proposed by Chen et al. in (Chen et al., 2019a):
σ(n) = 255 · 2 ·
1
1 + e
−n
− 0.5
(4)
where n denotes the count of occurred events
1
The utilized CeleX4 sensor determines the polarity of
an event based on its transmitted gray value within software,
this can also lead to events with “no brightness” changes.
within the considered time window at the evalu-
ated frame coordinate.
The frequency of occurrence of events within a
time interval represents an indication of whether
the event is noise or a valid event. Assuming that
moving objects trigger a larger number of events,
this encoding leads to a higher weighting of the
edges whereas noise is reduced assuming advan-
tages for subsequent signal-processing.
MTC “Merged-Three-Channel” representation
In this frame representation, which was also pro-
posed by Chen et al. in (Chen et al., 2019a),
different one channel encodings are merged in a
three channel RGB image. This follows the at-
tempt to encode different aspects of the event do-
main and to obtain a large amount of available in-
formation in the encoding. These encodings are
based on:
Frequency (B-channel): This is the integration
of the previously described encoding as one chan-
nel of the merged representation.
Surface-Of-Active-Events (SAE, G-channel):
An advantage of the DVS technology is the high
time-resolution of the event stream. The goal of
the SAE-channel encoding is to include this char-
acteristic into the frame representation. Here, the
pixel values are directly dependent on the corre-
sponding timestamp of the events.
This allows that the pixel value and its gradient
includes information about the moving direction
and speed within the event stream.
Leaky-Integrate-And-Fire neuron model (LIF,
R-channel): In this encoding, realizing some
kind of memory surface, each pixel is interpreted
as a neuron with its own membrane potential (MP)
Evaluation of Deep Learning based 3D-Point-Cloud Processing Techniques for Semantic Segmentation of Neuromorphic Vision Sensor
Event-streams
173
with a fixed decay rate. The triggered events will
increase the corresponding MB and will cause a
firing of the neuron if a threshold is exceeded. The
firing rate determines the pixel value in the frame
encoding.
This encoding allows the inclusion of time-
continuous aspects of the event stream into the
encoding. For a detailed description and imple-
mentation details refer to (Chen et al., 2019a).
Including these aspects in the frame encoding al-
lows for a fair comparison to the 3D methods, since
many characteristics of the events streams are in-
tended to be included.
For each of these frame encodings different Mask-
R-CNNs were trained from scratch with derived 2D
instance labels of the DVS-OUTLAB train-set utiliz-
ing the network implementation of (Abdulla, 2017).
To compare the obtained results with the point
cloud approaches, the 2D label masks generated by
Mask-R-CNN were propagated back to the original
event stream. Every event receives the label of the
corresponding spatial position of the predicted object
mask, thus generating an event-wise labeling (com-
pare to the last illustrated steps in Figure 3b).
4.4 Evaluation Metrics
In the evaluation process, a confusion matrix was built
and standard metrics for segmentation were derived.
Those were Intersection-over-Union, precision, recall
and F1-Score, each computed per-class. For effective
comparison across different setups despite the num-
ber of 10 classes, we derived some summary metrics
from the F1-Scores. Therefor, a weighted-average F1-
Score was computed by weighting the F1-Score of
each class by the number of its samples to account for
class imbalances. As the background-noise class was
particularly dominating, this metric was also com-
puted for merged classes listed below to provide an
overview on the average performance that is less in-
fluence by this imbalance:
• BACKGROUND
• Objects: PERSON, DOG, BICYCLE and SPORTSBALL
• Environmental influences: RAIN, TREE, INSECT,
BIRD and TREE_SHADOW
4.5 Network Training
The hyper parameters of the networks were left at the
defaults where possible. For the 3D point cloud net-
works this includes the Adam optimizer with a learn-
ing rate of 0.001 and a learning rate decay by 0.7 ev-
ery 200, 000 samples. The batch size was set to 16
Table 1: PointNet++ input and network parameter optimiza-
tion results shown as WeightedF1 results
Config
Back-
ground
Objects
Env-Influ
ences
Over-All
(a) PointNet++ Layer-experiments
3 Layer 0.952 0.741 0.755 0.9
4 Layer 0.953 0.721 0.763 0.9
5 Layer 0.954 0.737 0.775 0.904
6 Layer 0.955 0.723 0.781 0.905
(b) PointNet++ Point-Count-experiments
n = 512 0.948 0.704 0.732 0.89
n = 1024 0.952 0.741 0.755 0.9
n = 2048 0.958 0.746 0.806 0.914
n = 3072 0.959 0.75 0.805 0.915
(c) PointNet++ Input-Scaling-experiments
S
T
cube
0.958 0.746 0.806 0.914
S
T
tScaled
0.966 0.817 0.849 0.933
S
T
native
0.968 0.806 0.863 0.936
(d) PointNet++ Spatio-Temporal-Scaling-experiments
t
weight
= 1 0.968 0.806 0.863 0.936
t
weight
= 3.2 0.966 0.807 0.858 0.934
t
weight
= 20 0.96 0.788 0.814 0.92
point clouds. Except for randomly shuffling the input
point order each epoch, no data augmentation meth-
ods were applied. The random shuffle is also impor-
tant for the correct function of the local neighborhood
building process in PointNet++.
In case of the 2D Mask-R-CNN training the de-
fault learning rate was reduced by the factor of 2 to
0.0005 to prevent the explosion of the trained weights,
which especially tends to occurs with smaller batch
sizes, as in our case of three images. For training, the
Keras SGD optimizer was used with a momentum of
0.9 and data augmentation was not applied.
For all experiments the proposed train, validation
and test splits of the DVS-OUTLAB dataset were
used and the training process was carried out on an
NVIDIA Quadro RTX6000 GPU.
4.6 PointNet++ Results
For the main experiments, we determined some key
aspects to test with the PointNet++ architecture and
ranked them according to their expected influence.
These aspects were:
1. Number of layers
VISAPP 2022 - 17th International Conference on Computer Vision Theory and Applications
174
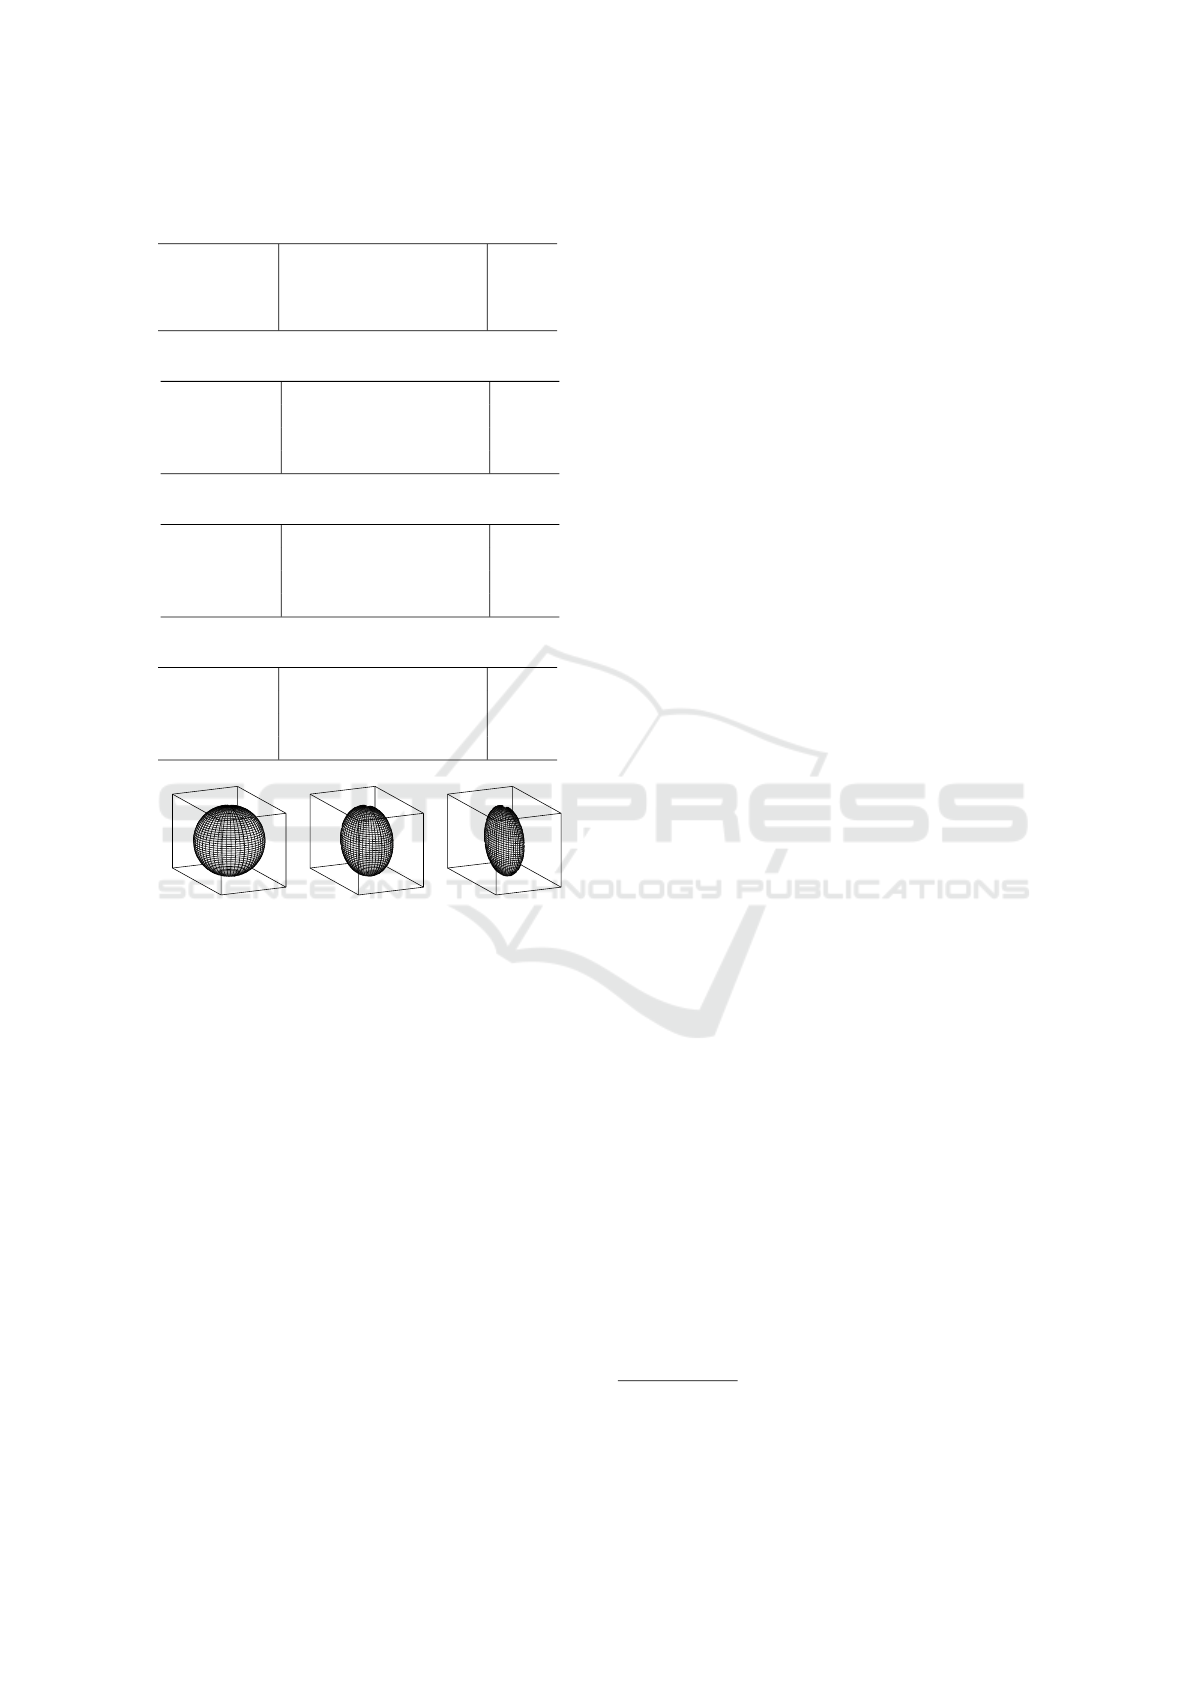
Table 2: Achieved WeightedF1 results by applying 3D net-
work variants and 2D-Mask-R-CNN baseline.
Config
Back-
ground
Objects
Env-Influ
ences
Over-All
(a) 3D Network variants
PointNet++ 0.966 0.817 0.849 0.933
A-CNN 0.968 0.823 0.862 0.938
LSANet 0.968 0.826 0.857 0.936
SpiderCNN 0.952 0.724 0.735 0.895
(b) Mask-R-CNN @ ResNet-50 Backbone
Binary 0.949 0.821 0.843 0.911
Polarity 0.953 0.844 0.873 0.922
Frequency 0.952 0.828 0.863 0.918
MTC 0.953 0.848 0.87 0.923
(c) Mask-R-CNN @ ResNet-101 Backbone
Binary 0.947 0.816 0.835 0.907
Polarity 0.953 0.842 0.875 0.923
Frequency 0.952 0.833 0.861 0.918
MTC 0.95 0.844 0.862 0.918
x
t
y
(a) Equal weight
x
t
y
(b) Higher weight
x
t
y
(c) Even higher
weight
Figure 5: Visualization of neighborhood by forcing higher
temporal weights in distance calculation.
2. Number of points sampled in the first SA-layer
3. Variation of spatio-temporal scaling
4. Forcing local neighborhoods to have more or less
temporal components
Each aspect was tested separately, i.e. other as-
pects were always fixed. We used a greedy strategy.
Parameters were estimated in the order given above
and then used for computing the best value of the next
parameter in this list.
The number of layers applies to the SA Layers
and equally to the FP Layers. It was chosen from
{3, 4, 5, 6}. Starting point was the default model for
semantic segmentation provided by the authors of
PointNet++, which was adapted to a different num-
ber of layers. The S
T
cube
scaling was chosen for the
first tests because PointNet++ authors also mentioned
such a normalization in (Qi et al., 2017a) and (Qi
et al., 2017b). We found that the number of layers
has a negligible influence. Therefore, we chose the
smallest and fastest version with 3 layers for subse-
quent experiments.
In the following, the number of points sampled by
FPS in the first SA layer was changed. In addition to
the default of 1024 points, 512, 2048 and 3072 points
were tested. The number of points in the later layers
was not changed. Whereas increasing the point num-
ber from 512 over 1024 to 2048 had a significant in-
fluence, the gain from sampling 3072 points was very
small, while almost 50% more time was needed for
inference, so 2048 points were selected for the next
tests.
Next, we tested the other spatio-temporal scalings
(see Section 4.2). Therefore, the radii of the SA layers
were adapted to the longest axis. Due to the shorter
time axis, the full time interval was allowed for neigh-
borhood building. It could be shown that both other
spatio-temporal scalings, applying either the S
T
tScaled
or the S
T
native
scaling, achieve a substantially better
performance than the previous configuration.
The idea of treating the spatial and temporal axes
differently in a radius selection due to different res-
olution was also mentioned in (Bi et al., 2019). It
seemed reasonable to test it on the present dataset,
since the temporal axis was always far shorter than
the spatial axes but had a significantly higher reso-
lution. Thus, the time component received a higher
weight in the Euclidean distance measure. The effect
is shown in Figure 5 in three levels. First, all axes
have the same weight, which leads to a sphere cover-
ing the whole time axis when it is shorter like in the
present dataset. Second and third, the sphere is com-
pressed with respect to the the time axis. Tests have
shown that reducing the time span had almost no in-
fluence at first when setting the time axis weight to
3.2, which leads to equal proportions with respect to
spatial and temporal axes. It reduces the performance
when shrinking the time interval too drastically, set-
ting the weight to 20. This supports the initial argu-
ment that keeping all available information is benefi-
cial for algorithm performance.
Table 1 shows the F1-Scores of the aforemen-
tioned experiments for the grouped classes.
2
For fur-
ther clarification, qualitative results of the segmen-
tations are given in Figure 6. Here, the processed
Patches-Of-Interest are projected into 2D frames and
the resulting labeling is represented by false colors.
2
The detailed network configurations and pre-trained
weights are available online. In addition, unweighted per-
class F1 scores are also available.
Evaluation of Deep Learning based 3D-Point-Cloud Processing Techniques for Semantic Segmentation of Neuromorphic Vision Sensor
Event-streams
175

Table 3: Network parameter and runtime comparison with batch size of one (Intel Xeon Gold 6226R CPU, NVIDIA Quadro
RTX6000).
Config #Trainable
Parameters
Config Avg. Inference
time [ms]
(a) 3D PointNet++ network parameters
PointNet++(*, 3L) 437,930
PointNet++(*, 4L) 967,594
PointNet++(*, 5L) 2,418,602
PointNet++(*, 6L) 7,285,162
(b) 3D PointNet++ runtimes
PointNet++(512, 3L) 13.3 +/- 0.5
PointNet++(1024, 3L) 23.1 +/- 0.4
PointNet++(2048, 3L) 43.0 +/- 0.7
PointNet++(3072, 3L) 62.7 +/- 1.2
(c) 3D Network variant parameters
LSANet(*, 3L) 556,810
SpiderCNN(*, 3L) 1,080,798
A-CNN(*, 3L) 2,113,706
(d) 3D Network variant runtimes
LSANet(2048, 3L) 43.5 +/- 1.0
SpiderCNN(*, 3L) 37.6 +/- 0.9
A-CNN(2048, 3L) 41.3 +/- 0.9
(e) Mask-R-CNN 2D-baseline parameters
MRCNN(ResNet50) 44,646,734
MRCNN(ResNet101) 63,664,974
(f) Mask-R-CNN 2D-baseline runtimes
MRCNN(ResNet50) 114.9 +/- 4.2
MRCNN(ResNet101) 127.1 +/- 4.1
4.7 3D Network Variant Results and
Baseline Comparison
The two network variants A-CNN and LSANet can
both outperform PointNet++ by a slight margin, espe-
cially in the important non-background classes. Con-
sidering the fact that the inference time nearly stayed
the same, they offer good alternatives to the bare
PointNet++ architecture. In contrast, SpiderCNN de-
livers much worse results, pointing out the effective-
ness of the set abstraction architecture of the other ap-
proaches, since SpiderCNN uses a different approach
without sampling and interpolation. Table 2 and 3
summarize the results and runtimes.
The Binary frame encoding achieves the worst re-
sults in the 2D-Mask-R-CNN comparison, regardless
of the utilization of ResNet 50 or 101 as network
backbone. This is understandable since this encod-
ing preserves the lowest amount of information. The
3-channel frame encodings Polarity and MTC show
significantly better results for non-background classes
compared to the Frequency encoding (compare to Ta-
ble 2b,c).
The results utilizing Polarity or MTC encodings
are comparable to each other, but are overall worse
than the bare PointNet++ results. It should be noted
that the PointNet++ used for comparison has about
101 or 145 times fewer trainable weights depending
on the used backbone and is up to a factor of ≈ 2.95
times faster at inference (compare to Table 3a,e and
3b,f).
5 CONCLUSION
The conducted experiments and their presented re-
sults clearly reveal that an interpretation of the DVS
event stream in the form of 3D space-time event
clouds is a promising way. The obtained seman-
tic segmentations using Deep Learning based meth-
ods for the processing of unordered 3D point clouds
achieves better results in terms of quality and runtime
compared to a 2D-frame encoded CNN-baseline ap-
proach. This confirms the presumed advantages of
the 3D point cloud representation of the DVS stream,
as this representation results almost natively and pre-
serves the properties of the data stream better than 2D
frame conversion encodings.
However, the point cloud representations with
e
i
= (x
i
, y
i
,t
i
) used in this work consider just the
spatio-temporal components of the event stream. One
aspect for further research may therefore be the con-
sideration of additional features, such as the event po-
larity, in this representation.
Currently, each patch of the event stream is pro-
cessed independently. As a result, the temporal con-
tinuity at the boundaries of the patches is not prop-
erly considered. Therefore, the extension of point
cloud based processing to include recurrent structures
(Fan and Yang, 2019) or LSTM structures (Min et al.,
2020) is another promising extension.
VISAPP 2022 - 17th International Conference on Computer Vision Theory and Applications
176
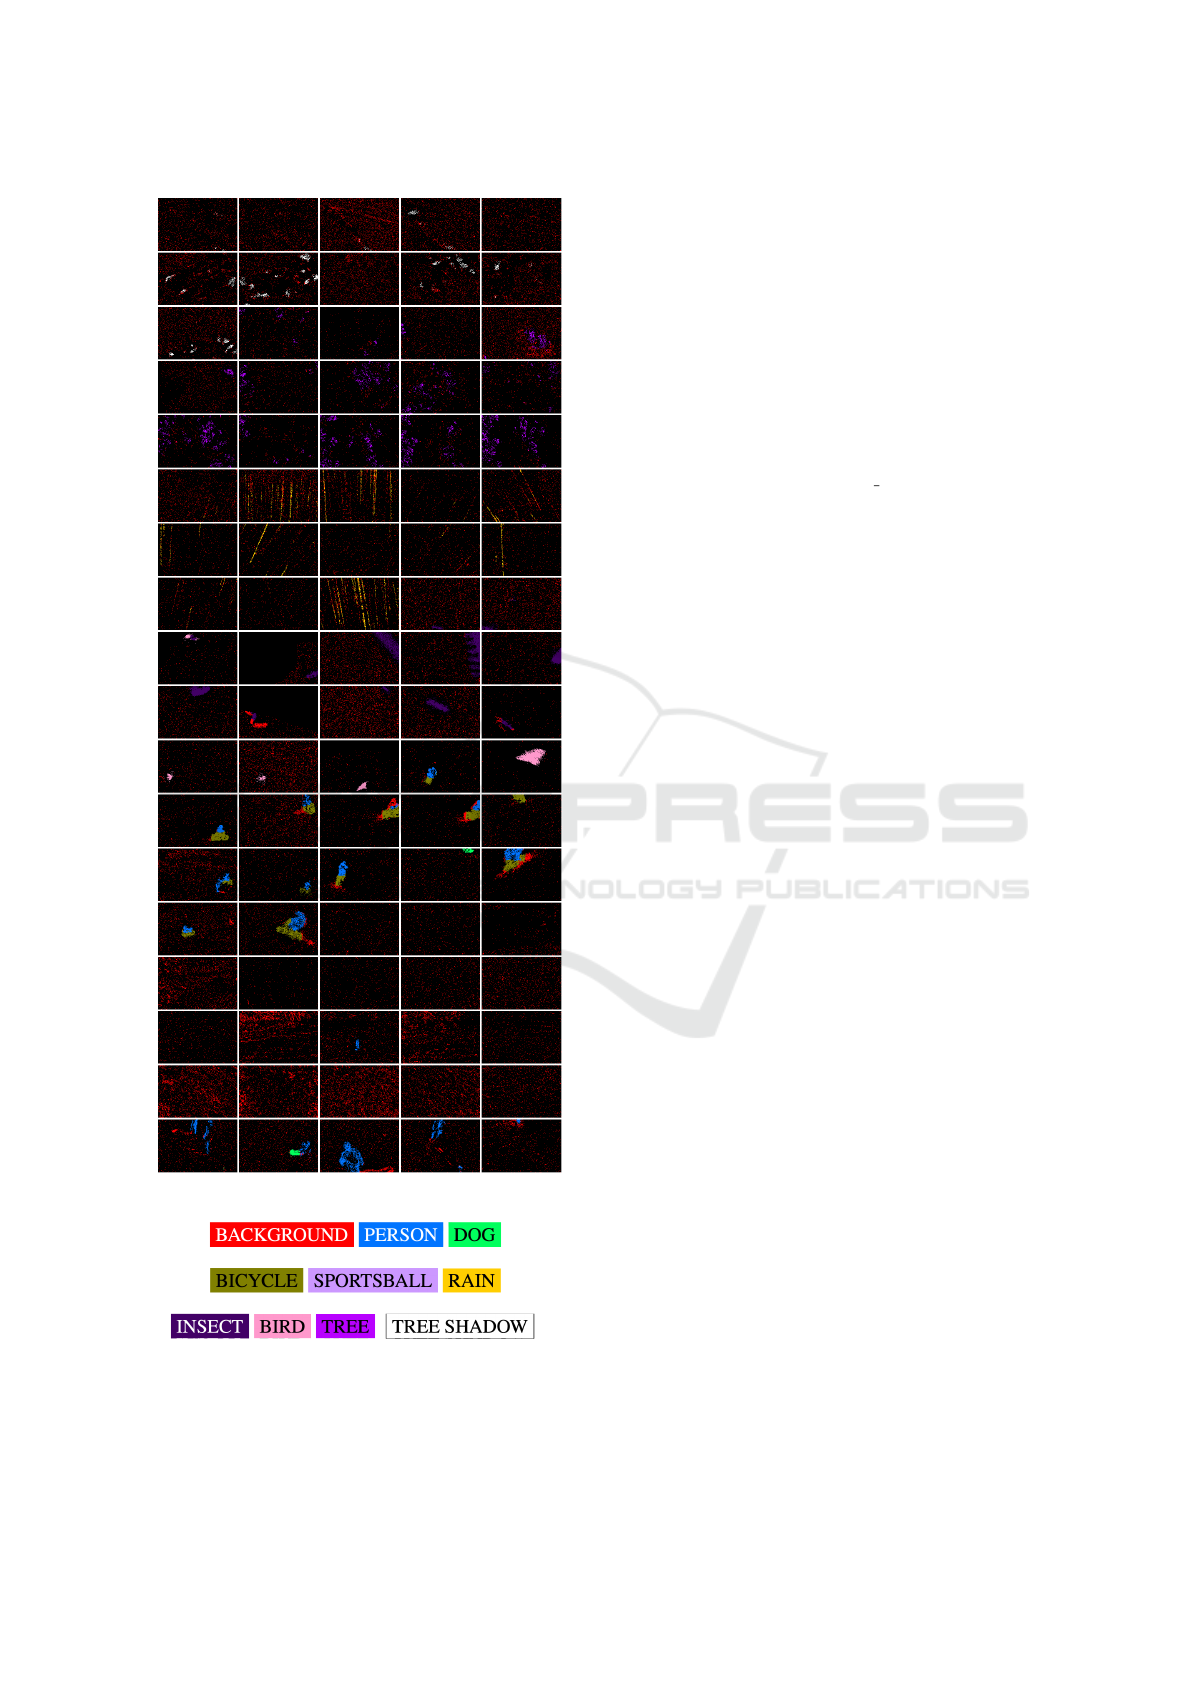
(a) Labeled Patches-Of-Interest projected into 2D frames
(b) False-color legend
Figure 6: False-color examples for PointNet++ semantic
segmentation results (best viewed in color).
ACKNOWLEDGEMENTS
This work was supported by the European Re-
gional Development Fund under grant number EFRE-
0801082 as part of the project “plsm” (https://plsm-
project.com/).
REFERENCES
Abdulla, W. (2017). Mask R-CNN for object detection and
instance segmentation on keras and tensorflow. https:
//github.com/matterport/Mask RCNN.
Alfaro, E., Fonseca, X. B., Albornoz, E. M., Mart
´
ınez,
C. E., and Ramrez, S. C. (2019). A brief analysis
of U-Net and Mask R-CNN for skin lesion segmen-
tation. In 2019 IEEE International Work Conference
on Bioinspired Intelligence (IWOBI), pages 000123–
000126.
Bi, Y., Chadha, A., Abbas, A., Bourtsoulatze, E., and An-
dreopoulos, Y. (2019). Graph-based object classifica-
tion for neuromorphic vision sensing. In Proceedings
of the IEEE/CVF International Conference on Com-
puter Vision (ICCV).
Bi, Y., Chadha, A., Abbas, A., Bourtsoulatze, E., and An-
dreopoulos, Y. (2020). Graph-based spatio-temporal
feature learning for neuromorphic vision sensing.
IEEE Transactions on Image Processing, 29:9084–
9098.
Binas, J., Neil, D., Liu, S.-C., and Delbruck, T. (2017).
DDD17: End-to-end davis driving dataset. In
ICML’17 Workshop on Machine Learning for Au-
tonomous Vehicles (MLAV 2017).
Bolten, T., Pohle-Fr
¨
ohlich, R., and T
¨
onnies, K. D. (2021).
DVS-OUTLAB: A neuromorphic event-based long
time monitoring dataset for real-world outdoor sce-
narios. In Proceedings of the IEEE/CVF Conference
on Computer Vision and Pattern Recognition (CVPR)
Workshops, pages 1348–1357.
Chen, G., Cao, H., Ye, C., Zhang, Z., Liu, X., Mo, X., Qu,
Z., Conradt, J., R
¨
ohrbein, F., and Knoll, A. (2019a).
Multi-cue event information fusion for pedestrian de-
tection with neuromorphic vision sensors. Frontiers
in Neurorobotics, 13:10.
Chen, J., Meng, J., Wang, X., and Yuan, J. (2020). Dynamic
graph CNN for event-camera based gesture recogni-
tion. In 2020 IEEE International Symposium on Cir-
cuits and Systems (ISCAS), pages 1–5.
Chen, L., Li, X., Fan, D., Cheng, M., Wang, K., and Lu, S.
(2019b). LSANet: Feature learning on point sets by
local spatial aware layer. arXiv, abs/1905.05442.
Damien., J., Hubert., K., and Frederic., C. (2019). Con-
volutional neural network for detection and classifica-
tion with event-based data. In Proceedings of the 14th
International Joint Conference on Computer Vision,
Imaging and Computer Graphics Theory and Applica-
tions - Volume 5: VISAPP,, pages 200–208. INSTICC,
SciTePress.
Evaluation of Deep Learning based 3D-Point-Cloud Processing Techniques for Semantic Segmentation of Neuromorphic Vision Sensor
Event-streams
177

de Tournemire, P., Nitti, D., Perot, E., Migliore, D., and
Sironi, A. (2020). A large scale event-based detection
dataset for automotive. arXiv, abs/2001.08499.
Durkee, M. S., Abraham, R., Ai, J., Fuhrman, J. D., Clark,
M. R., and Giger, M. L. (2021). Comparing Mask
R-CNN and U-Net architectures for robust automatic
segmentation of immune cells in immunofluorescence
images of lupus nephritis biopsies. In Imaging, Ma-
nipulation, and Analysis of Biomolecules, Cells, and
Tissues XIX, volume 11647, page 116470X. Interna-
tional Society for Optics and Photonics.
Fan, H. and Yang, Y. (2019). PointRNN: Point recurrent
neural network for moving point cloud processing.
arXiv, 1910.08287.
Gallego, G., Delbruck, T., Orchard, G. M., Bartolozzi,
C., Taba, B., Censi, A., Leutenegger, S., Davison,
A., Conradt, J., Daniilidis, K., and Scaramuzza, D.
(2020). Event-based vision: A survey. IEEE Transac-
tions on Pattern Analysis and Machine Intelligence.
Guo, M., Huang, J., and Chen, S. (2017). Live demon-
stration: A 768 × 640 pixels 200meps dynamic vi-
sion sensor. In 2017 IEEE International Symposium
on Circuits and Systems (ISCAS), pages 1–1.
Guo, Y., Wang, H., Hu, Q., Liu, H., Liu, L., and Ben-
namoun, M. (2021). Deep learning for 3d point
clouds: A survey. IEEE Transactions on Pattern Anal-
ysis and Machine Intelligence, 43(12):4338–4364.
He, K., Gkioxari, G., Dollar, P., and Girshick, R. (2017).
Mask R-CNN. In Proceedings of the IEEE Interna-
tional Conference on Computer Vision (ICCV).
Hu, Y., Binas, J., Neil, D., Liu, S.-C., and Delbruck, T.
(2020). DDD20 end-to-end event camera driving
dataset: Fusing frames and events with deep learn-
ing for improved steering prediction. In 2020 IEEE
23rd International Conference on Intelligent Trans-
portation Systems (ITSC), pages 1–6.
Jiang, Z., Xia, P., Huang, K., Stechele, W., Chen, G., Bing,
Z., and Knoll, A. (2019). Mixed frame-/event-driven
fast pedestrian detection. In 2019 International Con-
ference on Robotics and Automation (ICRA), pages
8332–8338.
Komarichev, A., Zhong, Z., and Hua, J. (2019). A-CNN:
Annularly convolutional neural networks on point
clouds. In Proceedings of the IEEE/CVF Conference
on Computer Vision and Pattern Recognition (CVPR),
pages 7421–7430.
Miao, S., Chen, G., Ning, X., Zi, Y., Ren, K., Bing, Z.,
and Knoll, A. (2019). Neuromorphic vision datasets
for pedestrian detection, action recognition, and fall
detection. Frontiers in Neurorobotics, 13:38.
Min, Y., Zhang, Y., Chai, X., and Chen, X. (2020). An
efficient PointLSTM for point clouds based gesture
recognition. In Proceedings of the IEEE/CVF Con-
ference on Computer Vision and Pattern Recognition
(CVPR).
Qi, C. R., Su, H., Mo, K., and Guibas, L. J. (2017a). Point-
Net: Deep learning on point sets for 3d classification
and segmentation. In 2017 IEEE Conference on Com-
puter Vision and Pattern Recognition (CVPR), pages
77–85.
Qi, C. R., Yi, L., Su, H., and Guibas, L. J. (2017b). Point-
Net++: Deep hierarchical feature learning on point
sets in a metric space. In Proceedings of the 31st Inter-
national Conference on Neural Information Process-
ing Systems, NIPS’17, pages 5105–5114, Red Hook,
NY, USA. Curran Associates Inc.
Quoc, T. T. P., Linh, T. T., and Minh, T. N. T. (2020).
Comparing U-Net convolutional network with Mask
R-CNN in agricultural area segmentation on satellite
images. In 2020 7th NAFOSTED Conference on In-
formation and Computer Science (NICS), pages 124–
129.
Redmon, J., Divvala, S., Girshick, R., and Farhadi, A.
(2016). You only look once: Unified, real-time ob-
ject detection. In 2016 IEEE Conference on Computer
Vision and Pattern Recognition (CVPR), pages 779–
788.
Ren, S., He, K., Girshick, R., and Sun, J. (2017). Faster
R-CNN: Towards real-time object detection with re-
gion proposal networks. IEEE Transactions on Pat-
tern Analysis and Machine Intelligence, 39(6):1137–
1149.
Ronneberger, O., Fischer, P., and Brox, T. (2015). U-
Net: Convolutional networks for biomedical image
segmentation. In Navab, N., Hornegger, J., Wells,
W. M., and Frangi, A. F., editors, Medical Image Com-
puting and Computer-Assisted Intervention – MICCAI
2015, pages 234–241, Cham. Springer International
Publishing.
Vuola, A. O., Akram, S. U., and Kannala, J. (2019). Mask-
RCNN and U-Net ensembled for nuclei segmenta-
tion. In 2019 IEEE 16th International Symposium on
Biomedical Imaging (ISBI 2019), pages 208–212.
Wan, J., Xia, M., Huang, Z., Tian, L., Zheng, X., Chang, V.,
Zhu, Y., and Wang, H. (2021). Event-based pedestrian
detection using dynamic vision sensors. Electronics,
10(8).
Wang, Q., Zhang, Y., Yuan, J., and Lu, Y. (2019). Space-
time event clouds for gesture recognition: From RGB
cameras to event cameras. In 2019 IEEE Winter Con-
ference on Applications of Computer Vision (WACV),
pages 1826–1835.
Wang, Y., Zhang, X., Shen, Y., Du, B., Zhao, G.,
Cui Lizhen, L. C., and Wen, H. (2021). Event-
stream representation for human gaits identification
using deep neural networks. IEEE Transactions on
Pattern Analysis and Machine Intelligence.
Xu, Y., Fan, T., Xu, M., Zeng, L., and Qiao, Y. (2018). Spi-
derCNN: Deep learning on point sets with parameter-
ized convolutional filters. In Ferrari, V., Hebert, M.,
Sminchisescu, C., and Weiss, Y., editors, Computer
Vision – ECCV 2018, pages 90–105, Cham. Springer
International Publishing.
Zhao, T., Yang, Y., Niu, H., Wang, D., and Chen, Y.
(2018). Comparing U-Net convolutional network with
Mask R-CNN in the performances of pomegranate
tree canopy segmentation. In Multispectral, Hyper-
spectral, and Ultraspectral Remote Sensing Technol-
ogy, Techniques and Applications VII, volume SPIE
10780, page 107801J. International Society for Optics
and Photonics.
VISAPP 2022 - 17th International Conference on Computer Vision Theory and Applications
178

Zhou, Y., Gallego, G., Lu, X., Liu, S., and Shen, S.
(2020). Event-based motion segmentation with spatio-
temporal graph cuts. arXiv, abs/2012.08730.
Evaluation of Deep Learning based 3D-Point-Cloud Processing Techniques for Semantic Segmentation of Neuromorphic Vision Sensor
Event-streams
179
