
Classification of Table Tennis Strokes in Wearable Device using Deep
Learning
Nuno Micael Ferreira
1,3
, Jos
´
e M. Torres
1,2 a
, Pedro Sobral
1,2 b
, Rui Moreira
1,2 c
and Christophe Soares
1,2 d
1
ISUS Unit, FCT - University Fernando Pessoa, Porto, Portugal
2
LIACC, University of Porto, Porto, Portugal
3
AppGeneration Software Technologies Lda, Porto, Portugal
Keywords:
Deep Learning, Edge AI, Activity Detection, Table Tennis Sports, Wearable and Mobile AI Apps.
Abstract:
Analysis of sports performance using mobile and wearable devices is becoming increasingly popular, helping
users improve their sports practice. In this context, the goal of this work has been the development of an Apple
Watch application, capable of detecting important strokes in the table tennis sport, using a deep learning (DL)
model. A dataset of table tennis strokes has been created based on the watch’s accelerometer and gyroscope
sensors. The dataset collection was done in the Portuguese table tennis federation training sites, from several
athletes, supervised by their coaches. To obtain the best DL model, three different architecture models where
trained, compared and evaluated, using the complete dataset: a LSTM based on Create ML/Core ML frame-
works (62.70% F1 score) and two Tensorflow based architectures, a CNN-LSTM (96.02% F1 score) and a
ConvLSTM (97.33% F1 score).
1 INTRODUCTION
Table tennis sport, also known as ping pong, has sev-
eral hundreds of millions of practitioners worldwide.
The rackets used in ping pong sports usually consist
of a handled frame with a rubber-covered, oval blade,
made of wood, flat and rigid. Wearable devices are
widely used in fitness tracking thus, extending their
use to monitor the player performance in other sports,
like table tennis, for example, is becoming natural.
This is important for federated athletes and enthusi-
astic amateurs seeking to improve their game perfor-
mance, as the existence of reliable statistical data is of
paramount importance to tailor the training sessions.
Tracking racket sports performance using sensor
devices and AI has been studied in recent years as
presented in Section 2. However, many of those so-
lutions have requirements that limit their application
in common competition and training scenarios. In-
stead of using specialized hardware or requiring lab-
oratory conditions, the approach presented in this pa-
a
https://orcid.org/0000-0002-8280-1324
b
https://orcid.org/0000-0002-7146-4545
c
https://orcid.org/0000-0002-4123-0983
d
https://orcid.org/0000-0002-0382-879X
per is non-intrusive, not interfering with the athletes’
playing style. It is based on the hardware sensors usu-
ally available in a common smartwatch. The logic
of the application is supported on suitable DL mod-
els for time series that were trained, tested, and com-
pared. An important outcome of this work was the
acquisition of a publicly available dataset of the most
important table tennis strokes, performed by athletes
in Portuguese table tennis federation training sites.
The dataset acquisition process was carefully planned
with a proper methodology and validated by table ten-
nis coaches. Hopefully, this dataset will allow other
researchers to replicate our investigation and test dif-
ferent solutions.
The remaining paper is structured as follows: Sec-
tion 2 where we survey related approaches to activity
detection in ping pong. Then we describe the pro-
cess of creation of the dataset we used to evaluate our
method in Section 3, followed by a description of the
experimental setup in Section 4. Results are presented
and discussed in Section 5. We close by summarizing
our findings and outlining future work in Section 6.
Ferreira, N., Torres, J., Sobral, P., Moreira, R. and Soares, C.
Classification of Table Tennis Strokes in Wearable Device using Deep Learning.
DOI: 10.5220/0010871100003116
In Proceedings of the 14th International Conference on Agents and Artificial Intelligence (ICAART 2022) - Volume 3, pages 629-636
ISBN: 978-989-758-547-0; ISSN: 2184-433X
Copyright
c
2022 by SCITEPRESS – Science and Technology Publications, Lda. All rights reserved
629

2 RELATED WORK
In recent years, Human Activity Recognition (HAR)
and sports performance evaluation, have been imple-
mented through wearable sensors attached in differ-
ent locations of the athlete’s bodies (Connaghan et al.,
2011). Various types of sensors have been used: ac-
celerometers, gyroscopes, pressure sensors, heart rate
monitors, etc (Neville et al., 2010; Zeng et al., 2015;
Ord
´
o
˜
nez and Roggen, 2016).
(Sensorsoscar et al., 2018) presents comprehen-
sive research on human activity recognition systems
using wearable sensors. Twenty-eight HAR systems
are evaluated on several parameters including recog-
nition performance, energy consumption, obtrusive-
ness, and flexibility, among others. It also presents
the most used techniques in HAR systems for feature
extraction and learning methods in ML.
In (P
¨
arkk
¨
a et al., 2006), the authors argue that
automatic activity classification can be used to pro-
mote physical activities that improve well-being and
a healthier lifestyle. Their focus was on the selection
of the best classification methods and sensors for each
sports activity. A large dataset of sensor data was cre-
ated and tested. They concluded that the sensor with
the best results was the accelerometer. From the three
classifiers used: ANN (Artificial Neural Network),
AGDT (Automatically Generated Decision Tree), and
CDTC (Custom Decision Tree Classifier), the best
performance was achieved with AGDT with an accu-
racy of 86%.
In (Wu et al., 2018), the authors collaborated with
data analysts to understand and characterize the so-
phisticated domain problem of table tennis data anal-
ysis. An interactive table tennis visualization system
is presented to evaluate and explore table tennis data
by providing a holistic view of an entire match from
three main perspectives: i) time-oriented analytics, ii)
statistics, and iii) tactics. The proposed system pro-
vides detection of tactical patterns with a timeline for
scoring. The mentioned work also allows the visu-
alization of how hitting the ball was performed and
where the ball ended up in the opponent’s field.
Liu (Liu et al., 2019), uses body network sensors
to perform stroke detection in table tennis. Three sen-
sor devices are used per athlete placed in different
parts of the arm. Each device contained a processing
unit and an IMU processing unit containing the ac-
celerometer, gyroscope, and magnetometer. The au-
thors applied a stroke detection algorithm based on
a conjunction of a sliding window, a feature extrac-
tion, a feature reduction, and finally an SVM classifier.
The total precision of all strokes is 97.4% however the
number of samples was low.
Also in the table tennis context, Lim (Lim et al.,
2018) developed a system to help coaches in the train-
ing process. It is based on the LSTM algorithm for
processing time-series data with the use of a spatial
neuronal model. Three sensor modules containing ac-
celerometers and gyroscopes are used to record the
following strokes: forehand stroke, backhand drive,
backhand shot, forehand cut, and forehand drive. Sen-
sor data was captured with a frequency of 5Hz during
5.4s, generating 1260 samples. The authors generated
an RNN-LSTM neuronal model capable of identifying
whether the player was a professional or an amateur
player (F1 score of 93%) based on the features of the
strokes performed.
Kulkarni (Kulkarni and Shenoy, 2021), developed
a new method for capturing visual table tennis data
and performing stroke detection and classification.
Fifteen strokes were captured: topspin, block, push,
flick and lob, each of them in three variants (back-
hand, forehand, and forehand flat). The authors used
a player detection model followed by a second human
body pose estimation model (HRNet) and then, ML
and DL models were created and compared. In ML
the best model was SVM with an accuracy of 98.37%
while in DL the best model was TCN with a 99.37%
precision.
In (Blank et al., 2015), the authors present a sys-
tem for detection and classification of table tennis
strokes using inertia measuring devices. A miPod
sensor containing an accelerometer and gyroscope
was used and placed on the racket handle recording
data at 1000Hz. The strokes performed were: drive,
push, block, and topspin in their variations. A motion
detection algorithm was developed to detect peaks of
the acceleration signal within a time interval defined
at 1s. The generic time features were calculated based
on (average, standard deviation, asymmetry) and sig-
nal characteristics (minimum, maximum, energy, me-
dian). For classification, only ML models were used
and the best performing model was SVM with 96.7%
accuracy.
This section shows that the use of AI techniques in
the context of table tennis sport is well covered in the
literature. However, despite of the good accuracy that
many of the presented systems have demonstrated, al-
most all have requirements that invalidate its practical
use in common table tennis games scenarios. Special
hardware needs to be attached to the player’s body
or to the racket handle, in most cases. Playing with
attached accessories probably compromises the ath-
lete’s usual playing style. Other systems are based
on computer vision, such as (Kulkarni and Shenoy,
2021), and require dedicated cameras and their care-
ful placement which also limits their widespread use.
ICAART 2022 - 14th International Conference on Agents and Artificial Intelligence
630

3 DATASET CREATION
3.1 Dataset Design and Acquisition
A methodology was developed, with the involvement
of table tennis athletes and coaches, to create the
dataset. Firstly, a questionnaire was provided to ath-
letes and coaches from several table tennis training
centers, to find out which were the most important ta-
ble tennis strokes. The list contained all the strokes
identified in previous works plus the strokes that the
coaches indicated as the most played ones. Seven-
teen answers were obtained and the most important
strokes identified were topspin followed by block and
flip with the same amount of votes, then service, any
stroke that can be detected, cut, and drive. The fi-
nal selection of the most important strokes to be ac-
quired and afterward detected was decided together
with the coaches. In total, 5 strokes were selected:
topspin forehand, topspin backhand, block, flip fore-
hand, flip backhand. The considered strokes were the
three most voted on the questionnaire together with
their variants, except for service due to the number
of ways it is possible to execute this last stroke and
presenting each service its characteristics.
To acquire the players’ strokes, an Apple watch
was chosen. This smartwatch comes with five sen-
sors: i) accelerometer, ii) gyroscope, iii) magnetome-
ter, iv) pedometer, and v) heart rate. Following pre-
vious works (Cust et al., 2019; Barshan and Y
¨
uksek,
2014; Neville et al., 2010; Lim et al., 2018), was de-
cided to use the accelerometer and the gyroscope both
on 3 axes. In the acquisition process, a logging app
(Thomas, 2021) has been used with the sampling fre-
quency adjusted to 50HZ. This sweet spot value was
determined after some preliminary tests were con-
ducted. The Apple Core Motion framework allowed
to obtain processed and bias removed motion data,
such as gravity, from the watch accelerometer and gy-
roscope.
Using a table tennis robot, a continuous recording
of data by the performing athlete is possible without
having to worry if the incoming ball does not con-
tain the necessary effect to allow the execution of the
stroke is recorded. For that reason, a robot was used,
since it allows to automatically throw a sequence of
multiple balls, with different motion effects applied
on the ball. The interface provided by the robot of-
fered 4 adjustments: two controls for the ball effect
and speed; one control for the rotation of the robot’s
tower; and the last button controls the interval be-
tween consecutive thrown balls. In the robot model
used, this last button had no levels associated. Be-
cause of that, a level scale was handcrafted, and ap-
plied to the robot, with 11 button levels evenly dis-
tributed. After that, at each level scale, tests were
done, using video footage to verify, to measure the
time interval between consecutive balls thrown. The
scale obtained ranged between 26.55 (min, level 1)
and 72.29 (max, level 11) thrown balls per minute
(balls/min). The two scale levels used during the
dataset collection were: level 3 (34.48 balls/min, T =
1.74s) and level 6 (51.72 balls/min, T = 1.16s). For
each of the 5 stroke types to be recorded, the follow-
ing robot parameters were defined (Table 1), based on
the participating athletes’ feedback.
Table 1: Robot defined parameters for each stroke.
Strokes
Button 1
(position)
Button 2
(Position
Direction (Reverse in
case of left handed)
Rotation
angle (º)
Top Spin Forehand 4 3
Towards right side
of player
0
Top Spin Backhand 4 3
Towards left side
of player
0
Block 6 4
Towards left side
of the player
60
Flip Forehand 2 3
Right side of player,
furthest part of player half
camp available
30
Flip Backhand 2 3
Left side of player,
furthest part of player
half camp available
30
Two main datasets, designated as D1-fast (D1)
and D2-slow (D2), were captured. The D1 was
recorded at button level 6 (1.16s of ball interval and a
total of 1.16s ×50Hz = 58 measures per stroke). This
dataset represents the expected cadence of strokes
during a real live game. The D2 was recorded at
button level 3 (1.74s interval and a total of 1.74s ×
50Hz = 87 measures per stroke) with the objective of
the rest phase being visible, and when the player is re-
covering for the next ball, reproducing a slow training
rhythm. Athletes were then asked to wear the apple
watch on the hand which holds the racket and were
asked to hit the ball with the corresponding stroke.
Each stroke recording session produced a CSV file
with the sensor data gathered.
Players were also asked to try and reproduce the
hand motion corresponding to a player resting such
as when waiting for the next ball or picking a new
ball. The rest information has been considered on
both datasets. In total, 15 athletes participated in the
study. Of those, 14 were athletes playing at the na-
tional championship and 3 were left-handed. All par-
ticipants were male having age intervals from 14-55.
For every athlete, at least one stroke was recorded. A
total number of 116 samples were recorded, each cor-
responding to an athlete doing a stroke sequence. D1
contains 55 samples while D2 contains 46 samples.
Additionally, 15 samples, each representing rest by
the corresponding player, were also acquired. These
samples were then added to each dataset.
Classification of Table Tennis Strokes in Wearable Device using Deep Learning
631
3.2 Dataset Pre-processing
In the pre-processing stage of the two datasets, some
operations were done, such as all rows having null
column values were removed, or the first and last
4 seconds of data were removed to eliminate noisy.
From the 2 initial datasets, D1 and D2, two more
datasets were derived, respectively, D3-fast-cut (D3)
and D4-slow-cut (D4), through the application of an
intelligent trimming operation to each row of the ini-
tial datasets, to convert to 46 measures per row, corre-
sponding to a temporal window of 46/50Hz = 0.92s
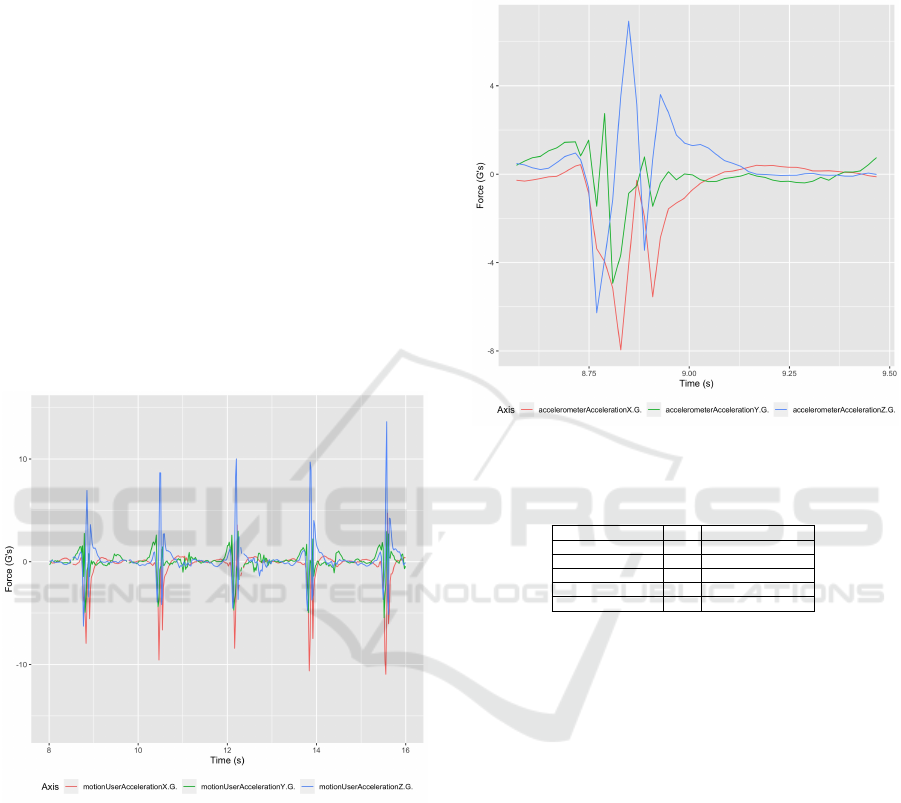
of duration. This process consisted in first identify-
ing the temporal limits of each stroke. To help in
the identification of when a stroke occurred, graph-
ics for visualization of motion data were created for
each stroke based on the accelerometer signal. By
analyzing those graphs, a pattern could be identified.
For every occurring stroke, a rapid increase in user
acceleration could be observed. Figure 1 depicts the
accelerometer data for a stroke of type flip backhand.
Figure 1: Five Flip backhand strokes graphical representa-
tion.
For different strokes, the axis in which the accel-
eration is maximum differs. A stroke detection algo-
rithm (SDA) was created for automatically analyzing
the acceleration on each data row. If the accelera-
tion for time step t
i
surpasses a certain threshold in a
specific axis, both predefined for each stroke, a cut is
applied. The sequence of the 46 observed measures,
o
j
, considered for the model input are (o
t
i−9
,...,o
t
i+36
)
when a peak is detected at time t
i
. The thresholds and
the respective axis for each stroke type were found by
empiric testing until satisfactory cuts were obtained.
Figure 2 shows data of the same stroke presented
on Figure 1 with the cuts now applied. The optimal
thresholds and each axis of the accelerometer selected
for each type of stroke can be seen in Table 2.
Figure 2: Cut stroke backhand flip graphical representation.
Table 2: Defined preferred axis and threshold values for the
SDA for each stroke type.
Stroke type
Axis Accel Threshold (G)
Top Spin (forehand) X 1
Top Spin(backhand) Z 1
Block Z 1
Flip (forehand) X 1
Flip (blackhand) Z 1
As mentioned, the datasets obtained after apply-
ing this SDA algorithm were D3 and D4. An addi-
tional dataset, designated D5-fast-slow-cut (D5), con-
tains the union of D3 and D4, being the most valuable
dataset since it is complete and pre-processed. For
each data set, each stroke class was then divided in a
ratio o 80% / 20% in train and test folders. All the
datasets created in this work are publicly available at
the Github repository (Ferreira, 2021).
4 EXPERIMENTS
The creation and training of all the models were done
offline in a MacBook Pro computer with: CPU In-
tel Core i9 2.9GHz, GPU AMD Radeon Pro 560X
and 16GB of RAM. The model has to be appropri-
ate, in time and space complexity, to be deployed in
a smartwatch device, such as the Apple Watch. Three
models were created, and compared in terms of accu-
racy, precision and the F1-score, the harmonic mean
of precision and recall. One uses the Apple Create
ICAART 2022 - 14th International Conference on Agents and Artificial Intelligence
632

ML Framework, only available on Apple products,
and an LSTM based architecture; the second and the
third uses Google Tensorflow framework and, respec-
tively, a CNN-LSTM and a ConvLSTM architecture.
4.1 Core ML Model
For obtaining an activity motion classifier model, the
one appropriate for this problem, the Create ML app
provides an interface where training, validation, and
test can be easily done. To train and evaluate the ac-
tivity model, Create ML needs 5 parameters: features,
maximum iterations, batch size, prediction windows
size, and sample rate. The 6 features are the 3 axes
of the accelerometer and the 3 axes of the gyroscope.
The defined Sample Rate is 50Hz. After some em-
piric tests, a maximum iteration of 30 was found to
be more than enough for the datasets D1 and D2. For
datasets D3, D4 and D5, 35 iterations were defined
as the models benefit from more iterations. The pre-
diction windows size means how many observations
of sensor data should be taken into consideration for
stroke detection and classification. For dataset D1
was 58, for D2 was 87 and for the remaining datasets
D3, D4, and D5 was 46. For the batch size, the values
16, 32, 64, 128, 256 and 400 where pre tested for each
of the 5 datasets. The best values of the batch size, the
ones chosen, where D1 = 128; D2 = 64; D3 = 256; D4
= 256; D5 = 256.
The architecture of the activity model in Core ML
is LSTM based. Using Netron (Roeder, 2021), an
agnostic neural network, deep learning, and machine
learning models viewer, it is possible to observe that
the model architecture uses a convolution layer as the
first layer with an activation function ”ReLU”, fol-
lowed by an LSTM layer. In the subsequent layers,
dense layers (innerProduct), one batch normalization
layer, and a softmax layer at the end, can be found.
This architecture can be divided into three parts: first
the convolutional part; second the recurrent, LSTM,
part, adequate for sequences of observations; third the
post-processing part.
4.2 CNN-LSTM and ConvLSTM
Models
The other two DL models tested in this paper involved
using CNN-LSTM and ConvLSTM architectures cre-
ated using TensorFlow. Previous works demonstrated
good performance and accuracy on generating classi-
fier models in and out of Table Tennis by using these
two solutions. These two TensorFlow models were
then converted to Core ML model format, accepted
on the Apple Watch.
These two architectures were only trained and
tested with the datasets D3, D4, and D5. For each
architecture, batch sizes of 4, 16, 32, 64, 126, 256,
400 were compared. The optimal batch size for archi-
tecture CNN-LSTM was found to be 32 for D3, and
16 for D4 and D5. For architecture ConvLSTM, D3,
D4, and D5 values of, respectively, 128, 4, and 16
were defined based on the resulting tests. Different
batch sizes also show no major model performance
improvements. Model performance was measured by
the evaluation of 10 generated models for each model.
Precision, recall, and F1 score was used metrics to
evaluate the generated classifier models on both ar-
chitectures.
The CNN-LSTM is the most powerful and well-
known subset type of artificial neural network de-
signed to recognize patterns in sequences of data,
such as numerical times series data emerging from
sensors. CNN’S are proved to reduce frequency vari-
ations and can extract the features between several
variables. On the other hand, LSTM’s are capable
of modeling temporal information of irregular trends
in time series components. What differentiates CNN
and LSTMs from other neural networks are that they
take time and sequence into account, they have a tem-
poral dimension (Xia et al., 2020). The research done
by (Sainath et al., 2015) provided an example of what
a CNN-LSTM unified architecture was possible and
the authors demonstrated that such architecture pro-
vided a 5 to 7% increase in words error rate. Creating
a classifier model based on CNN-LSTM architecture
for activity recognition was also performed in (Xia
et al., 2020) and applied in multiple datasets, all with
good results.
ConvLSTM is a further extension of the CNN-
LSTM. The base of this algorithm extension is to per-
form the convolutions of the CNN (how the CNN
reads the input sequence data) as part of the LSTM
(Shi et al., 2015). Unlike LSTM, which directly reads
data to calculate internal states and state transitions,
and interprets a CNN model output, ConvLSTM di-
rectly uses convolution as part of the read input to the
LSTM unit itself. The ConvLSTM determines the fu-
ture state of a certain cell in the grid by the inputs and
past states of its local neighbors. By stacking multiple
ConvLSTM layers and forming a coding-prediction
structure, we can not only build network models for
problems but also build network models for more gen-
eral time-space sequence prediction problems which
suit our case of table tennis, and because the network
has multiple stacked ConvLSTM layers, it has strong
representation capabilities, making it suitable for pre-
diction in complex dynamic systems.
Classification of Table Tennis Strokes in Wearable Device using Deep Learning
633

CNN-LSTM and ConvLSTM Architectures
The creation of the CNN-LSTM architecture started
by adding a sequential model followed by applying a
Time Distribute layer allowing the model to read in
1, 2, or multiple subsequences of the window pro-
vided. Features were then flattened and provided
to the LSTM model to read and extract its features
before a final mapping to the corresponding activ-
ity is performed. The remaining layers added to the
model are two consecutive CNN layers followed by a
dropout of 50% and a max-pooling layer, these lay-
ers are the basic structures of a CNN-LSTM model.
For the loss function ”Categorical Cross Entropy” was
used together with Adam for the optimizer.
For the ConvLSTM, the ConvLSTM2D category
in the Keras library supports the ConvLSTM model
for 2D information. It is frequently used to classify
1D variables containing statistics. This category in-
put is based on [samples, time sequences, rows, cols,
channels]. By using the same approach taken when
creating the CNN-LSTM classifier model, it was con-
sidered for the samples to be the value of the total
rows available of sensor data, for the time sequences,
the value defined was 1 as only one sequence of
the windows was defined (2 was also available), row
number value was 1 since we are working with a 1D
array of data, and the number of columns represents
the number of time steps in the sequence meaning a
value of 46. When creating a ConvLSTM model, the
CNN and LSTM parts of the model must be defined
separately. For that a 2d kernel of 1 (row) x 3 (time
steps of the sequence), a 64 value for the filters, and
the activation function ”ReLu” were also defined at
this layer, then a dropout of 50% followed by a flatten-
ing of the output must be processed before adding the
final 2 dense layers with activation functions ”ReLu”
and ”softmax” respectively. For the model compila-
tion, the loss function we chose ”Categorical Cross
Entropy” and for the optimizer Adam.
5 RESULTS
5.1 Core ML Results
In the evaluation stage, dataset D1 obtained an F1
score of 62.71%. The model generated using this
dataset had the worst performance when identifying
the Flip (backhand) stroke type. It obtained the high-
est performance for Rest and Block, as both have
unique characteristics that define their strokes. The
dataset D2 obtained an F1 score of 56,70%. It was
possible to identify that the model couldn’t correctly
identify most of the Top Spin (backhand) strokes. No
clear conclusion could be made on what was causing
the model to have a bad performance when labeling
this stroke compared to the others available. Com-
pared to D1, the worst overall performance can be at-
tributed to two factors. First, a low number of samples
were available. Secondly, by using the size of a win-
dow of 87 observations, corresponding to 1.74s, the
introduction of noise can be considered a factor as the
typical duration of a stroke, from the beginning to the
end, was observed as taking, on average, 46 obser-
vations of data, corresponding to 0.92s, meaning that
data with no fundamental value is being fed into the
model. When comparing the three models generated
from the pre-process datasets with the cuts of the SDA
applied, the model generated from dataset D3 was the
best one, with an F1 score of 89.66%. All the 3 mod-
els D3, D4, and D5 showed more difficulties identi-
fying the stroke Top Spin (backhand). Dataset D4-
slow-cut failed to identify Top Spin (backhand) and
showed a low F1 score for Flip (backhand). The per-
formance of this model was higher when compared
to D5 who could identify all 6 strokes. Introduction
of noise or a lower number of samples can’t be con-
sidered the reason for such low performance as noise
has been almost completely removed by the stroke
detection algorithm and classes with a lower number
of samples than Top Spin (backhand) and Flip (back-
hand) performed better than strokes with a lower sam-
ple amount. The dataset D5 had the worst F1 score
when compared to the datasets D3 and D4. In these
particular experiments, an increase of samples when
comparing D3 and D4 with D5 showed no improve-
ment in the model performance.
5.2 CNN-LSTM and ConvLSTM
Results
In the CNN-LSTM architecture, all models, in all
datasets, had a good performance with a minimum F1
score of 95.5% for D4-slow-cut and 96% for D5. The
best CNN-LSTM model was the one generated from
D3 with an F1 score of 97.33%. Both D4-slow-cut
and D5 datasets had the lowest performance for the
Flip (backhand) stroke type. A possible cause for this
stroke’s lower performance can be a similarity with
the Top Spin (backhand), as both strokes have similar
characteristics. The Rest class had a 100% perfor-
mance in all datasets tested for CNN-LSTM. A pos-
sible cause for this result is the intrinsic characteristic
of rest motion, as it is significantly different from the
remaining strokes.
The ConvLSTM model generated from D5 dataset
had the best performance achieving 97.33% (Table
ICAART 2022 - 14th International Conference on Agents and Artificial Intelligence
634
3), followed by D3 with 96.66% and 94.16% on D4.
The D4 has more difficulties at identifying Flip (back-
hand), obtaining an F1 score of 88% while the re-
maining stroke types had F1 scores equal or higher
than 91%. The Rest class results showed a 100% F1
score for all datasets. This result is the same as the
result obtained using CNN-LSTM.
Table 3: Strokes performance for data set D5 using ConvL-
STM [%] (16 batch size).
Precision Recall F1
Top Spin (forehand)[tsf] 99 99 99
Top Spin (backhand)[tsb] 96 95 95
Block[b] 95 99 97
Flip (forehand)[ff] 100 96 97
Flip (backhand)[fb] 97 94 96
Rest[r] 100 100 100
F1 score average 97.33
The confusion matrix statistic is useful to identify
the stroke whose corresponding model had higher dif-
ficulties to identify correctly. The CNN-LSTM con-
fusion matrix for the dataset D5, on Table 4, shows
the most wrong predicted labels are the strokes Top
Spin (backhand) and Flip (backhand). The probable
cause for this fact can be the similarities between both
strokes. All other strokes showed a lower number of
incorrect labels. A probable cause for this could be
external factors such as athlete fatigue or some noise
still present on the data sets.
Table 4: Confusion matrix for CNN-LSTM and dataset D5
(true label vs predicted label).
tsf 489 4 1 5 6 0
tsb 1 401 6 2 31 0
b 2 2 334 0 8 0
ff 5 1 1 374 1 0
fb 2 8 7 1 371 0
r 0 0 0 0 0 366
tsf tsb b ff fb r
Looking at the confusion matrix from ConvL-
STM/D5 generated model pair, in Table 5, one can see
that most of the wrong predicted labels are between
Top Spin (backhand) and Flip (backhand). Wrong
predicted labels between the remaining strokes can
be considered as normal when generating a classi-
fier model, other external facts mentioned on CNN-
LSTM could also be a minor representative for the
incorrect labels.
Table 5: Confusion matrix for ConvLSTM and dataset D5
(true label vs predicted label).
tsf 494 8 0 0 3 0
tsb 3 405 6 1 26 0
b 2 2 335 0 7 0
ff 11 1 2 368 0 0
fb 1 13 6 0 369 0
r 0 0 0 0 0 366
tsf tsb b ff fb r
5.3 Discussion
The Core ML model obtained using Create ML
had, generically, a lower performance compared with
CMM-LSTM and ConvLSTM. In this model archi-
tecture, the batch size highly influences its perfor-
mance model while, in CNN-LSTM and ConvLSTM,
the influence of the variation on the batch size in the
obtained performance was reduced. On the Create
ML/Core ML model, D2 had the worst performance
compared to the remaining datasets tested. The prob-
able causes could be due to several factors. Firstly,
a low number of data samples were used when com-
pared to D1. Secondly having a window prediction
size of 1.74s allows noise impact more on the final
results when compared to the trimmed D4 version.
In summary, a maximum performance of 97.33%
was achieved on CNN-LSTM/D3 and ConvL-
STM/D5 pairs. Both CNN-LSTM and ConvLSTM
generated models showed difficulties in identifying
correctly the Flip (backhand) stroke with the confu-
sion matrices indicating a higher number of wrong la-
beled strokes between Top Spin (backhand) and Top
Flip (backhand). This is possibly due to the similari-
ties between those strokes. The dataset D5, contain-
ing a merge of the samples from D1 and D2 processed
with the SDA algorithm, should be the preferred
dataset for use in application training as the number
of samples is higher than the remaining datasets and,
in the end, presented a higher F1 score for the Con-
vLSTM architecture. This work uses a table tennis
classifier model that will be, in the near future, in-
tegrated into the Apple Watch wearable. Only one
device in the athlete’s wrist is needed to record mo-
tion data. In summary, the best-performing dataset
generated model classifier was trained based on 1564
samples, making it the second higher of the literature
review. Achieving a precision of 97.83% and an F1-
score of 97.33%, this classifier model can be consid-
ered one of the best solutions compared with the other
models presented in the literature.
6 CONCLUSION
One major contribution of this project is the approach
of vertical integration of ML models into a, future
planned, real-time mobile computing app solution for
identifying tennis table players’ strokes. As far as we
know, there are no similar public table tennis strokes
datasets to the ones presented in this paper. This work
planned a set of experiments for collecting sensor
data characterizing 6 activities of tennis table players
(cf. 5 stroke types and 1 in-between-strokes activity).
Classification of Table Tennis Strokes in Wearable Device using Deep Learning
635

Both, the methodology and the gathered data were
enabled by closer collaboration with several players
and coaches from local table tennis associations. The
best result, with the overall dataset D5, was clearly
obtained by the ConvLSTM model, with a maximum
performance of 97.33% F1 score, among the best re-
sults published in the literature.
6.1 Future Work
Currently, the trained ConvLSTM model, together
with the SDA algorithm, is in the process of being in-
corporated into a WatchOS app to be used in real-time
classification experiments involving a limited number
of volunteer table tennis players. In the medium term
commercial use and widespread acceptance among
table tennis players, tested classifiers should be sub-
ject to a broad number of sensor datasets, preferably
from players with different levels of competition.
ACKNOWLEDGEMENTS
This work was partially funded by: AppGenera-
tion Software Technologies Lda; by Base Funding -
UIDB/00027/2020 of the Artificial Intelligence and
Computer Science Laboratory - LIACC - funded by
national funds through the FCT/MCTES (PIDDAC);
and by Fundac¸
˜
ao Ensino e Cultura Fernando Pessoa.
REFERENCES
Barshan, B. and Y
¨
uksek, M. C. (2014). Recognizing
Daily and Sports Activities in Two Open Source Ma-
chine Learning Environments Using Body-Worn Sen-
sor Units. The Computer Journal, 57(11):1649–1667.
Blank, P., Hoßbach, J., Schuldhaus, D., and Eskofier, B. M.
(2015). Sensor-based stroke detection and stroke type
classification in table tennis. ISWC 2015 - Proceed-
ings of the 2015 ACM International Symposium on
Wearable Computers, 1(September):93–100.
Connaghan, D., Kelly, P., O’Connor, N. E., Gaffney, M.,
Walsh, M., and O’Mathuna, C. (2011). Multi-sensor
classification of tennis strokes. In Proceedings of
IEEE Sensors, pages 1437–1440.
Cust, E. E., Sweeting, A. J., Ball, K., and Robertson, S.
(2019). Machine and deep learning for sport-specific
movement recognition: a systematic review of model
development and performance. Journal of Sports Sci-
ences, 37(5):568–600.
Ferreira, N. (2021). Table Tennis Data Sets and Mod-
els. URL: https://github.com/MikaPower/ai ping
pong (accessed: 2021-10-28).
Kulkarni, K. M. and Shenoy, S. (2021). Table Tennis Stroke
Recognition Using Two-Dimensional Human Pose
Estimation. CVPR Sports Workshop 2021 (7th Inter-
national Workshop on Computer Vision in Sports).
Lim, S. M., Oh, H. C., Kim, J., Lee, J., and Park, J. (2018).
LSTM-Guided Coaching Assistant for Table Tennis
Practice. Sensors (Basel, Switzerland), 18(12):1–14.
Liu, R., Wang, Z., Shi, X., Zhao, H., Qiu, S., Li, J.,
and Yang, N. (2019). Table tennis stroke recognition
based on body sensor network, volume 11874 LNCS.
Springer International Publishing.
Neville, J., Wixted, A., Rowlands, D., and James, D. (2010).
Accelerometers: An underutilized resource in sports
monitoring. In Proceedings of the 2010 6th Inter-
national Conference on Intelligent Sensors, Sensor
Networks and Information Processing, ISSNIP 2010,
pages 287–290.
Ord
´
o
˜
nez, F. J. and Roggen, D. (2016). Deep Convo-
lutional and LSTM Recurrent Neural Networks for
Multimodal Wearable Activity Recognition. Sensors
2016, Vol. 16, Page 115, 16(1):115.
P
¨
arkk
¨
a, J., Ermes, M., Korpip
¨
a
¨
a, P., M
¨
antyj
¨
arvi, J., Peltola,
J., and Korhonen, I. (2006). Activity classification us-
ing realistic data from wearable sensors. IEEE Trans-
actions on Information Technology in Biomedicine,
10(1):119–128.
Roeder, L. (2021). Netron: viewer for neural network, deep
learning and machine learning models. URL: https://
github.com/lutzroeder/netron (accessed: 2021-10-28).
Sainath, T. N., Vinyals, O., Senior, A., and Sak, H. (2015).
Convolutional, long short-term memory, fully con-
nected deep neural networks. ICASSP, IEEE Inter-
national Conference on Acoustics, Speech and Signal
Processing - Proceedings, 2015-August:4580–4584.
Sensorsoscar, S., Lara, D., and Labrador, M. A. (2018). A
Survey on Human Activity Recognition using Wear-
able Sensors Oscar. IEEE COMMUNICATIONS SUR-
VEYS AND TUTORIALS, 15(3).
Shi, X., Chen, Z., Wang, H., Yeung, D.-Y., Wong, W.-k.,
and Woo, W.-c. (2015). Convolutional LSTM Net-
work: A Machine Learning Approach for Precipita-
tion Nowcasting. arXiv.
Thomas, B. (2021). Sensorlog, log and stream sensor
data. URL: https://apps.apple.com/us/app/sensorlog/
id388014573 (accessed: 2021-10-28).
Wu, Y., Lan, J., Shu, X., Ji, C., Zhao, K., Wang, J., and
Zhang, H. (2018). ITTVis: Interactive Visualization
of Table Tennis Data. IEEE Transactions on Visual-
ization and Computer Graphics, 24(1):709–718.
Xia, K., Huang, J., and Wang, H. (2020). LSTM-CNN Ar-
chitecture for Human Activity Recognition. IEEE Ac-
cess, 8:56855–56866.
Zeng, M., Nguyen, L. T., Yu, B., Mengshoel, O. J., Zhu, J.,
Wu, P., and Zhang, J. (2015). Convolutional Neural
Networks for human activity recognition using mobile
sensors. In Proceedings of the 2014 6th International
Conference on Mobile Computing, Applications and
Services, MobiCASE 2014, pages 197–205. Institute
of Electrical and Electronics Engineers Inc.
ICAART 2022 - 14th International Conference on Agents and Artificial Intelligence
636
