
Semi-Supervised Cloud Detection with Weakly Labeled RGB Aerial
Images using Generative Adversarial Networks
Toon Stuyck
1
, Axel-Jan Rousseau
2
, Mattia Vallerio
1
and Eric Demeester
3
1
BASF Antwerpen, BASF, Antwerpen, Belgium
2
Center for Statistics, Data Science Institute, UHasselt, Diepenbeek, Belgium
3
Department of Mechanical Engineering, ACRO Research Group, KU Leuven, Diepenbeek, Belgium
Keywords:
Generative Adversarial Networks, Cloud Detection, Structural Similarity, Image Segmentation, Anomaly
Detection, Semi-supervised Learning.
Abstract:
Despite extensive efforts, it is still very challenging to correctly detect clouds automatically from RGB images.
In this paper, an automated and effective cloud detection method is proposed based on a semi-supervised gen-
erative adversarial networks that was originally designed for anomaly detection in combination with structural
similarity. By only training the networks on cloudless RGB images, the generator network is able to learn
the distribution of normal input images and is able to generate realistic and contextually similar images. If an
image with clouds is introduced, the network will fail to recreate a realistic and contextually similar image.
Using this information combined with the structural similarity index, we are able to automatically and effec-
tively segment anomalies, which in this case are clouds. The proposed method compares favourably to other
commonly used cloud detection methods on RGB images.
1 INTRODUCTION
Due to the continuous development of satellite and
aerial imagery acquisition technology, the use of these
types of images is widely applied in various re-
search fields such as environmental monitoring and
protection, geographical surveying, military recon-
naissance, agriculture engineering and exploitation of
mineral resources. According to (King et al., 2013),
clouds cover at least 67% of the earth’s surface at
any given time, hence many of the available satellite
and aerial images will contain clouds. These clouds
cover areas of interest on the earth’s surface and thus
lead to inaccurate analysis and interpretation (Saun-
ders, 1986; Saunders and Kriebel, 1988). The abil-
ity to automatically detect clouds is a necessity for
many of the aforementioned research fields in order
to increase accuracy of following algorithms such as
image retrieval (Ferecatu and Boujemaa, 2007; Tao
et al., 2009) and image classification (Melgani and
Bruzzone, 2004).
Multiple cloud detection methodologies have been
proposed, but most of these have been designed for
sensors like Advanced Very High Resolution Ra-
diometer (AVHRR) and Moderate Resolution Imag-
ing Spectroradiometer (MODIS). However, for our
proposed method, the focus lies on cloud detection
based on RGB aerial images. Many of the exist-
ing cloud detection methods can be classified in two
possible categories: threshold based ones (Zhang and
Xiao, 2014) and machine learning based ones (Movia
et al., 2016; Ozkan et al., 2018; Xie et al., 2017).
In this paper a cloud detection method based on
deep learning using an unsupervised Generative Ad-
versarial Network (GAN) in combination with struc-
tural similarity (SSIM) is proposed. Several stud-
ies show that GANs have great potential to address
anomaly detection problems. GANs have very re-
cently been used successfully in multiple anomaly
detection scenarios such as X-ray screening (Akcay
et al., 2018) and in medical imaging (Yang et al.,
2021). In the case of cloud detection on aerial images,
clouds could be identified as anomalies since they are
not desired to be on the image.
The remainder of the paper is organized as fol-
lows. Section 2 introduces related work. Section 3
describes the GAN used together with structural simi-
larity which has been used for the automated segmen-
tation of clouds. Section 4 presents the experimen-
tal results and comparisons to demonstrate the perfor-
mance of our proposed method as well as limitations.
Section 5 reports final conclusions.
630
Stuyck, T., Rousseau, A., Vallerio, M. and Demeester, E.
Semi-Supervised Cloud Detection with Weakly Labeled RGB Aerial Images using Generative Adversarial Networks.
DOI: 10.5220/0010871500003122
In Proceedings of the 11th International Conference on Pattern Recognition Applications and Methods (ICPRAM 2022), pages 630-635
ISBN: 978-989-758-549-4; ISSN: 2184-4313
Copyright
c
2022 by SCITEPRESS – Science and Technology Publications, Lda. All rights reserved

2 RELATED WORK
A short overview of related work regarding to our pro-
posed method will be presented in this section. The
topics reviewed are semi-supervised anomaly detec-
tion and cloud detection in aerial RGB images.
Semi-Supervised Anomaly Detection. Two of the
most common ways for anomaly detection on weakly
labeled data are to use either GANs or Variational Au-
toencoders (VAEs) (Kiran et al., 2018). Both anomaly
detection methods are able to produce labels or scores
as outputs. However, if there is a need to locate
and segment the anomalies, GANs are more appro-
priate since VAEs will introduce noise and will have
more blurred reconstructions (Dosovitskiy and Brox,
2016). For this reason the focus for the remainder of
the paper will be limited to GANs. One of the most
important developments in anomaly detection using
GAN has been made by (Schlegl et al., 2017). The
downside of this work is the fact that it is computa-
tionally demanding. Later, (Akc¸ay et al., 2019) inves-
tigated an adversarial network with skip-connections
which resulted in higher performance regarding prior
state-of-the-art.
Cloud Detection in Aerial RGB Images. Many
cloud detection methods have been proposed for
multi-spectral data (Li et al., 2021; Br
´
eon and Colzy,
1999; Frey et al., 2008; Ackerman et al., 2008).
(Ozkan et al., 2018) proposed a deep pyramid net-
work which was enhanced with a pre-trained param-
eter model at the encoder layer which gave satisfying
results. This method works with low-orbit Gokturk-
2 and RASAT satellites images. Sadly, these meth-
ods do not translate well to cloud detection in RGB
images. Only limited work has been done regarding
specific algorithms for cloud detection in RGB aerial
images. (Chan and Vese, 2001) proposed a model
for active contours to detect objects in a given im-
age. This method was not specifically designed with
cloud detection in mind, but it is still used in some
cases. (Zhang and Xiao, 2014) proposed a progressive
refinement scheme which was derived based on ob-
servations and statistical results. Other work was not
found regarding automated cloud segmentation based
on aerial RGB images.
3 METHOD
3.1 Overview of the Method
A novel approach for automated detection and seg-
mentation of clouds on weakly labeled RGB aerial
images is proposed using Skip-GANomaly (Akc¸ay
et al., 2019). This method uses two competing net-
works. The first network, called the Generator (G),
has the objective to capture the distribution of the in-
put dataset (aerial images without clouds) by identify-
ing relevant features and generating new images. The
second network, referred to as the Discriminator (D),
has the objective to classify the images generated by
the Generator to the correct class (i.e. original vs.
generated). A high-level overview of this approach
is shown in Fig. 1. Using structural similarity (Wang
et al., 2004) local deviations between the input im-
age and the generated features can be captured. This
information can be used for the automated detection
and segmentation of clouds.
3.2 Anomaly Detection using
Skip-GANomaly
(Akc¸ay et al., 2019) proposed an approach using
GAN for anomaly detection called Skip-GANomaly
which has been used in our proposal. In this method
both networks are trained adversarially so that the
conceptual model is only trained on normal samples,
i.e. aerial images without clouds, but tested on both
images with and without clouds. Suppose a set of
aerial images denoted as D = {x
i
, y
i
}
N
i=1
, where x
i
de-
notes the i-th aerial image from the possible distri-
bution of images p
x
and y
i
∈ [0, 1] denotes whether
or not the input image contains clouds. By train-
ing only on aerial images without clouds, we expect
the model to successfully reconstruct images without
clouds, but to fail on aerial images where clouds are
present, since the model was never trained for these
abnormal images. For this reason we expect a higher
loss for the reconstruction of abnormal images. The
model was trained using a combination of three differ-
ent loss functions as proposed in (Akc¸ay et al., 2019).
The first loss function is the adversarial loss
(L
adv
) which is given by (1). This loss function has
the goal to maximize the reconstruction capability of
cloudless input images. This means that the generator
G generates an image ˆx from an orginal image x which
comes from the distribution of all possible images p
x
as close as possible to the dataset of cloudless train-
ing images while the discriminator tries to classify the
different images as original (real) or generated (fake).
This function needs to be minimized for G and maxi-
mized for D.
L
adv
= E
x∼p
x
[log D(x)]+ E
x∼p
x
[log (1 − D( ˆx))] (1)
The second loss function is the contextual loss (L
con
).
While the adversarial loss makes sure that realistic
images are generated, it does not ensure contextual
similarity. This can be guaranteed by the contextual
Semi-Supervised Cloud Detection with Weakly Labeled RGB Aerial Images using Generative Adversarial Networks
631
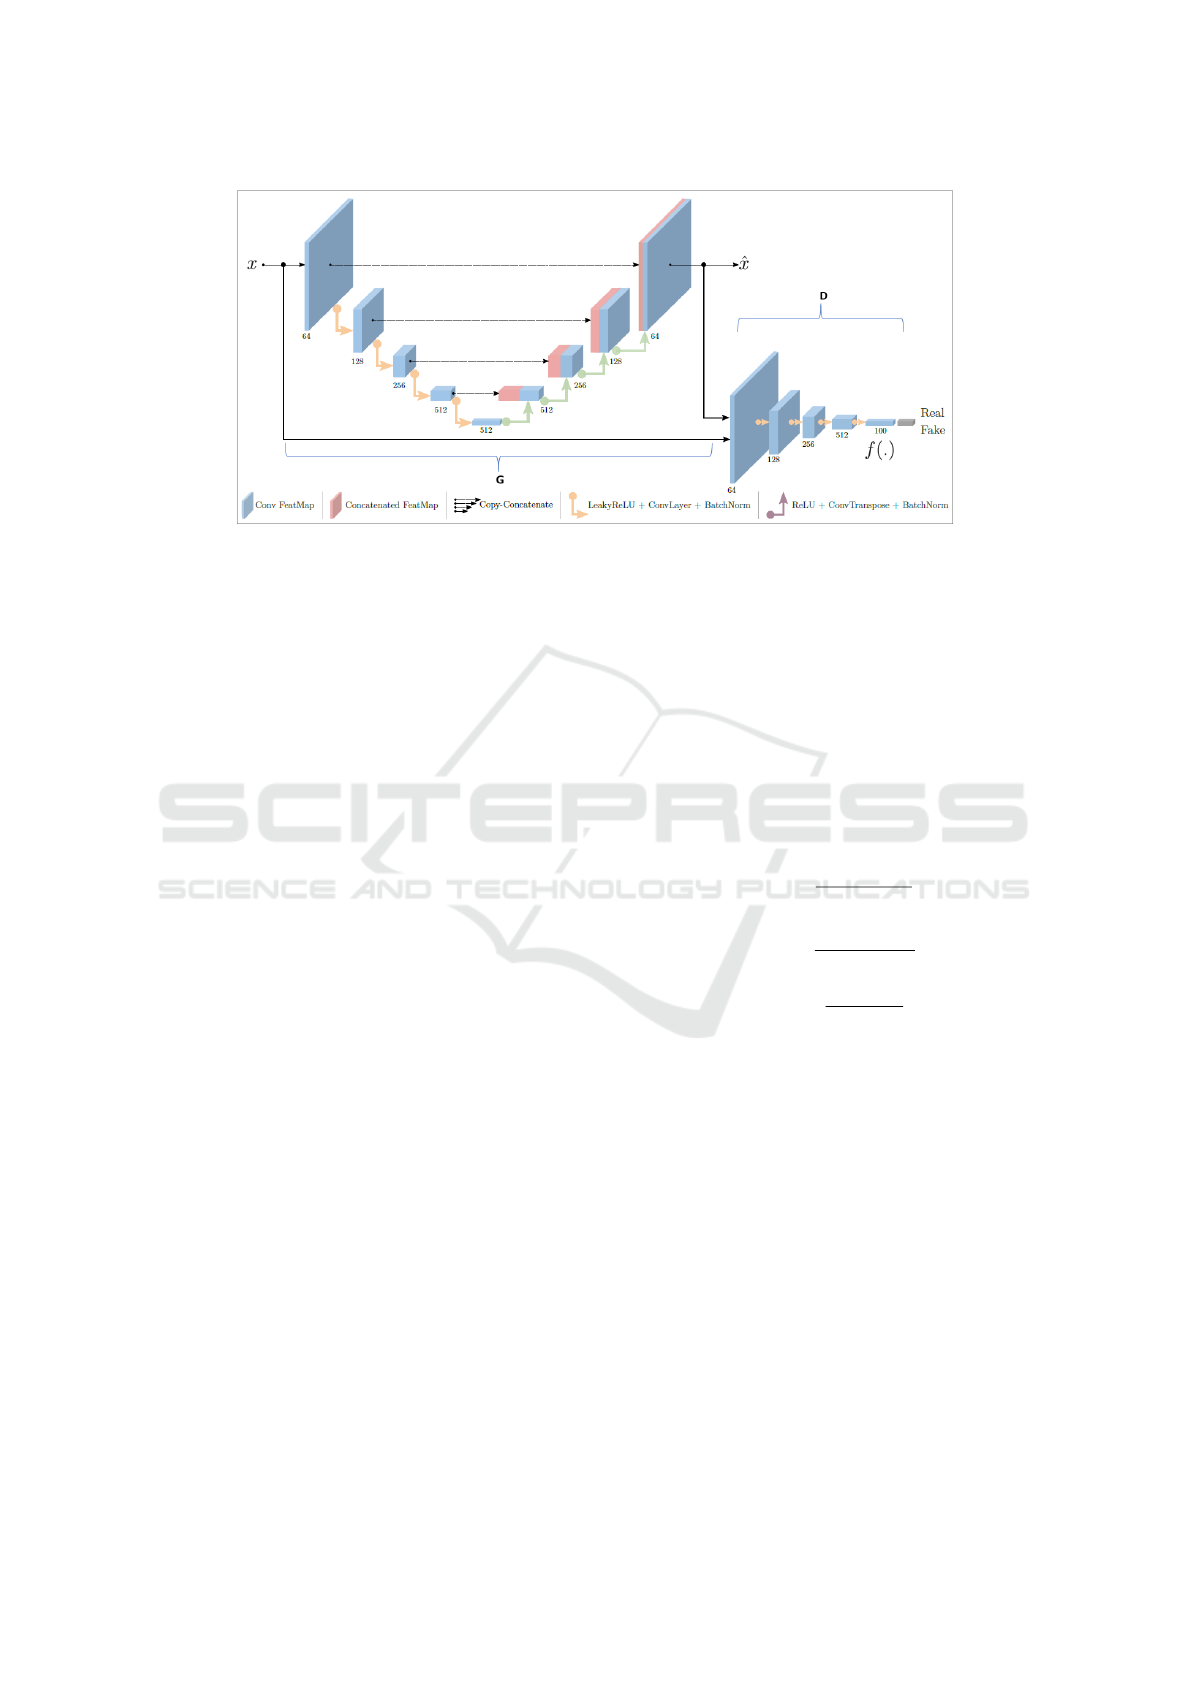
Figure 1: Overview of the proposed generative adversarial network by and taken from (Akc¸ay et al., 2019).
loss which is given in (2), where | · |
1
is the L
1
norm.
Using the L
1
norm ensures contextual similarity be-
tween the original and generated images.
L
con
= E
x∼p
x
| x − ˆx |
1
(2)
The final loss function is the latent loss L
lat
. This
loss is defined in (3) and ensures that besides generat-
ing realistic images, we can also reconstruct the latent
representation of x and ˆx as similar as possible. The
latent representations of x and ˆx are given by z = f (x)
and ˆz = f ( ˆx).
L
lat
= E
x∼p
x
| f (x) − f ( ˆx) |
2
(3)
The final training objective is the weighted sum of the
losses and is given as:
L = λ
adv
L
adv
+ λ
con
L
con
+ λ
lat
L
lat
, (4)
here λ
adv
, λ
con
and λ
lat
are coefficients to trade off
the importance between the three loss terms. Finding
the optimal values for these coefficients is a classic
multi-objective problem which can be solved using
trial and error or by using a multi-objective optimiza-
tion method (Nimmegeers et al., 2019).
Finally in order to know if clouds are present
in the images, an anomaly score has been proposed
in (Schlegl et al., 2017). For a given image x , the
anomaly score becomes:
A(x) = λR(x) + (1 − λ)L(x). (5)
Here R(x) is the reconstruction score which is based
on (2). L(x) is the latent representation score which
is based on (3) and λ is a coefficient controlling the
importance of the two scoring functions.
3.3 Automated Segmentation using
Structural Similarity
Using the architecture explained above, we are able
to recreate realistic and contextually similar images
compared to the input image. In case we introduce
an image with an anomaly (i.e. a cloud) the recon-
struction will still be successful except for that part of
the image where the anomaly is located. Using this
knowledge we can automatically segment the anoma-
lies in the original image x and the generated image ˆx
using structural similarity (SSIM).
Instead of only looking at absolute differences be-
tween pixel values for the comparison, structural sim-
ilarity, as first proposed by (Wang et al., 2004), is
based on three components: luminance (l), contrast
(c) and structure (s) which are given as:
l(x, ˆx) =
2µ
x
µ
ˆx
+ c
1
µ
2
x
+ µ
2
ˆx
+ c
1
, (6)
c(x, ˆx) =
2σ
x
σ
ˆx
+ c
2
σ
2
x
+ σ
2
ˆx
+ c
2
, (7)
s(x, ˆx) =
σ
x ˆx
+ c
3
σ
x
σ
ˆx
+ c
3
, (8)
with µ
x
and µ
ˆx
the average of x and ˆx, σ
2
x
and σ
2
ˆx
the
variance of x and ˆx , σ
x ˆx
the covariance of x and ˆx and
c
1
, c
2
and c
3
variables for stabilization of the division.
SSIM is then given as the combination of the three
components:
SSIM(x, ˆx) = l(x, ˆx) · c(x, ˆx) · s(x, ˆx). (9)
A SSIM value can be calculated for each pixel using a
sliding window. A low SSIM value means a great dif-
ference between the two images and thus the presence
of an anomaly at the pixel of interest.
4 EXPERIMENTAL RESULTS
The network was trained on a dataset taken from
(Srinivas, 2020) which consists of a subset of 1250
ICPRAM 2022 - 11th International Conference on Pattern Recognition Applications and Methods
632
aerial images without clouds and validated on a differ-
ent subset containing 250 cloudless aerial images and
100 aerial images with clouds. The original dataset
did not contain ground truth segmentations for the
images with clouds. These have been manually seg-
mented by the author. During training this dataset was
artificially enlarged using traditional data augmenta-
tion techniques, such as flipping, adding noise, crop-
ping, rotation, etc.. Note that in the dataset in the sub-
folder ”noncloud” some images have been manually
relabeled, since they were wrongly labeled as non-
cloud but in fact did contain clouds.
For the training of the network itself, similar pa-
rameters as in (Akc¸ay et al., 2019) have been adapted,
since they showed these give best overall results.
Adam has been used as the optimizer with initial
learning rate 0.002 and lambda decay. The momen-
tums are β
1
= 0.5 and β
1
= 0.999. The coefficients
of the final training objective L have been set as
λ
adv
= 1, λ
rec
= 40 and λ
lat
= 1. The network has
been trained three different times, each time with the
same parameters, but with a different input image
size. The different networks have been trained for
images of input size 32 × 32, 64 × 64 and 128 × 128.
For every new image to be labeled and if needed seg-
mented, patches of these sizes are taken so that all
possible sizes of input images can be used. The re-
sults of these different networks for each patch size
gets combined in order to obtain more robust auto-
mated segmentation of clouds. Each network was
trained multiple times for 20 epochs and the best re-
sult for each network was selected. Experiments are
performed using a PC with an Intel i7-10850h at 2.7
GHz and a NVIDIA Quadro RTX 4000 GPU.
4.1 Comparison with Other Methods
We compare our cloud detection method based on
GAN combined with structural similarity with Chan-
Vese (Chan and Vese, 2001) and (Zhang and Xiao,
2014). We also wanted to compare our approach with
other and more recent approaches. However, as stated
in section 2, only limited work has been done regard-
ing specific algorithms for cloud detection in RGB
images. Many cloud detection methods for multi-
spectral images exist and give good results, however
these do not translate well to cloud detection in RGB
images.
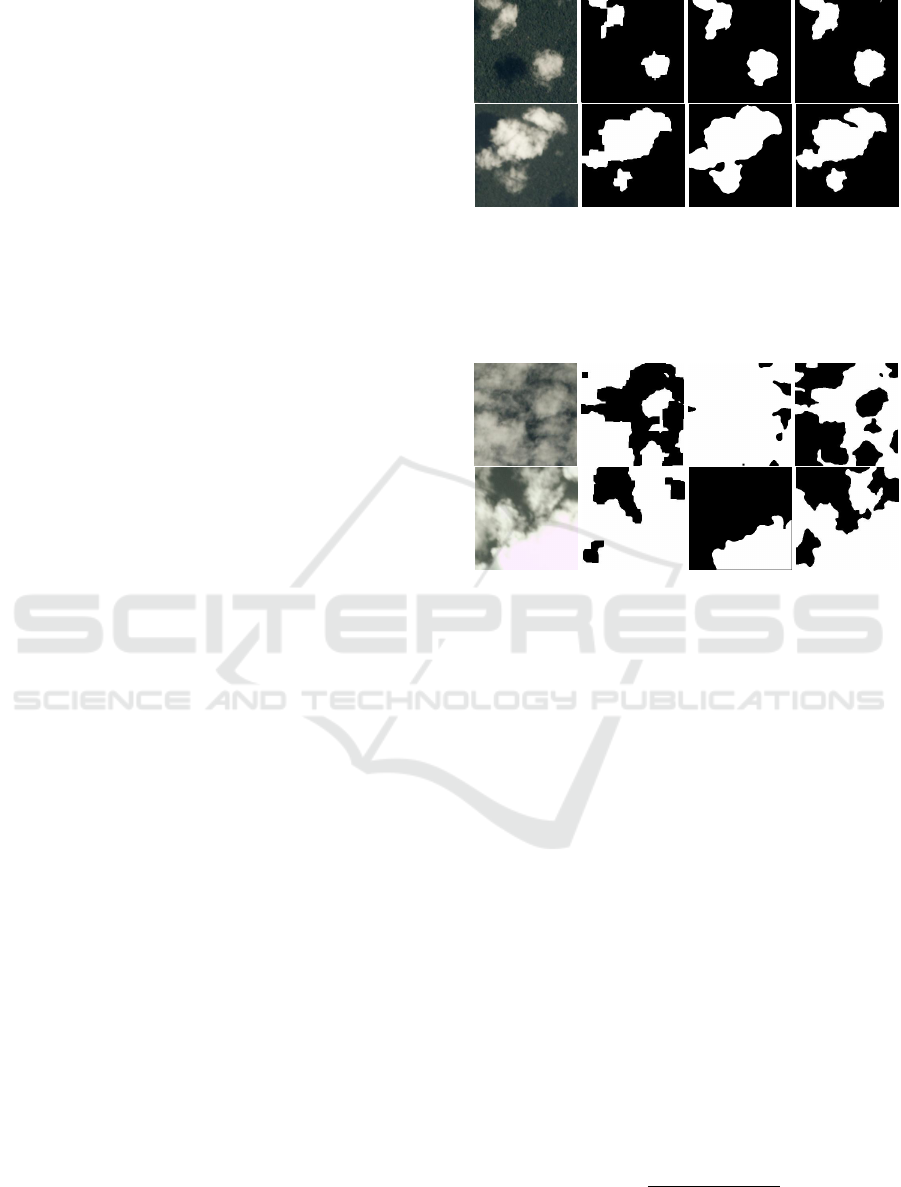
Fig. 2, Fig. 3 and Fig. 4 show visual examples
of our method compared to the others. White pixels
indicate clouds, while black pixels indicate the back-
ground. Fig. 2 shows that all methods are good in
segmenting individual clear clouds. Fig. 3 shows that
in case thin and thick clouds are combined the other
(a) Original
image
(b) Our
method
(c) Method by
(Zhang and
Xiao, 2014)
(d) Chan-Vese
(Chan and
Vese, 2001)
Figure 2: In case of clear clouds and backgrounds, all meth-
ods are able to perform good automated segmentation of
clouds.
(a) Original
image
(b) Our
method
(c) Method by
(Zhang and
Xiao, 2014)
(d) Chan-Vese
(Chan and
Vese, 2001)
Figure 3: In case most part of the image is covered by
clouds (with different transparency) our method outper-
forms the other two in our validation set.
methods perform worse than ours. Fig. 4 shows re-
sults where all methods give poor results. The top
original image in this figure contains haze combined
with clouds. The bottom original image contains
rivers in the background. It appears the training set
did not contain enough training images for the G net-
work to learn the complete distribution of possible
input images. The generator fails to correctly gen-
erate these images leading to misidentification of the
river and part of the haze as clouds. (Zhang and Xiao,
2014) proposed method also has difficulties in cor-
rectly segmenting the clouds in figure 3 and figure
4. The reason for this is the fact that the method is
based on observations and statistics. If there is a lot
of variation in the background or many thin, transpar-
ent clouds, the method loses part of its robustness.
The Dice coefficient also known as F1-score, de-
fined as follows, is used to numerically quantify our
segmentation results:
Dice =
2T P
2T P + FP + FN
, (10)
where T P, FP and FN respectively denote the num-
ber of true positives, the number of false positives and
Semi-Supervised Cloud Detection with Weakly Labeled RGB Aerial Images using Generative Adversarial Networks
633
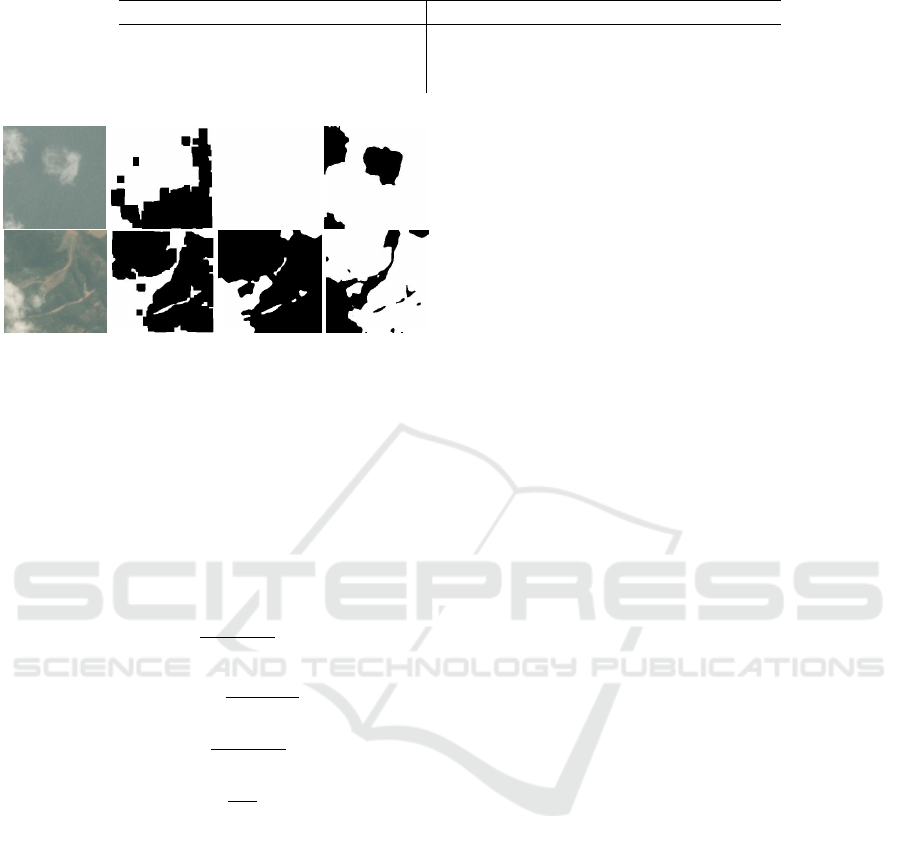
Table 1: Quantitative evaluation of different methods on our used dataset.
Method Dice ER Precision Recall FAR
Chan-Vese (Chan and Vese, 2001) 0.05 0.51 0.60 0.03 0.40
Method by (Zhang and Xiao, 2014) 0.68 0.03 0.91 0.65 0.09
Our approach 0.70 0.03 0.78 0.77 0.22
(a) Original
image
(b) Our
method
(c) Method by
(Zhang and
Xiao, 2014)
(d) Chan-Vese
(Chan and
Vese, 2001)
Figure 4: In the case haze, or a lot of variation in the back-
ground is present all methods have difficulties with seg-
menting the clouds.
the number of false negatives. Besides the Dice coef-
ficient, four other metrics are used to compare the pro-
posed algorithm with the others. These metrics are the
error rate (ER), precision, recall and false alarm rate
(FAR) and are given as:
ER =
FP + FN
#pixels
, (11)
precision =
T P
T P + FP
, (12)
recall =
T P
T P + FN
, (13)
FAR =
FP
GN
, (14)
where #pixels is the total number of pixels and
GN is the number of cloud pixels in ground truth. A
good cloud detection method should have high val-
ues for precision and recall and low values for ER
and FAR. Table 1 shows the evaluation of the metrics
on our used dataset for the different cloud detection
methods. It is clear that (Zhang and Xiao, 2014) and
our method greatly outperform Chan-Vese, and that
our proposed method is in general better than (Zhang
and Xiao, 2014) expect that it suffers from a higher
FAR and thus also has a lower precision.
The fact that our method gets a lower precision
and thus also a higher FAR can be brought back to
the fact that our training set did not contain enough
samples of all possible backgrounds to ensure that our
Generator network is able to learn the complete distri-
bution. If a distribution is not completely learned, this
will result in a high number of false positives which,
according to (12) and (14) will have a negative impact
on the precision and FAR metrics.
It should be noted that this paper as well as (Zhang
and Xiao, 2014) validated other methods on an own
dataset, however both (Zhang and Xiao, 2014) and
(Chan and Vese, 2001) scored significantly lower on
the dataset used in this paper compared to the reported
results of (Zhang and Xiao, 2014). Since we were not
able to access the dataset of (Zhang and Xiao, 2014)
it is unclear how our dataset and the dataset used in
their validation compare to each other.
5 CONCLUSION
In this paper, an effective and robust semi-supervised
method is proposed for automated segmentation of
clouds on weakly labeled RGB aerial images. The
method employs a generative adversarial network for
anomaly detection which makes the method invari-
ant to scale and orientation changes. Due to the loss
functions used, realistic and contextual similar images
are generated except for images that contain anoma-
lies. Using structural similarity combined with this
knowledge, the proposed method is able to automat-
ically identify and segment cloud regions. Evalua-
tion shows that the proposed method achieves better
performance compared to two other frequently used
methods for cloud detection on RGB images, even
though our method was never shown images of clouds
during training. However, due to the limited train-
ing data our generator network was not able to fully
learn the distribution of possible input images. This
means that our method still suffers from a relatively
high false alarm rate. Many of the methods using
multi-spectral data are supervised and give good re-
sults on this type of data. In general it can be ex-
pected that supervised learning leads to better results
than semi- or unsupervised learning. However semi-
or unsupervised learning might get the preference in
the industry since development is less time and effort
consuming. Besides this, deep learning methods are
also expected to be more robust compared to methods
that are based on observations and statistical results.
To make sure our expectations are correct, we would
like to acquire more training data in order to confirm
ICPRAM 2022 - 11th International Conference on Pattern Recognition Applications and Methods
634

that the false alarm rate would decrease and overall
Dice score would increase further. In the future, we
would like to adapt our work in order to handle dif-
ferent image types, e.g. infrared images as well as
the combination of images and depth information. In
addition, we would also like to validate this approach
for the automated detection and segmentation of foam
in a chemical production installation.
ACKNOWLEDGEMENTS
We would like to thank VLAIO and BASF Antwerpen
for funding the project (HBC.2020.2876).
REFERENCES
Ackerman, S., Holz, R., Frey, R., Eloranta, E., Maddux,
B., and McGill, M. (2008). Cloud detection with
modis. part ii: validation. Journal of Atmospheric and
Oceanic Technology, 25(7):1073–1086.
Akcay, S., Atapour-Abarghouei, A., and Breckon, T. P.
(2018). Ganomaly: Semi-supervised anomaly detec-
tion via adversarial training. In Asian conference on
computer vision, pages 622–637. Springer.
Akc¸ay, S., Atapour-Abarghouei, A., and Breckon, T. P.
(2019). Skip-ganomaly: Skip connected and adversar-
ially trained encoder-decoder anomaly detection. In
2019 International Joint Conference on Neural Net-
works (IJCNN), pages 1–8. IEEE.
Br
´
eon, F.-M. and Colzy, S. (1999). Cloud detection from the
spaceborne polder instrument and validation against
surface synoptic observations. Journal of Applied Me-
teorology, 38(6):777–785.
Chan, T. F. and Vese, L. A. (2001). Active contours with-
out edges. IEEE Transactions on image processing,
10(2):266–277.
Dosovitskiy, A. and Brox, T. (2016). Generating images
with perceptual similarity metrics based on deep net-
works. Advances in neural information processing
systems, 29:658–666.
Ferecatu, M. and Boujemaa, N. (2007). Interactive remote-
sensing image retrieval using active relevance feed-
back. IEEE Transactions on Geoscience and Remote
Sensing, 45(4):818–826.
Frey, R. A., Ackerman, S. A., Liu, Y., Strabala, K. I., Zhang,
H., Key, J. R., and Wang, X. (2008). Cloud detection
with modis. part i: Improvements in the modis cloud
mask for collection 5. Journal of atmospheric and
oceanic technology, 25(7):1057–1072.
King, M. D., Platnick, S., Menzel, W. P., Ackerman, S. A.,
and Hubanks, P. A. (2013). Spatial and temporal dis-
tribution of clouds observed by modis onboard the
terra and aqua satellites. IEEE transactions on geo-
science and remote sensing, 51(7):3826–3852.
Kiran, B. R., Thomas, D. M., and Parakkal, R. (2018).
An overview of deep learning based methods for un-
supervised and semi-supervised anomaly detection in
videos. Journal of Imaging, 4(2):36.
Li, L., Li, X., Jiang, L., Su, X., and Chen, F. (2021). A
review on deep learning techniques for cloud detec-
tion methodologies and challenges. Signal, Image and
Video Processing, pages 1–9.
Melgani, F. and Bruzzone, L. (2004). Classification of hy-
perspectral remote sensing images with support vector
machines. IEEE Transactions on geoscience and re-
mote sensing, 42(8):1778–1790.
Movia, A., Beinat, A., and Crosilla, F. (2016). Shadow de-
tection and removal in rgb vhr images for land use
unsupervised classification. ISPRS Journal of Pho-
togrammetry and Remote Sensing, 119:485–495.
Nimmegeers, P., Vallerio, M., Telen, D., Van Impe, J., and
Logist, F. (2019). Interactive multi-objective dynamic
optimization of bioreactors under parametric uncer-
tainty. Chemie Ingenieur Technik, 91(3):349–362.
Ozkan, S., Efendioglu, M., and Demirpolat, C. (2018).
Cloud detection from rgb color remote sensing images
with deep pyramid networks. In IGARSS 2018-2018
IEEE International Geoscience and Remote Sensing
Symposium, pages 6939–6942. IEEE.
Saunders, R. (1986). An automated scheme for the re-
moval of cloud contamination from avhrr radiances
over western europe. International Journal of Remote
Sensing, 7(7):867–886.
Saunders, R. W. and Kriebel, K. T. (1988). An improved
method for detecting clear sky and cloudy radiances
from avhrr data. International Journal of Remote
Sensing, 9(1):123–150.
Schlegl, T., Seeb
¨
ock, P., Waldstein, S. M., Schmidt-Erfurth,
U., and Langs, G. (2017). Unsupervised anomaly de-
tection with generative adversarial networks to guide
marker discovery. In International conference on in-
formation processing in medical imaging, pages 146–
157. Springer.
Srinivas, A. (2020). Cloud and non-cloud images(anomaly
detection).
Tao, L., Yuan, L., and Sun, J. (2009). Skyfinder: attribute-
based sky image search. ACM transactions on graph-
ics (TOG), 28(3):1–5.
Wang, Z., Bovik, A. C., Sheikh, H. R., and Simoncelli, E. P.
(2004). Image quality assessment: from error visi-
bility to structural similarity. IEEE transactions on
image processing, 13(4):600–612.
Xie, F., Shi, M., Shi, Z., Yin, J., and Zhao, D. (2017). Multi-
level cloud detection in remote sensing images based
on deep learning. IEEE Journal of Selected Topics
in Applied Earth Observations and Remote Sensing,
10(8):3631–3640.
Yang, Y., Chen, J., Wang, R., Ma, T., Wang, L., Chen, J.,
Zheng, W.-S., and Zhang, T. (2021). Towards unbi-
ased covid-19 lesion localisation and segmentation via
weakly supervised learning. In 2021 IEEE 18th Inter-
national Symposium on Biomedical Imaging (ISBI),
pages 1966–1970. IEEE.
Zhang, Q. and Xiao, C. (2014). Cloud detection of rgb color
aerial photographs by progressive refinement scheme.
IEEE Transactions on Geoscience and Remote Sens-
ing, 52(11):7264–7275.
Semi-Supervised Cloud Detection with Weakly Labeled RGB Aerial Images using Generative Adversarial Networks
635
