
A Calibration-free Blood Pressure Measurement on a Scale: Concept and
Challenges
Christian Wiede
1 a
, Carolin Wuerich
1 b
and Anton Grabmaier
1,2 c
1
Fraunhofer IMS, Finkenstrasse 61, Duisburg, Germany
2
University Duisburg-Essen, Bismarckstrasse 81, Duisburg, Germany
Keywords:
Calibration-free Blood Pressure Measurement, Artificial Intelligence, Feature Extraction, Body Scale, PPG,
ECG, BCG.
Abstract:
Two health parameters are most relevant for self-monitoring of hypertension: blood pressure and body weight.
Blood pressure is normally measured with a blood pressure cuff, whereas body weight can be measured with
a simple body scale. If it is possible to integrate blood pressure measurement into easy-to-use body scales,
patients will benefit from simpler use and lower overall price. The aim of this work is to develop a body
scale with which blood pressure can be measured without calibration and without the need for additional
devices. This can be realised by considering surrogate parameters for blood pressure. Starting from sensors
such as electrodes, photo diodes and pressure transducers, various biosignals such as ECG, BCG, PPG or
bioimpedance are extracted from the sole of the foot. The signal is reduced to morphological features which
serve as input to a neural network for blood pressure determination. The integrated artificial intelligence
(AI) is to be implemented in an energy-efficient way on an embedded system. In addition, the energy-efficient
implementation ensures battery operation for several months with daily use. Besides the concept, the strengths,
weaknesses, threats and opportunities of this concept are examined in detail within the framework of a SWOT
analysis. This includes considerations of hardware, software, data and user experience.
1 INTRODUCTION
High blood pressure is one of the main causes of coro-
nary heart disease, stroke and kidney failure. In the
EU alone, more than 103 million people suffer from
high blood pressure, which is a quarter of the popula-
tion (European Commission, 2021). Excess weight in
particular increases the risk of developing high blood
pressure and the severity of possible secondary dis-
eases. Therefore, it is very important to measure
blood pressure regularly and above all in correlation
with weight. In this way, appropriate countermea-
sures, such as the dosage of medication, can be ini-
tiated in time. Weight is usually recorded by a body
scale which is easy to handle. Blood pressure, on the
other hand, has to be measured with a blood pressure
cuff.
The idea of this work is to extend the simplicity of
a scale by the functionality of a blood pressure mea-
a
https://orcid.org/0000-0002-2511-4659
b
https://orcid.org/0000-0003-0917-2696
c
https://orcid.org/0000-0002-4882-4223
surement and thus to avoid the complex measurement
process by means of a blood pressure cuff. Thereby,
the particular challenge is to develop a calibration-
free blood pressure measurement method. Existing
solutions for blood pressure measurement via a body
scale require regular calibration with a blood pressure
cuff. This is due to the individual physiological char-
acteristics of the cardiovascular system of each per-
son, which can change due to ageing and other in-
fluences. This is to be addressed by implementing
machine learning methods based on biosignals such
as ECG, PPG, BCG or bio-impedance. Furthermore,
an energy-efficient implementation is necessary to en-
sure battery operation.
This paper is structured as follows: Section 2 re-
views state-of-the-art methods for determining blood
pressure. In the third section, we present our con-
cept for determining blood pressure on a body scale.
Based on this, a discussion of challenges and risks of
this approach is given in section 4. In section 5, we
summarise the results and give an outlook on further
steps.
208
Wiede, C., Wuerich, C. and Grabmaier, A.
A Calibration-free Blood Pressure Measurement on a Scale: Concept and Challenges.
DOI: 10.5220/0010873100003123
In Proceedings of the 15th International Joint Conference on Biomedical Engineering Systems and Technologies (BIOSTEC 2022) - Volume 4: BIOSIGNALS, pages 208-214
ISBN: 978-989-758-552-4; ISSN: 2184-4305
Copyright
c
2022 by SCITEPRESS – Science and Technology Publications, Lda. All rights reserved

2 RELATED WORK
Measuring blood pressure is necessary to draw con-
clusions about the condition and diseases of the car-
diovascular system. There are different ways of mea-
suring it. The most accurate method is the invasive
method using an inserted catheter with a pressure sen-
sor (Pielmus et al., 2021). In addition, invasive blood
pressure measurement is characterised by continu-
ous measurement, so that it is the method of choice
during high risk surgeries and in the intensive care
unit. However, there is a risk of bleeding or infection,
which limits its use especially for daily usage.
The indirect measurement of arterial blood pres-
sure, which is commonly used in everyday life, is car-
ried out by measuring the pressure on the upper arm
using a sphygmomanometer (Riva-Rocci method).
By increasing and decreasing the pressure in the cuff,
the blood pressure can be determined auscultatorily,
palpatorily or oscillatorily. The measurement is less
accurate than the invasive measurement and is not
continuous. On the other hand, it is fast, inexpen-
sive and without great risks. Nevertheless, regular
measurements are perceived as burdensome for pa-
tients. This class of devices also includes blood pres-
sure measurements on the wrist or fingers.
New approaches in research focus at the pho-
toplethysmogram (PPG) more closely (Paviglianiti
et al., 2020; Yan et al., 2019; Kachuee et al., 2017)
and are less stressful to wear or even completely con-
tactless (Nakano et al., 2018; Murakami et al., 2015;
Fan et al., 2020; Jeong and Finkelstein, 2016). A
distinction can be made between time-of-flight mea-
surements and feature-based methods (Shin and Park,
2012). The analysis of the pulse transit time (PTT),
which means the time delay of a pulse wave, and the
pulse arrival time (PAT), which is the time between
the electrical excitation of the heart and the arrival of
the pulse wave, are two common methods for cuffless
blood pressure measurement. PPG is used to measure
the propagation time of the pulse wave between two
skin sites or the temporal shift between ECG and PPG
signal. A relationship between these values and blood
pressure can be established via a regression analysis
(Shin and Park, 2012; Oreggia et al., 2015).
Few works (Carek et al., 2019; Martin et al.,
2016; Shin and Park, 2012) investigate and imple-
ment standing blood pressure measurement systems
based on a combination of ECG, a ballistocardiogram
(BCG) for recording the heartbeat or a PPG sensor,
whereby all signals are measured at the foot. Shin
and Park performed a synchronised averaging of the
ECG signal based on the corresponding BCG peak lo-
cation in order to reduce the influence of electromyo-
gram (EMG) noise from leg muscles. The subsequent
blood pressure estimation is based only on the tem-
poral difference between the R-peak from ECG and
the J-peak from BCG, where the correlation is estab-
lished by a linear regression. Carek et al. and Mar-
tin et al., on the other hand, use PPG and BCG to
calculate a delay. However, the drawback of these
approaches is that their blood pressure determination
methods are all based on an (regular) individual cal-
ibration of the regression curve to the specific char-
acteristics (e.g. age, height, vascular stiffness) of the
patient. They are therefore cumbersome to use and
require maintenance. A single pulse delay value can-
not provide enough information to determine systolic
and diastolic blood pressure.
Yet, (Paviglianiti et al., 2020; Kachuee et al.,
2017) show that it is possible to develop an univer-
sal model based on ECG and PPG that does not re-
quire individual calibration. Their models consider
morphological signal features as well as the temporal
relationship between PPG and ECG. Various studies
(Sun et al., 2016; Singla et al., 2019; Lin et al., 2017)
show that morphological PPG features can improve
prediction accuracy compared to delay-based features
only. While PTT and PAT exhibit a strong correla-
tion with blood pressure, a single PPG signal can be
sufficient for blood pressure estimation (Rundo et al.,
2018; Xing and Sun, 2016). It has to be noted that
their signals are measured at the wrist, finger or up-
per body, where ECG and PPG can be derived with
higher quality than at the foot.
In parallel to the scientific publications, it was in-
vestigated which products and patents exist. There are
scales, e.g. from the Withings company (Buard et al.,
2016), which can determine blood pressure via a PAT
measurement. However, all currently marketed scales
require a calibration procedure and are therefore com-
plicated to operate.
3 METHOD
3.1 Overview
In this section we present our idea of a calibration-
free blood pressure measurement via a body scale and
present the different steps of the processing. Figure 1
shows the single steps graphically. The process be-
gins with the selection of suitable sensors, a compu-
tation unit, the embedded system, its electrical wiring
and its placement and integration into the scale body.
From these sensors, synchronised biosignals such as
ECG, BCG or PPG are subsequently extracted. Based
on these time and frequency signals, special morpho-
A Calibration-free Blood Pressure Measurement on a Scale: Concept and Challenges
209
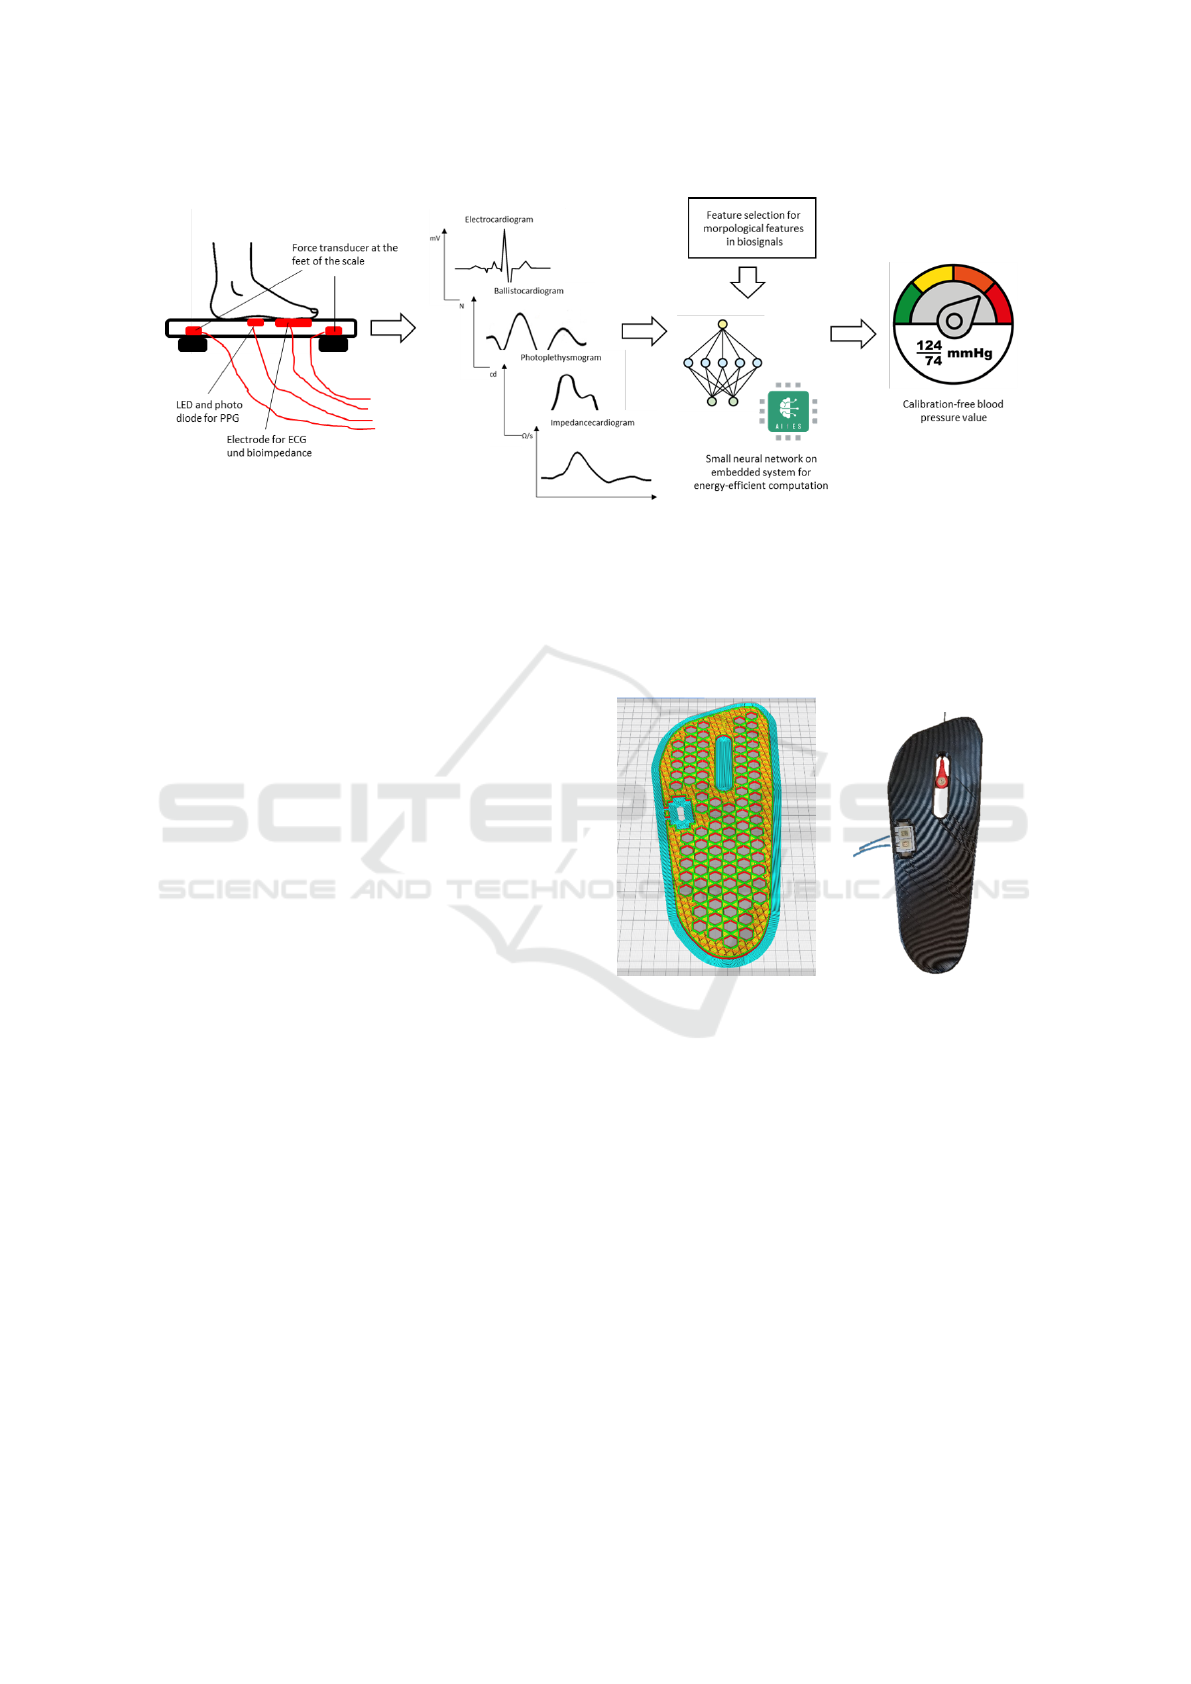
Figure 1: Overview of the single processing steps. From different physical sensors (pressure transducers, photo diodes and
electrodes) biosignals such as ECG, BCG, PPG or bioimpedance are extracted. Based on them morphological features are
extracted and the blood pressured is determined by a neural network. This is accompanied by an energy-efficient implemen-
tation.
logical features are extracted. Subsequently, the blood
pressure is regressed by means of machine learning,
whereby information such as age and body height
should as well be taken into account. The final step
is the energy-efficient implementation on the selected
embedded system.
3.2 Mechanical Design & Signal
Acquisition
The development starts with the design of the me-
chanical structure, the selection of sensors, their
placement and the selection of an embedded system.
Since neither related work nor our previous expe-
rience provide information on exactly which feature
of which biosignal will be most effective when mea-
sured at the foot, the first step is to collect informa-
tion from as many different sensors as possible on the
feet. In further consideration and after preliminary
tests, the number of sensors should be reduced to the
necessary level. The sensors we consider are pressure
transducers for weight and BCG, PPG modules con-
sisting of LEDs and photo diodes and electrodes for
the ECG and the impedance cardiogram.
The placement and installation of the sensors
proved challenging in preliminary tests. Especially
with the electrodes and PPG modules, the foot should
rest completely on the measuring point without an air
gap. At the same time, the sensors must be attached
in such a way that they do not exert pressure that in-
terrupts blood flow in underlying vessels. Due to the
arch of the foot, the inside is not suitable for mea-
surements. In contrast, integrating the sensors on the
outside of the sole allows for a robust measurement.
For this purpose, a measurement prototype was made
from PETG material using a 3D printer, see figure 2.
The plate has a size of 31 cm times 11.5 cm. This
allows different foot shapes and sizes to be measured
up to shoe size EU 48.5 or US 14.
Figure 2: CAD model and 3D print of the measurement
prototype with electrode and PPG module.
The individual sensor modules or preamplifiers
can be connected directly to any microcontroller via
protocols such as I
2
C. Hereby, the selection of a suit-
able embedded system plays a crucial role. On the
one hand, it should be sufficiently powerful to be able
to determine blood pressure from various biosignals.
On the other hand, the lowest possible energy con-
sumption should ensure long-term battery operation.
Another important point to consider is that the embed-
ded system should be integrated into the scale body at
a later date. For the first iteration, an Arduino Nano
(ATmega328) was used, which requires a power con-
sumption of 19 mA and weighs 7 g. This design deci-
sion is preliminary and can be corrected in subsequent
iterations. Energy-efficient processing is essential and
is considered separately in section 3.5.
BIOSIGNALS 2022 - 15th International Conference on Bio-inspired Systems and Signal Processing
210
3.3 Biosignal Generation
In total, at least the following four biosignals should
be extracted: BCG, ECG, PPG and ICG (impedance
cardiogram). From these, secondary parameters such
as respiration rate, HRV or bioimpedance can be de-
rived directly. Thereby, the challenge is that these
biosignals are usually measured on the upper body
(e.g. ECG) or the arms (e.g. PPG). At the feet, on the
other side, the signal quality is significantly reduced.
Between heart and feet lies the entire abdominal cav-
ity as well as the lower extremities. This leads on the
one hand to a reduced SNR of the useful signal and
on the other hand to the coupling of bioartifacts from
the corresponding body parts. In the following, the
biosignals are discussed individually:
The ECG is derived via the electrodes on the left
and right foot. Further electro-muscular activities e.g.
of the leg muscles are coupled into the signal. This
is because people automatically tense and relax their
muscles to stand upright and keep balance. Figure
3 shows the difference in signal quality between the
ECG derived from the upper body and from the feet.
The ECG is hardly recognisable from this raw sig-
nal. Synchronised averaging of the ECG signal based
on the corresponding PPG peak location (similar to
(Shin and Park, 2012)) or a signal filtering based on
a wavelet-transform should therefore be used to im-
prove the signal. For the R-peak detection the possi-
ble temporal position can further be narrowed down
by considering the other biosignals.
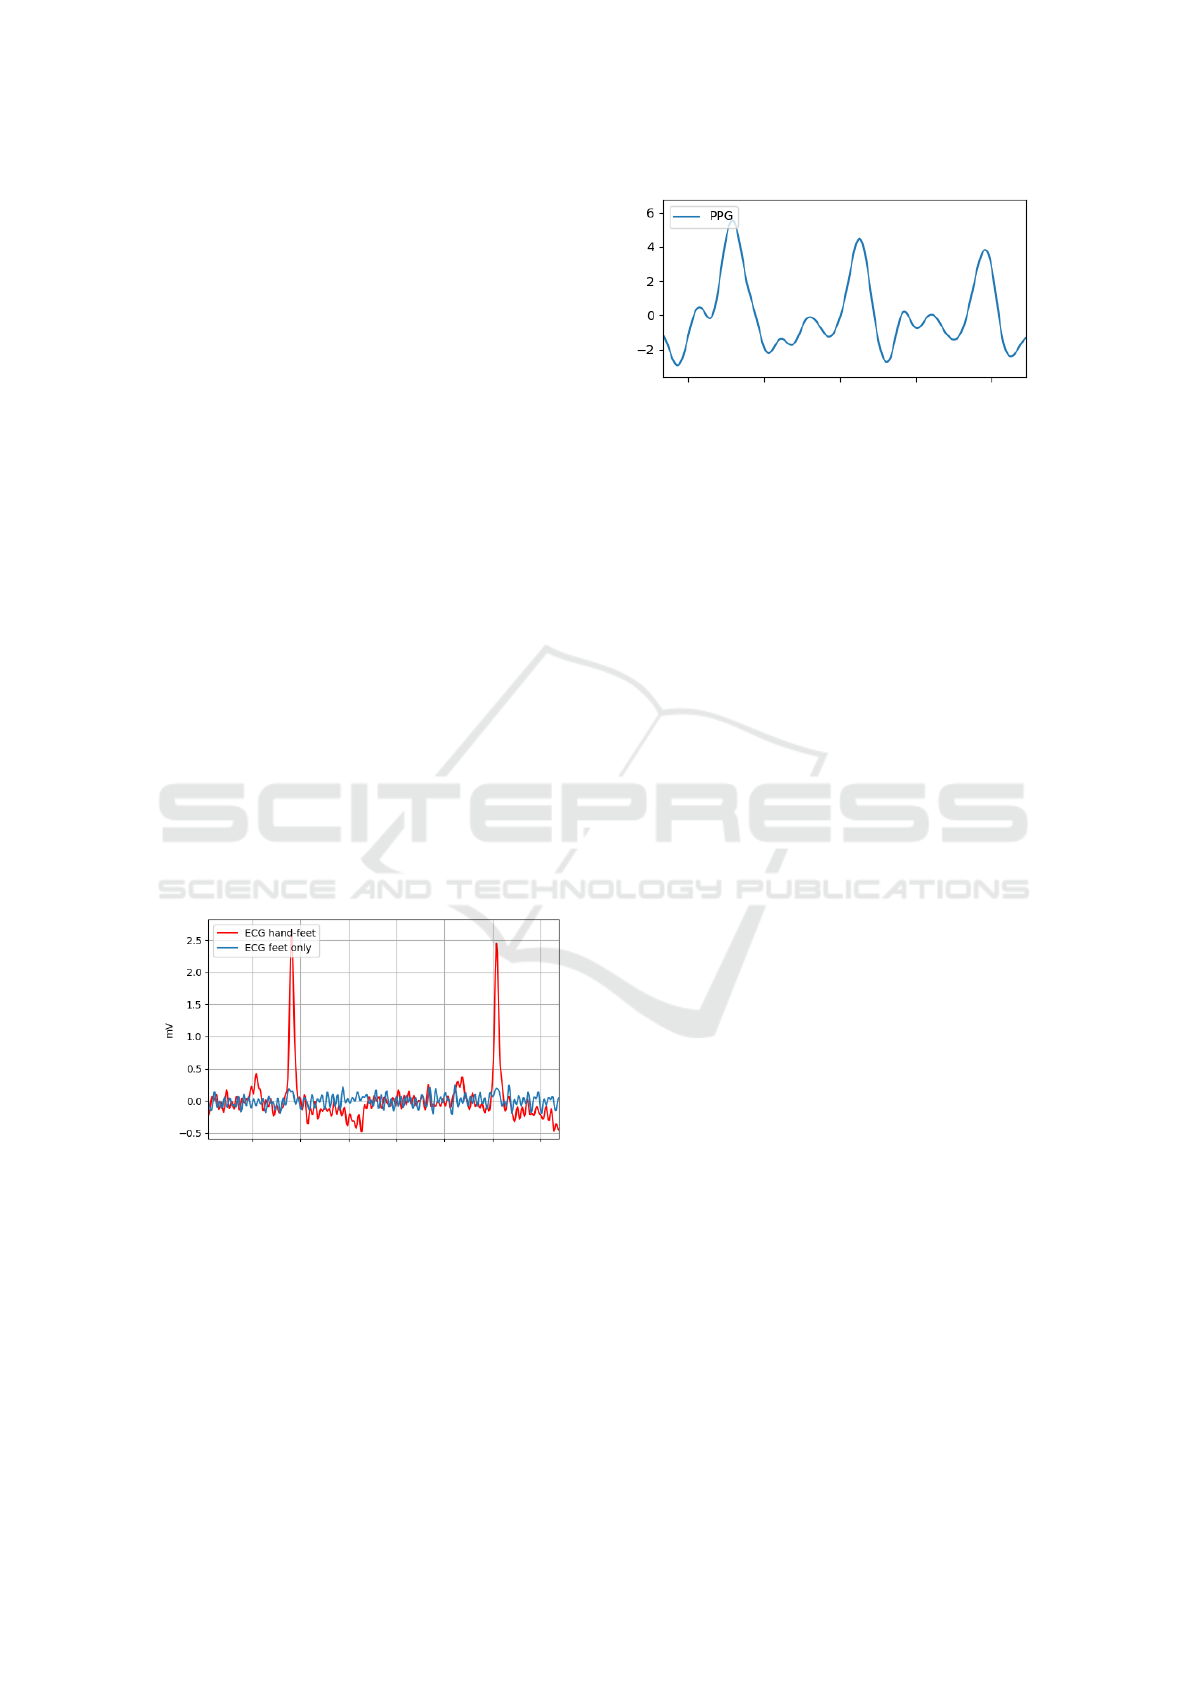
Figure 3: ECG signals simultaneously derived between the
right and left foot (blue) and between feet and hand as ref-
erence (red).
Considering the mechanical attachment from the
previous section, the PPG can be derived stably, see
figure 4. Therefore, only a band pass filtering is
needed for pre-processing. Note that PPG signals
originate from different depths of the foot and thus
maps multiple pulse waves slightly shifted in time.
This leads to a smoothing of the overall curve.
The pressure sensors in the feet of the scale record
the body movement over time, in addition to the
Figure 4: PPG signal measured at the foot. Placed on the
outside of the sole of the foot, it provides a clear signal.
weight of the person. Besides balancing movements
for maintaining the upright position, the mechanical
activity of the heart and the pulse wave can be mea-
sured as well. In accordance with Newton’s third law,
each application of force produces a counter-force of
equal magnitude. The measured mechanical impulses
can thereby temporally map the state of the heart and
blood vessels and complement to the two previous
methods. The main interfering factors are attenua-
tion due to the distance from the heart as well as cou-
pling muscle movements. In order to separate bal-
ancing movements from the impulses caused by heart
contractions, the differences in the signals of the four
sensors can be analysed.
In ICG, voltage changes are measured when a
small measuring current is introduced. From this,
the impedance and its changes over time caused by
heartbeats and blood volume changes can be recorded
directly. In addition to recording the hemodynamic
parameters such as stroke volume and cardiac out-
put, it is also possible to make statements about the
anatomy (e.g. tissue composition). A derivation of
detailed hemodynamic parameters via the feet repre-
sents a novelty in this context, so that only assump-
tions can be made about the feasibility. A low signal
amplitude is expected and a coupling of artifacts from
the rest of the body.
As can already be seen in figure 1, the individual
biosignals correlate strongly with each other or are
shifted in time relative to each other, from which a
difference in transit time can be determined. These
interdependent influences are analysed subsequently.
3.4 Blood Pressure Determination
The determination of the blood pressure can be per-
formed, as described above, via a time delay mea-
surement (PTT or PAT) or the observation of the PPG
signal morphology. For a final evaluation, both ap-
proaches should be combined. The PAT can be deter-
mined from the time difference between the R-wave
of the ECG and the incoming pulse wave. While
PAT alone does not allow any adaptation to or con-
A Calibration-free Blood Pressure Measurement on a Scale: Concept and Challenges
211

clusions about the individual physiology, we will ad-
ditionally analyse the morphology of the recorded sig-
nal courses. The morphology describes the entirety of
the biosignal (e.g. times, amplitudes, slopes, shapes),
which is difficult to capture in a model-based way, but
describe important properties (e.g. vascular stiffness).
In combination with ML methods, the blood pressure
should thus be determined independently of the per-
son and without calibration.
After the biosignals have been extracted, the ques-
tion arises as to which information in the individ-
ual signals contains a contribution to the information
about the blood pressure. Such features are, for ex-
ample, the PAT, the diastolic width at 50 % of maxi-
mum or the rising area of systole. In addition, it must
be noted that numerous features contain the same or
similar information and are strongly correlated. How-
ever, the aim is to generate as few meaningful features
as possible in order to keep the size of the subsequent
neural network as small as possible. For this purpose,
all features are subjected to a Sequential Forward Se-
lection, which belongs to the wrapper methods of fea-
ture selection. First, all features are trained individu-
ally with a neural network of one input each to deter-
mine the blood pressure. The feature with the small-
est error is kept. Afterwards, all remaining features
are paired with the already selected feature and fed
to a neural network with two inputs. This process is
continued iteratively until all features have been se-
lected. Now, we know exactly which feature combi-
nation will achieve which accuracy.
Additional information can be included such as
age, gender and height to improve prediction accuracy
(Kim et al., 2006; Luo et al., 2019; Lu and Dai, 2018).
These values are already retrieved by commercially
available body scales and are therefore easily acces-
sible. Since only a small number of data points can
be recorded in this experimental setup, transfer learn-
ing techniques will be used. There are databases with
biosignals (Saeed et al., 2002; Johnson et al., 2016),
which were recorded in intensive care units and also
show continuous blood pressure values. These large
datasets form a more diverse data source than just our
own data. Based on this datasets, a transfer function
is modelled, which transforms the signals recorded on
the upper body from the dataset into the virtual biosig-
nals on the feet.
3.5 Energy-efficient Implementation
Energy-efficient implementation is essential to keep
power consumption low and thus enable battery op-
eration on the body scale. In order to guarantee this,
a trade-off between accuracy and complexity of the
neural network must be found. The size of the neural
network, together with the number of neurons, deci-
sively determines the computational effort, since there
is a full interconnection between the individual lay-
ers, which has a multiplicative effect. In addition,
the number of features is formative for the number
of inputs of the neuronal network. The smaller the in-
put layer, the fewer neurons are needed in subsequent
layers. Furthermore, the type of selected features and
their complexity is a major influencing factor on com-
putational cost. Another factor is the sampling rate
at which the signals are recorded, processed and dis-
played.
In addition to accuracy, the calculation effort
should also be included as a selection criterion in Se-
quential Forward Selection. This ensures that the cal-
culation effort of the individual features is also taken
into account. The specific weighting of these two pa-
rameters is to be carried out iteratively. In order to
reduce layers and neurons, pruning is applied to the
trained neural network. This removes the layers and
neurons with only a small contribution to the out-
put. The neural network is implemented in AIfES
(Fraunhofer IMS, 2021), an open source framework
for embedded systems. It is implemented directly in
C, which is fast and executable on any small micro-
controller. Furthermore, there is no need for an op-
erating system, which saves overhead. The floating
point values are to be quantised to an integer value
(e.g. I32 or I8). Since only additions are carried out
and no FPU, there is potential for energy savings. At
times when no measurement is taking place, the Ar-
duino is to be put into sleep mode with hardly any
energy being consumed.
4 DISCUSSION
In the following, the previously presented concept
is evaluated and classified within the framework of
a SWOT analysis. A compact presentation can be
found in table 1.
Strengths:
• One strength is the reduction of two devices (body
scale, blood pressure cuff) into a single combined
device, reducing hardware as well as costs and
measuring time for the user.
• The calibration-free measurement ensures easy
handling by the user.
• The ease of use (just standing on the scale) com-
pared to the measurement requirements of the
blood pressure cuff reduces the risk of incorrect
operation.
BIOSIGNALS 2022 - 15th International Conference on Bio-inspired Systems and Signal Processing
212

Table 1: SWOT analysis of a calibration-free scale for blood
pressure determination.
Strengths Weaknesses
Reduction of devices Placement of feet
Calibration-free low signal quality
Easy usage
Higher comfort
Opportunities Threats
Regular measurements Availability of data
More vital parameters Less accuracy
Cost reduction Transferability
Circulation disorders
Exclusion of persons
• The overall result is increased comfort for the
user.
Weaknesses:
• Precise placement of the feet is required so that
the sensors have contact with the foot. This can
be circumvented by placing markers on the top of
the scale.
• The signal quality for some signals, e.g. ECG, is
significantly reduced in comparison to attachment
to the upper body.
Opportunities:
• The ease of use and increased comfort allow for
more regular measurements and thus a more ac-
curate picture of the state of health.
• In addition to blood pressure, there is the potential
to directly measure other vital parameters such as
heart rate, respiration rate, oxygen saturation or
blood glucose level.
• It is expected that there will be a cost reduction
due to fewer devices and cheaper sensors.
Threats:
• A major risk is the low availability of data. In
particular, a large diversity in the training data is
important to prevent bias. E.g., it can be expected
that age has a very strong correlation with blood
pressure. It must be ensured that such external
factors do not dominate the predictions and that
all possible cases are represented correctly in the
model.
• There is a possibility that the blood pressure pre-
dicted by the scale is less accurate than the blood
pressure cuff. However, since cuff-based methods
also exhibit a relatively high error, reference mea-
surements should be taken with a more accurate
and continuous system for evaluation.
• Another risk is the applicability of transfer learn-
ing. Since some publicly available data is col-
lected on the basis of intensive care patients, the
transferability must be checked in a dedicated
manner.
• In case of blood circulation disorders, there is a
risk that the measured values are inaccurate or
non-existent (where inaccurate readings are worse
than no readings at all). Therefore, a plausibility
check should be implemented.
• In case of employing bioimpedance measure-
ments, due to the partially active measuring prin-
ciple, certain groups of people (e.g. wearers of
pacemakers) may have to be excluded from use.
5 CONCLUSION
In order to make the methodology of measuring
blood pressure easier and to integrate it into every-
day life, a concept for measuring blood pressure via
a calibration-free body scale was developed. This
includes the construction of hardware, the selection
of sensors, the biosignal extraction, the determina-
tion of blood pressure via machine learning methods
as well as the energy-efficient implementation. The
calibration-free determination will be based on mor-
phological features of biosignals in combination with
a fully-connected neural net. In addition to the con-
cept, we discussed and classified the strengths, weak-
nesses, threats and opportunities of the approach.
The next step is to implement the system itself.
In several stages, a procedure for determining blood
pressure with calibration is established. This is then
further developed into a calibration-free method. The
energy-efficient implementation is the final step. The
biggest challenges are data availability, transferability
and bias. Further work lies in ensuring the privacy of
the user while respecting the legal requirements and
the sensitivity of the health data collected.
ACKNOWLEDGEMENTS
This work was supported by the Fraunhofer Internal
Programmes under Grant No. SME 610 550.
REFERENCES
Buard, N., Campo, D., Ya, R., Techer, F., Barrochin, P.,
Pallas Areny, R., and Casas Piedrafita, J. O. (2016).
Weighing scale with extended functions. EU Patent
EP 3087914A1 by Withings.
Carek, A. M., Jung, H., and Inan, O. T. (2019). A reflective
photoplethysmogram array and channel selection al-
A Calibration-free Blood Pressure Measurement on a Scale: Concept and Challenges
213

gorithm for weighing scale based blood pressure mea-
surement. IEEE Sensors Journal, 20(7):3849–3858.
European Commission (2021). 22 % of people in
the eu have high blood pressure. https://ec.
europa.eu/eurostat/de/web/products-eurostat-news/-/
edn-20210929-1.
Fan, X., Ye, Q., Yang, X., and Choudhury, S. D. (2020).
Robust blood pressure estimation using an rgb cam-
era. Journal of Ambient Intelligence and Humanized
Computing, 11(11):4329–4336.
Fraunhofer IMS (2021). AIfES. https://github.com/
Fraunhofer-IMS/AIfES for Arduino.
Jeong, I. C. and Finkelstein, J. (2016). Introducing con-
tactless blood pressure assessment using a high speed
video camera. Journal of medical systems, 40(4):77.
Johnson, A. E., Pollard, T. J., Shen, L., Li-Wei, H. L., Feng,
M., Ghassemi, M., Moody, B., Szolovits, P., Celi,
L. A., and Mark, R. G. (2016). Mimic-iii, a freely ac-
cessible critical care database. Scientific data, 3(1):1–
9.
Kachuee, M., Kiani, M. M., Mohammadzade, H., and Sha-
bany, M. (2017). Cuffless blood pressure estima-
tion algorithms for continuous health-care monitor-
ing. IEEE transactions on bio-medical engineering,
64(4):859–869.
Kim, J. Y., Cho, B. H., Im, S. M., Jeon, M. J., Kim, I. Y., and
Kim, S. I. (2006). Comparative study on artificial neu-
ral network with multiple regressions for continuous
estimation of blood pressure. In 2005 IEEE Engineer-
ing in Medicine and Biology 27th Annual Conference,
pages 6942–6945. IEEE.
Lin, W.-H., Wang, H., Samuel, O. W., and Li, G. (2017).
Using a new ppg indicator to increase the accuracy of
ptt-based continuous cuffless blood pressure estima-
tion. In 2017 39th Annual International Conference
of the IEEE Engineering in Medicine and Biology So-
ciety (EMBC), pages 738–741. IEEE.
Lu, Q. and Dai, E. (2018). A new blood pressure estimation
method based on neural network algorithm model. In
IOP Conference Series: Materials Science and Engi-
neering, volume 382, page 052027. IOP Publishing.
Luo, H., Yang, D., Barszczyk, A., Vempala, N., Wei, J., Wu,
S. J., Zheng, P. P., Fu, G., Lee, K., and Feng, Z.-P.
(2019). Smartphone-based blood pressure measure-
ment using transdermal optical imaging technology.
Circulation. Cardiovascular imaging, 12(8):e008857.
Martin, S. L.-O., Carek, A. M., Kim, C.-S., Ashouri, H.,
Inan, O. T., Hahn, J.-O., and Mukkamala, R. (2016).
Weighing scale-based pulse transit time is a superior
marker of blood pressure than conventional pulse ar-
rival time. Scientific reports, 6(1):1–8.
Murakami, K., Yoshioka, M., and Ozawa, J. (52015). Non-
contact pulse transit time measurement using imaging
camera, and its relation to blood pressure. In 2015
14th IAPR International Conference on Machine Vi-
sion Applications (MVA), pages 414–417. IEEE.
Nakano, K., Ohnishi, T., Nishidate, I., and Haneishi, H.
(27.01.2018 - 01.02.2018). Noncontact sphygmo-
manometer based on pulse-wave transit time between
the face and hand. In Cot
´
e, G. L., editor, Optical Diag-
nostics and Sensing XVIII: Toward Point-of-Care Di-
agnostics, page 34. SPIE.
Oreggia, D., Guarino, S., Parisi, A., Pernice, R., Adamo,
G., Mistretta, L., Di Buono, P., Fallica, G., Ferla, G.,
Cino, A., et al. (2015). Physiological parameters mea-
surements in a cardiac cycle via a combo ppg-ecg sys-
tem. In 2015 AEIT International Annual Conference
(AEIT), pages 1–6. IEEE.
Paviglianiti, A., Randazzo, V., Pasero, E., and Vallan, A.
(52020). Noninvasive arterial blood pressure estima-
tion using abpnet and vital-ecg. In 2020 IEEE Interna-
tional Instrumentation and Measurement Technology
Conference (I2MTC), pages 1–5. IEEE.
Pielmus, A.-G., M
¨
uhlstef, J., Bresch, E., Glos, M., Jungen,
C., Mieke, S., Orglmeister, R., Schulze, A., Stender,
B., Voigt, V., et al. (2021). Surrogate based continuous
noninvasive blood pressure measurement. Biomedi-
cal Engineering/Biomedizinische Technik, 66(3):231–
245.
Rundo, F., Ortis, A., Battiato, S., and Conoci, S. (2018).
Advanced bio-inspired system for noninvasive cuff-
less blood pressure estimation from physiological sig-
nal analysis. Computation, 6(3):46.
Saeed, M., Lieu, C., Raber, G., and Mark, R. G. (2002).
Mimic ii: a massive temporal icu patient database to
support research in intelligent patient monitoring. In
Computers in cardiology, pages 641–644. IEEE.
Shin, J. H. and Park, K. S. (2012). Hrv analysis and blood
pressure monitoring on weighing scale using bcg. In
2012 Annual International Conference of the IEEE
Engineering in Medicine and Biology Society, pages
3789–3792. IEEE.
Singla, M., Sistla, P., and Azeemuddin, S. (2019). Cuff-less
blood pressure measurement using supplementary ecg
and ppg features extracted through wavelet transfor-
mation. In 2019 41st Annual International Conference
of the IEEE Engineering in Medicine and Biology So-
ciety (EMBC), pages 4628–4631. IEEE.
Sun, S., Bezemer, R., Long, X., Muehlsteff, J., and Aarts,
R. (2016). Systolic blood pressure estimation using
ppg and ecg during physical exercise. Physiological
measurement, 37(12):2154.
Xing, X. and Sun, M. (2016). Optical blood pressure esti-
mation with photoplethysmography and fft-based neu-
ral networks. Biomedical optics express, 7(8):3007–
3020.
Yan, C., Li, Z., Zhao, W., Hu, J., Jia, D., Wang, H., and
You, T. (2019). Novel deep convolutional neural net-
work for cuff-less blood pressure measurement using
ecg and ppg signals. Annual International Conference
of the IEEE Engineering in Medicine and Biology So-
ciety. IEEE Engineering in Medicine and Biology So-
ciety. Annual International Conference, 2019:1917–
1920.
BIOSIGNALS 2022 - 15th International Conference on Bio-inspired Systems and Signal Processing
214
