
Automated Curation of Variational Data in NoSQL Databases through
Metric-driven Self-adaptive Migration Strategies
Andrea Hillenbrand
1,2 a
and Uta St
¨
orl
2 b
1
Darmstadt University of Applied Sciences, Darmstadt, Germany
2
University of Hagen, Hagen, Germany
Keywords:
Databases, NoSQL, Data Migration, Schema Evolution, Schema Migration, Automated Curation.
Abstract:
Schema-flexible NoSQL databases have become popular backends in agile development. They allow de-
velopers to write code flexibly while assuming a new database schema different from the current one. The
co-evolution of the schema with the software code, together with requirements for performance and cost ef-
ficiency, require subtle management decisions regarding the migration of variational legacy data persisted in
the production database. Project managers have to deal with the consequences of schema evolution in order
to comply with service-level agreements, especially if metrics specified in the SLAs compete with each other
in tradeoffs. We present self-adaptive schema migration strategies that curate just as much variational data so
that competing metrics can be balanced out, thus making continuous management interventions superfluous.
1 INTRODUCTION
Schema-flexible NoSQL databases allow developers
to write code assuming a new schema different from
the current one. Then, new software releases can
be deployed without application downtime for the
schema migration. Though, eventually it has to be
addressed how to handle the variational data that is
already persisted in the production database. Man-
aging the repercussions of schema evolution comes
up repeatedly, oftentimes in unison with changing
requirements from service-level agreements (SLAs).
The most crucial issue is an oftentimes overwhelm-
ing complexity of the schema evolution problem, i.e.,
predicting the impact of schema changes on the met-
rics that are required by SLAs despite the multitude
of influencing factors. Due to this complexity, there
seem only two approaches pragmatic in general.
First, a heuristic allows an adequate solution in
form of an approximation considering the most im-
portant migration situation characteristics that influ-
ence the impact (Hillenbrand et al., 2021a). However,
although the existence of such a heuristic saves stake-
holders time, evaluating the metrics and applying the
heuristic repeatedly is still time-consuming.
Especially at the beginning of a software project,
a
https://orcid.org/0000-0002-1063-5734
b
https://orcid.org/0000-0003-2771-142X
just when stakeholders are most busy and presumably
workflows still inefficient, reorganizing a database
schema is often necessary due to emerging require-
ments. We have identified schema modification op-
erations affecting multiple types as the most definite
cost driver of schema evolution (Hillenbrand et al.,
2021a). Moreover, we have found in our probabilis-
tic experiments that metrics can vary easily by fac-
tor 100 in case of high cardinalities of the entity-
relationships, sometimes resulting in exceptionally
high migration costs and tail latencies. The uncer-
tainty gets worse if the migration situation is unknown
or scenarios hard to predict.
Contribution. We contribute an approach that over-
comes the necessity of navigating a heuristic in or-
der to deal with the impact of schema evolution. We
present the automated curation of variational data
in NoSQL databases through self-adaptive migration
that balances out competing metrics automatically,
thus making stakeholder interventions and elicitation
of migration situations superfluous.
The Bigger Picture. Migration strategies vary with
respect to how much and when they migrate legacy
data that is structured according to earlier schema
versions. In an eager approach, all of the legacy
data is curated right away at the release of schema
changes, which produces maximal charges with the
cloud provider. The upside of this investment is that a
structurally homogeneous database instance does not
Hillenbrand, A. and Störl, U.
Automated Curation of Variational Data in NoSQL Databases through Metric-driven Self-adaptive Migration Strategies.
DOI: 10.5220/0010891300003119
In Proceedings of the 10th International Conference on Model-Driven Engineering and Software Development (MODELSWARD 2022), pages 279-286
ISBN: 978-989-758-550-0; ISSN: 2184-4348
Copyright
c
2022 by SCITEPRESS – Science and Technology Publications, Lda. All rights reserved
279

Lazy Strategy
Predictive Strategy
Latency
Migration
Costs
Adaptive Strategies
Incremental Strategy
Eager Strategy
Figure 1: Tradeoff between competing metrics in schema
migration; adapted from (Hillenbrand et al., 2019).
produce migration-induced runtime overhead, which
is especially crucial for the performance of cloud-
hosted applications (Barker et al., 2012; Curino et al.,
2011; Difallah et al., 2013). However, if saving costs
is defined being most important in the SLAs, then a
lazy strategy minimizes migration costs , as data re-
mains unchanged in the event of schema changes. The
downside is that a considerable runtime overhead is
introduced (Klettke et al., 2016; Saur et al., 2016).
The metrics migration costs and latency compete in
a tradeoff, schematically depicted in Figure 1, which
opens up the possibility of alternative strategies at dif-
ferent opportunity costs.
In (Hillenbrand et al., 2021a), we have investi-
gated the impact of schema evolution in terms of com-
mon migration strategies and software release strate-
gies. We uncovered the correlations of migration
situation characteristics with the impact of schema
evolution for each strategy by searching the solution
space with a probabilistic Monte Carlo method of re-
peated sampling of our schema migration advisor tool
MigCast in order to bring the complexity of the prob-
lem under control (Fishman, 2013). A cost model in
MigCast takes all relevant migration situation charac-
teristics into account as detailed in Section 2. Then we
could distill a heuristic by means of which stakehold-
ers can mitigate the impact of schema evolution and
pace releasing schema changes in order to ascertain
compliance with cost- and latency-related SLAs (Hil-
lenbrand et al., 2021a).
In order to put stakeholders in a position of di-
rectly controlling the impact of schema evolution,
we present a self-adaptive migration strategy that can
simply be parameterized with the required thresholds
of the competing metrics to balance them out. We
have integrated it into our schema migration advisor
tool MigCast to demonstrate the effectiveness in the
context of different migration situations. We have
already analyzed possible options of self-adaptation
from a theoretical stance in (Hillenbrand et al., 2020;
Hillenbrand et al., 2021b). In this paper, we flesh out
the methodology of self-adaptive migration by speci-
fying and validating the most promising algorithm.
2 ARCHITECTURE
Definitions and Terminology. In this paper, we use
the following metrics: We refer to the time that a
read access takes, i.e. the time to retrieve a requested
data entity, as data access latency. Latency competes
in a tradeoff with the monetary charges occasioned
by migrating the data with a cloud service provider,
which we refer to as migration costs. The migra-
tion costs consist of on-release and on-read migra-
tion costs, which together make up the cumulated mi-
gration costs. On-release migration costs are caused
when entities are migrated in the event of a schema
modification operation (SMO). They depend on the
number of affected entities and how these legacy enti-
ties are being handled. In contrast, on-read migration
costs are caused when entities are accessed that exist
in older versions than the current schema.
Architecture of MigCast. MigCast is our NoSQL
schema migration advisor tool, which we presented
in earlier work (Hillenbrand et al., 2019; Hillenbrand
et al., 2020). For each migration strategy, MigCast
generates the migration scenarios according to the pa-
rameterized characteristics and calculates various cost
and classification metrics by means of the schema
management middleware Darwin (St
¨
orl et al., 2018).
Specifically, MigCast takes all metric-relevant situa-
tion characteristics into account: i. intensity and dis-
tribution of data entity accesses, ii. different kinds
of schema changes, and iii. cardinality of the entity-
relationships of the data set, and calculates the mon-
etary migration charges and the data access latency,
as well as classification metrics like precision and
recall in order to assess the structural heterogene-
ity of the database instance, while persisting all data
in the MigCast database. For more details, be re-
ferred to (Hillenbrand et al., 2021b; Hillenbrand et al.,
2021a).
3 MIGRATION STRATEGIES
As illustrated in Figure 1, the migration strategies ea-
ger and lazy span the space of opportunity costs on
the metrics. Different compromises on this tradeoff
can be settled by means of alternative strategies.
A common compromise is the incremental strat-
egy which fluctuates between these extremes at the
disadvantage of an unstable, yet not unpredictable, la-
tency. With the incremental strategy, schema changes
are usually treated like with lazy migration, the dis-
array in the database increasing accordingly. How-
ever, with the incremental strategy, legacy entities are
completely migrated at certain periodic increments to
MODELSWARD 2022 - 10th International Conference on Model-Driven Engineering and Software Development
280
match the current schema and thus, getting rid of the
runtime overhead which is caused by updating legacy
entities on-the-fly when being accessed. In terms of a
heuristic, it is advisable to apply the incremental strat-
egy in case that the entity accesses to be served, the
workload, is evenly distributed.
If the workload concentrates on hot data, i.e., is
Pareto-distributed, a predictive strategy settles on a
compromise with a more stable latency and better
cost-benefit ratio of invested migration costs for im-
proved latency. The predictive strategy is controlled
through adapting the cardinality of the set of entities
to be migrated after an SMO, the prediction set size.
In order to keep a steady balance between metrics, we
devised the predictive strategy which keeps hot en-
tities in a prediction set and orders them according
to their actuality and access frequency (Hillenbrand
et al., 2021b). Legacy entities not included in the pre-
diction set, are migrated lazily when being accessed.
Through the complexity-adaptive strategy we
avoid tail latencies which would occur when legacy
entities are accessed that have been affected by a
sequence of SMOs, typically during major schema
changes at the beginning of a software development
life-cycle. This backlog of complex schema changes
can be prevented by increasing the prediction set size
automatically when a certain number of multi-type
SMOs have accrued (Hillenbrand et al., 2021b).
In the remainder of this section, we newly devise
the algorithm of the requirement-adaptive migration
strategy in Algorithm 1 that automatically adapts the
prediction set size (psSize). This strategy is parame-
terized by the thresholds of migration costs (c
max
) and
latency (l
max
) as inputs. The metrics (c, l) are mon-
itored and the prediction set size is increased or de-
creased accordingly in order for both metrics to com-
ply with their thresholds, or find a suitable compro-
mise. The monitored migration costs consist of mea-
surements of the on-read migration costs caused by
accessing legacy entities when serving the workload
in between two schema changes and the on-release
migration costs caused by the last schema change.
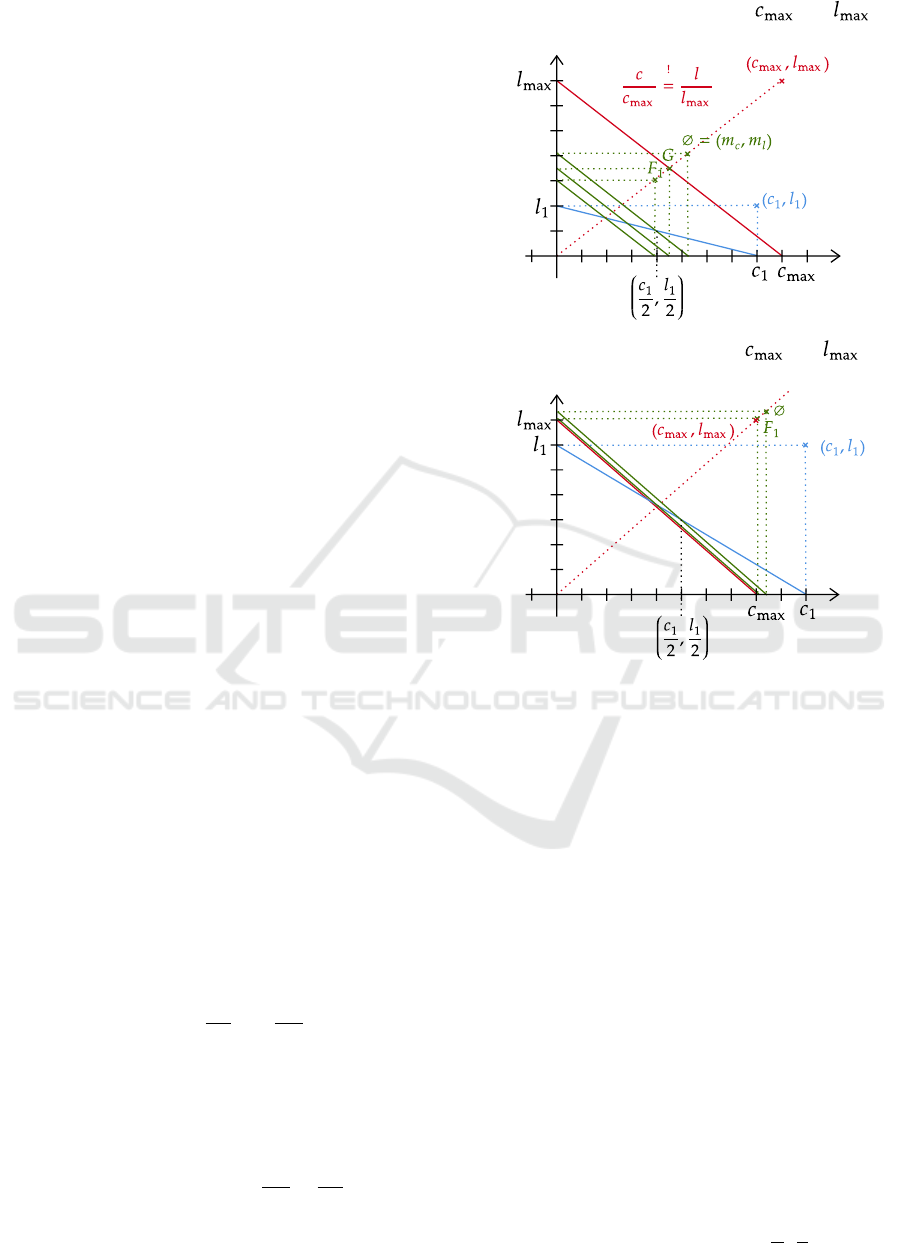
A balanced compromise can be reached through
an average of the measured metrics in respect of their
maximal thresholds, i.e.,
l
l
max
and
c
c
max
.
In Figure 2 A, tuple (c
1
, l
1
) represents the mea-
sured metrics since the past release with its auxiliary
line to indicate the used resources. Analogously, the
red tuple (c
max
, l
max
) marks the thresholds of the met-
rics to indicate the available resources. The red tuple
can be connected to the origin, the red dotted line, and
can be described by the function
c
c
max
=
l
l
max
which ex-
presses the compromise between the metrics. Conse-
quently, all three averages in green (F
1
for harmonic,
Latency
Migration Costs
Line 19/29/32: Two thresholds and ,
no required thresholds passed
Line 32: Non-required and ,
compromise passes both thresholds
Migration Costs
Latency
A
B
Latency
Migration Costs
Line 19/29/32: Two thresholds and ,
no required thresholds passed
Line 32: Non-required and ,
compromise passes both thresholds
Migration Costs
Latency
A
B
Figure 2: (A) represents the situation where two thresholds
exist, none of them is passed, neither does the compromise;
in (B) the comprises surpass the thresholds, which are both
not required to be met.
G for geometric, and ∅ for arithmetic means) of the
quotients of measured metrics and required thresh-
olds can be located on this red dotted line, with the
harmonic mean F
1
as the furthest and the arithmetic
mean ∅ as the compromise closest to the red tuple.
The intersections of the green lines with the x-axis
are a geometric solution to determine how to adapt
the prediction set size. These represent the predicted
costs that are caused if the quotients of the measured-
to-required metrics are assumed to be equally high for
both migration costs and latency, depending on their
correlation being arithmetic, geometric, or harmonic.
Naturally, the green lines all turn out to be parallel
to the red line, the available resources. This is an in-
teresting way of picturing the metrics being balanced
out: the blue line can be rotated at certain angles to be
identical to the green lines. Not by coincidence does
the angle, at which the blue line is rotated to become
the harmonic mean, lie on the red dotted line, and
the angle, at which it becomes the arithmetic mean,
equals half of the measured metrics (
c
1
2
,
l
1
2
).
Automated Curation of Variational Data in NoSQL Databases through Metric-driven Self-adaptive Migration Strategies
281
Line 7: One threshold
Latency
Migration Costs
Line 10: One threshold ,
Latency
Migration Costs
A
B
Line 7: One threshold
Latency
Migration Costs
Line 10: One threshold ,
Latency
Migration Costs
A
B
Figure 3: (A) represents the situation where a threshold of
maximal migration costs is given, which is surpassed by the
measured costs; in (B) the maximal latency is given as a
threshold, which is surpassed by twice the amount.
At the beginning of Algorithm 1 the following
variables are assigned: the measured-to-required quo-
tients q
c
and q
l
, their arithmetic mean a, and the ab-
scissa m
c
and ordinate m
l
of a. At the top-level, the al-
gorithm distinguishes three mutually exclusive cases
depending on whether there exists one or two thresh-
olds (Lines 6, 8, 14). In case that two thresholds exist
and not both of them can be satisfied concurrently, ei-
ther metric can be set as prioritized, which means that
one metric is fulfilled no matter the cost of the other
metric. Other cases are left out here for brevity.
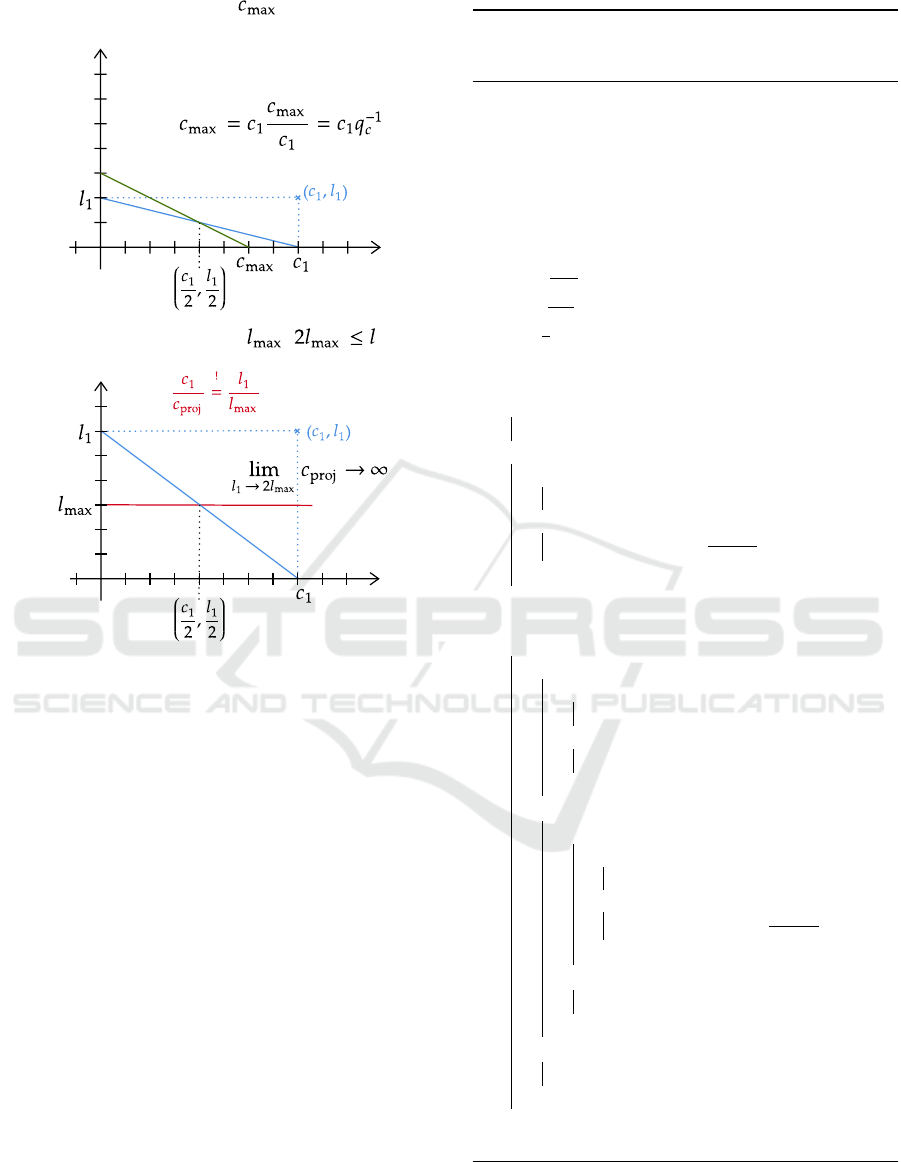
Line 6/7: If a threshold of migration costs is given,
but latency is not required to be met, then the pre-
diction set size is multiplied by the inverse migration
costs quotient q
−1
c
. If c < c
max
, then the remaining
amount of costs is invested up to the threshold by
means of this factor q
−1
c
. If the measured costs sur-
pass the threshold, as depicted in Figure 3 A, then the
inverse quotient scales down psSize for the next mi-
gration costs to stay within the threshold.
Line 8: If l
max
is given, but not c
max
, then two
mutually exclusive cases have to be distinguished:
Algorithm 1: Requirement-adaptive strategy adapts the pre-
diction set size at each release based on metrics migration
costs and latency and their arithmetic mean.
Result: Updates prediction set size psSize
fulfilling given requirements
regarding the maximum migration
costs c
max
and maximum latency l
max
and regarding the prioritization of
these thresholds prio
Input: psSize, c, c
max
, l, l
max
, prio
Output: psSize
1 q
c
←
c
c
max
;
2 q
l
←
l
l
max
;
3 a ←
1
2
(q
c
+ q
l
);
4 m
c
← a · c
max
;
5 m
l
← a · l
max
;
6 if c
max
6=
/
0 ∧ l
max
=
/
0 then
7 psSize ← psSize·q
−1
c
;
8 else if c
max
=
/
0 ∧ l
max
6=
/
0 then
9 if 2l
max
≤ l then
10 psSize ← 1
11 else /* 2l
max
> l */
12 psSize ← psSize·
l
max
2l
max
−l
;
13 end
14 else
/* c
max
, l
max
6=
/
0, ¬(prio(c
max
) ∧ prio(l
max
))
*/
15 if prio(c
max
) then
16 if m
c
> c
max
then
17 psSize ← psSize· q
−1
c
;
18 else /* m
c
≤ c
max
*/
19 psSize ← psSize·a · q
−1
c
;
20 end
21 else if prio(l
max
) then
22 if m
l
> l
max
then
23 if 2l
max
≤ l then
24 psSize ← 1
25 else /* 2l
max
> l */
26 psSize ← psSize·
l
max
2l
max
−l
;
27 end
28 else /* m
l
≤ l
max
*/
29 psSize ← psSize·a · q
−1
c
;
30 end
31 else /* ¬prio(c
max
) ∧ ¬prio(l
max
) */
32 psSize ← psSize·a · q
−1
c
;
33 end
34 end
35 return psSize
1. Line 9/10: If the measured latency is at least twice
the amount of its threshold, then the situation de-
MODELSWARD 2022 - 10th International Conference on Model-Driven Engineering and Software Development
282
picted in Figure 3 B shows that the highest in-
crease of the psSize is required (100%), which
is tantamount to an eager migration of all legacy
entities. This is the case, when we assume an
arithmetic correlation of the quotients, where the
projected migration costs diverge if the latency is
much higher than required by the threshold.
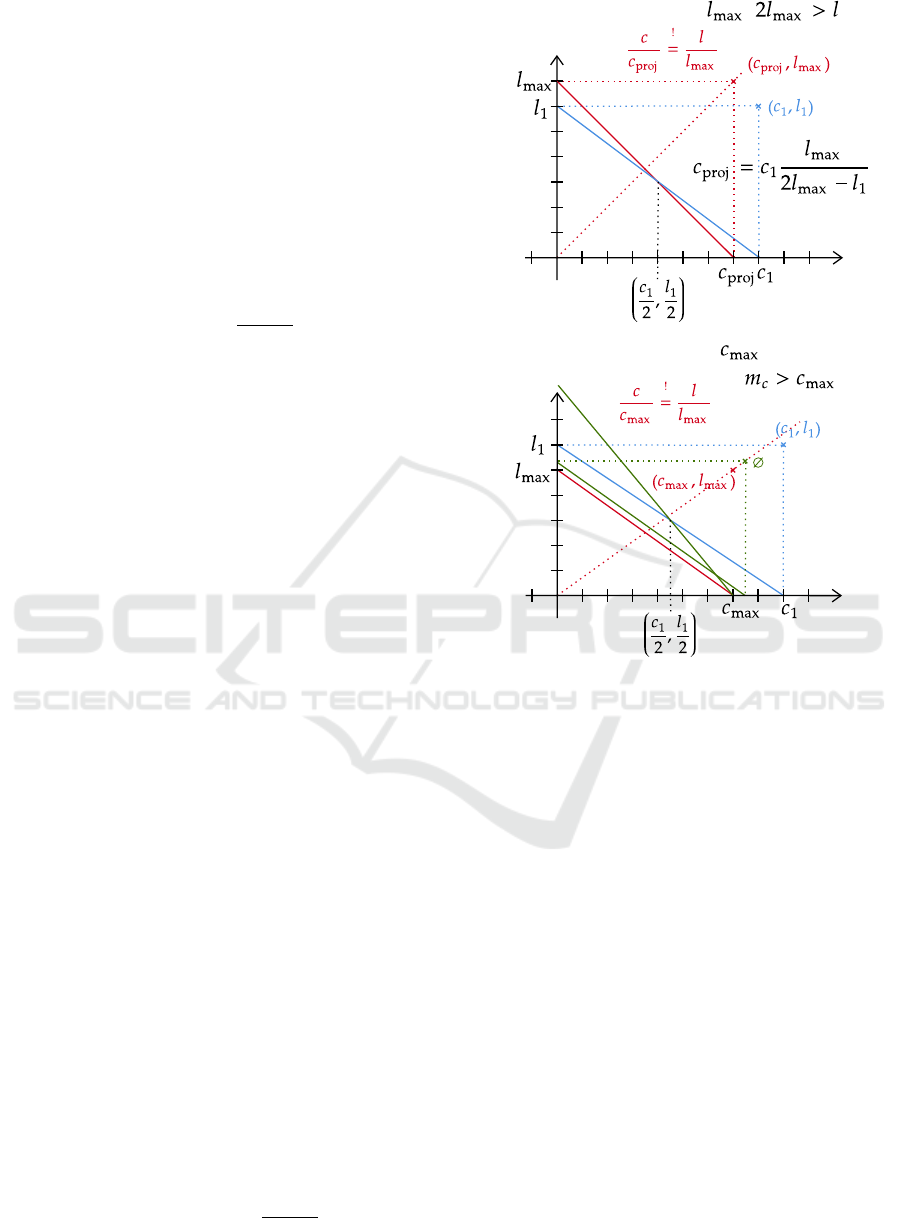
2. Line 11/12: If the measured latency stays below
twice the amount of the threshold, then the migra-
tion costs can be projected as shown in Figure 4 A
by means of the red line which is a straight line
from l
max
intersecting the center of the blue rect-
angle (used resources) to the intersection with the
x-axis c
proj
as defined by
c
1
l
max
2l
max
−l
1
.
Line 14: If, however, there are two thresholds migra-
tion costs and latency, and at most one metric is prior-
itized no matter the consequences to the other metric,
then three mutually exclusive cases have to be distin-
guished:
1. Line 15: If the threshold for cost is mandatory,
then it is distinguished whether the compromise
with regard to the costs m
c
is greater than the max-
imal costs c
max
or not.
(a) Line 16/17 m
c
> c
max
: If m
c
exceeds the maxi-
mal costs c
max
, then the psSize is multiplied by
the inverse migration costs quotient q
−1
c
, scal-
ing down the psSize to c
max
(see Figure 4 B).
(b) Line 18/19 m
c
≤ c
max
: If m
c
is at most c
max
,
then the psSize is adapted by the compromise
a and the inverse migration costs quotient q
−1
c
.
This is illustrated in Figure 2 A. It balances out
the metrics to become equal quotients.
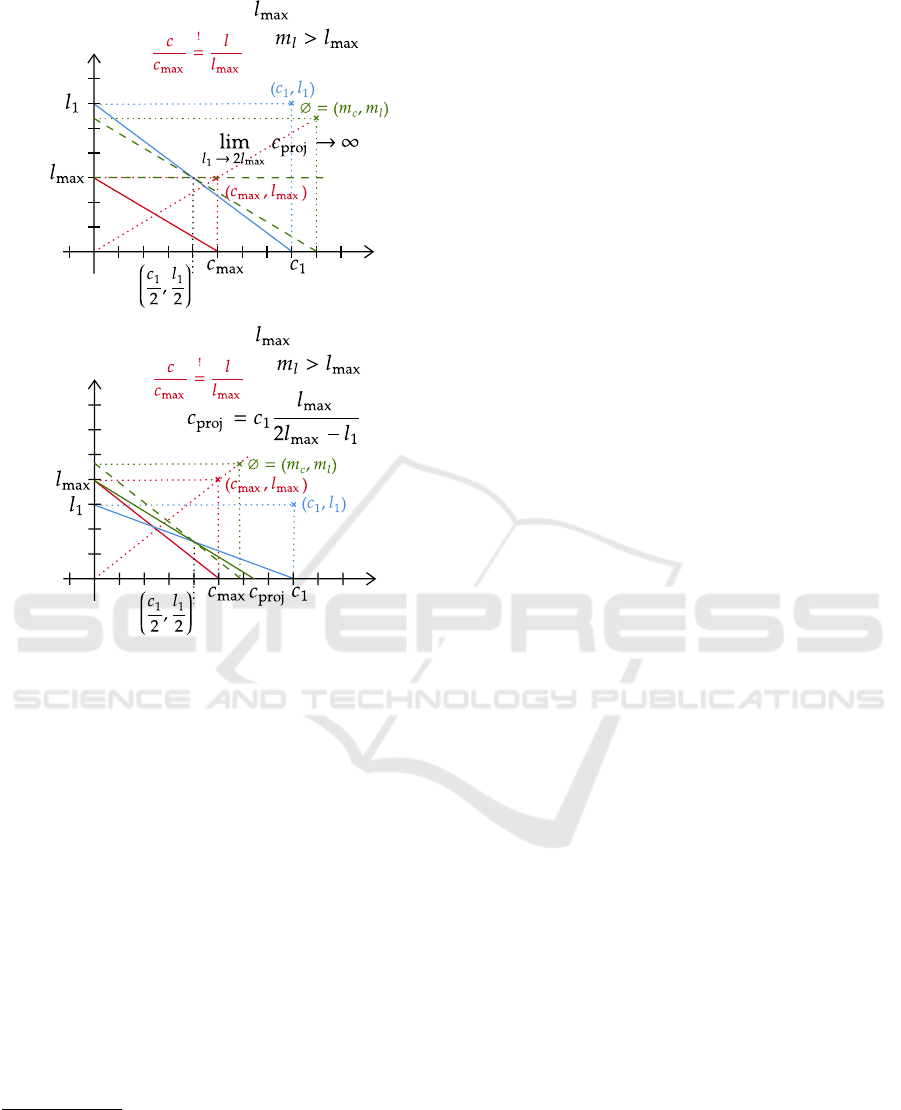
2. Line 21: If the threshold for latency is mandatory,
then it is distinguished whether the compromise
with regard to the latency m
l
is greater than the
maximal latency l
max
or not.
(a) Line 22 m
l
> l
max
: If m
l
exceeds l
max
as shown
in both Figures 5 A and B, then two mutually
exclusive cases have to be distinguished:
i. Line 23/24 2l
max
≤ l: If the measured latency
surpasses twice the amount of the threshold,
see Figure 5 A, then the highest increase of the
psSize is required, i.e., 100%, which is tanta-
mount to an eager migration.
ii. Line 25/26 2l
max
> l: If the measured latency
stays below, see Figure 5 B, then the migration
costs can be projected by means of the green
line which is a straight line from l
max
inter-
secting the center of the blue rectangle to the
abscissa c
proj
defined by
c
1
l
max
2l
max
−l
1
.
Line 12: One threshold ,
Latency
Migration Costs
Line 17: Two thresholds, required,
Latency
Migration Costs
B
A
Line 12: One threshold ,
Latency
Migration Costs
Line 17: Two thresholds, required,
Latency
Migration Costs
B
A
Figure 4: (A) represents the situation where a maximal
threshold exists for latency and latency stays below twice
the amount of the threshold; in (B) there are two competing
thresholds and the maximal threshold for migration costs is
prioritized over the maximal threshold for latency.
(b) Line 28/29 m
l
≤ l
max
: If the compromise with
regard to the latency m
l
is at most l
max
, as illus-
trated in Figure 2 A, then the psSize is adapted
by the compromise a and the inverse migration
costs quotient q
−1
c
, like in Line 19.
3. Line 31/32: If neither threshold is mandatory, then
the psSize is adapted by the compromise a and
the inverse quotient q
−1
c
to balance out the metrics
and become equal quotients, like in Lines 19/29.
This is illustrated in Figure 2 depending on the
metrics surpassing the thresholds (B) or not (A).
4 IMPLEMENTATION
We integrated the requirement-adaptive strategy into
MigCast to demonstrate its effectiveness in terms of
controlling the impact of schema evolution. We cal-
culated the migration costs and latency for all strate-
Automated Curation of Variational Data in NoSQL Databases through Metric-driven Self-adaptive Migration Strategies
283
Line 22: Two thresholds, required,
Latency
Migration Costs
Line 26: Two thresholds, required,
Latency
Migration Costs
A B
Line 22: Two thresholds, required,
Latency
Migration Costs
Line 26: Two thresholds, required,
Latency
Migration Costs
A B
Figure 5: Situations with two thresholds: compromise w.r.t.
latency m
l
is exceeding the threshold l
max
which is priori-
tized; in (A) the measured latency is twice the threshold and
in (B) it is smaller than the threshold.
gies in a common migration situation
1
throughout 12
releases of schema changes (Figure 6).
The incremental strategy migrates at every fifth
release, and the complexity-adaptive strategy is pa-
rameterized such that the prediction set size is dou-
bled when four multi-type SMOs have accrued. We
have chosen a high share multi-type SMOs typical at
the beginning of SDLCs in order for the complexity-
adaptive strategy to be distinct from the predictive
strategy, the latter being set invariably at 30% pre-
diction set size. The requirement-adaptive strategy is
parameterized by two equal thresholds for migration
costs (USD 20 per release) and latency (30ms per en-
tity access), plotted in the charts as dashed lines.
2
1
The distribution of the served workload of entity ac-
cesses and the distribution and kinds of SMOs are random-
ized in MigCast within the given bounds, in this case a
Pareto-distributed workload of medium intensity and a high
multi-type ratio of SMOs (Hillenbrand et al., 2021a).
2
Despite the low amounts in our example, costs can eas-
ily amount to thousands of USD (Hillenbrand et al., 2021a).
The requirement-adaptive strategy stays consis-
tently below the predictive and complexity-adaptive
strategies with respect to on-release and cumulated
migration costs. The threshold for the latency is kept
in roughly half on the releases, which is a good bal-
ance as the metrics are set as equally important.
At release 4, latency is significantly higher than
the threshold and thus the prediction set size is in-
creased and the on-release migration increase as well,
yet not at the same measure as the latency threshold
is surpassed. The increase is relatively moderate, be-
cause the sum of on-release cost of release 3 and on-
read costs of release 4 have also already surpassed the
threshold of USD20. At release 6, latency also sur-
passes its threshold and now the prediction set size
is decreased and on-release cost shrink, because the
on-read costs have already exhausted the budget. At
releases 11 and 12, latency peaks again, which is also
visible in high on-read migration costs, such that the
on-release costs are dialed down accordingly.
Altogether, throughout the releases, the
requirement-adaptive strategy has stable on-release
migration costs and acceptable latency at relatively
low cumulated costs. Thus, depending on the
SLAs, stakeholders are well advised to choose the
requirement-adaptive strategy if they want to decide
for a compromise between the competing metrics,
avoid budget peaks like with the incremental strategy,
avoid constantly high costs with the eager strategy,
and avoid constantly high latency with the lazy
strategy. With the requirement-adaptive strategy
stakeholders can reckon with very stable on-release
migration costs and relatively low cumulated charges.
We argue that once cost transparency is estab-
lished and the option of self-adaptive strategies ex-
ists for stakeholders, their preferences regarding the
tradeoffs will converge to the best compromise with
regard to the SLAs, which would have been consid-
ered too risky without automation.
5 RELATED WORK
Schema Evolution. Frameworks managing schema
changes in relational databases have been studied
in (Aulbach et al., 2009; Cleve et al., 2015; Curino
et al., 2013; Herrmann et al., 2017). Schema evolu-
tion in XML has been investigated in (Bertino et al.,
2002; Guerrini et al., 2005). In respect of real-world
applications backed by relational databases, schema
evolution has been researched empirically (Curino
et al., 2008; Qiu et al., 2013; Skoulis et al., 2015;
Vassiliadis et al., 2016). Schema-flexible NoSQL da-
tabase systems have been researched sparsely. The
MODELSWARD 2022 - 10th International Conference on Model-Driven Engineering and Software Development
284
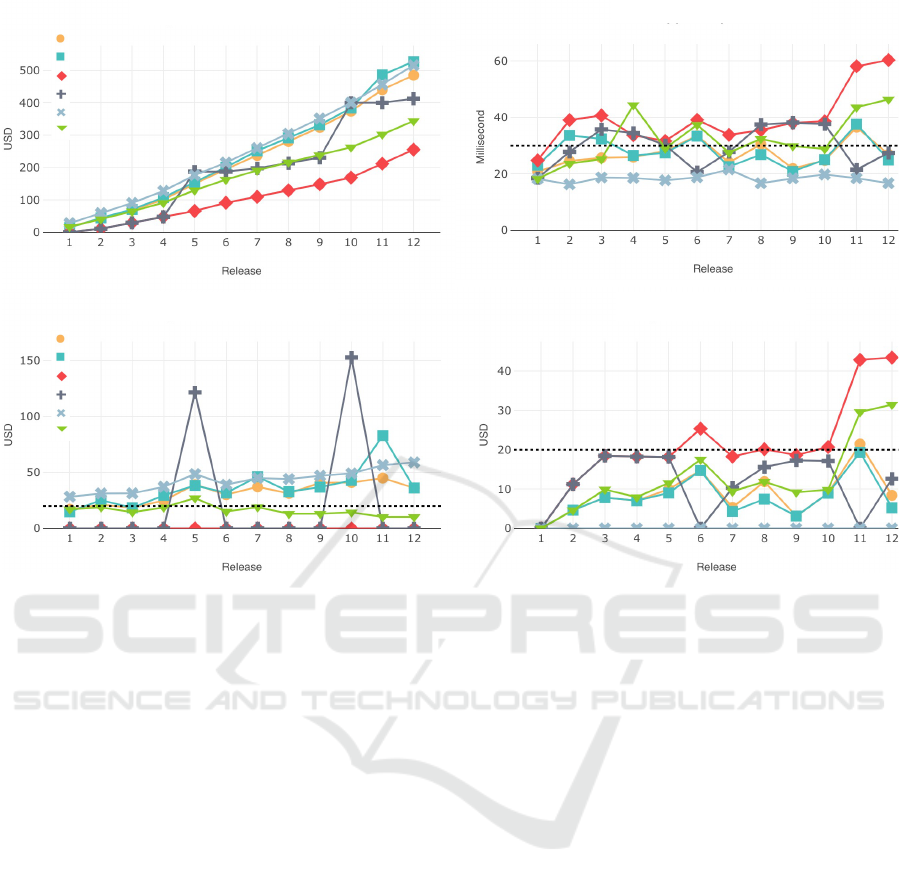
Predictive
Complexity-Adaptive
Lazy
Incremental
Eager
Requirement-
Adaptive
Migration Costs Cumulated
Latency per Entity Access
Migration Costs On-release Migration Costs On-read
Predictive
Complexity-Adaptive
Lazy
Incremental
Eager
Requirement-
Adaptive
Figure 6: Competing metrics of migration costs and latency calculated by our schema migration tool MigCast through 12
releases of schema changes; thresholds set for the requirement-adaptive strategy: USD20 migration costs and 20ms latency.
schema is declared implicitly within the application
code, such that schema changes can be observed
by analyzing the code (Meurice and Cleve, 2017;
Scherzinger and Sidortschuck, 2020). There is ev-
idence that the NoSQL schema evolves more con-
tinuously throughout the project than with relational
databases (Scherzinger and Sidortschuck, 2020). A
study revealed that projects undergo different vol-
umes of schema changes (Vassiliadis, 2021).
Data Migration. (Ellison et al., 2018) investigates
costs and duration of migrating entire databases to
the cloud. When stakeholder consider a database to
be hosted in a cloud, concerns about high costs are
most often cited, tail latency being cited as an is-
sue as well (3T Software Labs Ltd., 2020). Because
eager migration causes considerable costs in cloud-
hosted settings (Ellison et al., 2018; Hillenbrand et al.,
2021a), other migration strategies such as lazy (Klet-
tke et al., 2016; Saur et al., 2016) and proactive (Hil-
lenbrand et al., 2021b) strategies have been proposed.
Self-adaptation. A recommender system is pre-
sented in (Mior et al., 2017) that maps the applica-
tion’s conceptual data model to a NoSQL schema.
Ongoing research focuses on providing automated
schema optimization between different NoSQL data
stores (Conrad et al., 2021). In (Preuveneers and
Joosen, 2020), tuning deployment parameters at
runtime for scalability and performance of data-
intensive applications is addressed for NoSQL sys-
tems. A survey on parameter-tuning approaches
for SQL-on-Hadoop systems examined throughput
and resource utilization, response time, and cost-
effectiveness (Filho et al., 2021). Cloud-enabled
frameworks to perform automatic resizing of NoSQL
clusters were presented in (Tsoumakos et al., 2013).
6 CONCLUSION
We presented the automated curation of variational
data in NoSQL databases through a metric-driven
self-adaptive migration strategy, which are indepen-
dent from stakeholder intervention and from con-
crete situation characteristics. By means of a self-
adaptive migration strategy, we equip stakeholders
with an option to control schema migration automat-
ically. Thereby, stakeholders can replace navigat-
ing a time-consuming heuristic and moderate the im-
pact on SLA-derived metrics when reorganizing the
database, even if migration situation characteristics
are unknown or hard to predict.
Automated Curation of Variational Data in NoSQL Databases through Metric-driven Self-adaptive Migration Strategies
285

ACKNOWLEDGEMENTS
This work has been funded by the German Research
Foundation (#385808805). We thank Jan-Christopher
Mair, Kai Pehns, Tobias Kreiter, Shamil Nabiyev, and
Maksym Levchenko (Darmstadt University of Ap-
plied Sciences) for their contributions to MigCast.
REFERENCES
3T Software Labs Ltd. (2020). MongoDB Trends Report.
Cambridge, U.K.
Aulbach, S., Jacobs, D., Kemper, A., and Seibold, M.
(2009). A Comparison of Flexible Schemas for Soft-
ware as a Service. In Proc. SIGMOD’09. ACM.
Barker, S., Chi, Y., Moon, H. J., Hacig
¨
um
¨
us¸, H., and
Shenoy, P. (2012). “Cut me some slack” latency-aware
live migration for databases. In Proc. EDBT’12.
Bertino, E., Guerrini, G., Mesiti, M., and Tosetto, L. (2002).
Evolving a Set of DTDs According to a Dynamic Set
of XML Documents. In Proc. EDBT’02 Workshops.
Cleve, A., Gobert, M., Meurice, L., Maes, J., and Weber, J.
(2015). Understanding Database Schema Evolution.
Sci. Comput. Program., 97(P1).
Conrad, A., G
¨
artner, S., and St
¨
orl, U. (2021). Towards
Automated Schema Optimization. In ER Demos and
Posters, volume 2958 of Proc. CEUR Workshop.
Curino, C., Jones, E., Popa, R., Malviya, N., Wu, E., Mad-
den, S., Balakrishnan, H., and Zeldovich, N. (2011).
Relational Cloud: A Database-as-a-Service for the
Cloud. In Proc. CIDR 2011.
Curino, C., Moon, H. J., Deutsch, A., and Zaniolo, C.
(2013). Automating the Database Schema Evolution
Process. The VLDB Journal, 22(1).
Curino, C., Moon, H. J., Tanca, L., and Zaniolo, C. (2008).
Schema Evolution in Wikipedia - Toward a Web In-
formation System Benchmark. In Proc. ICEIS’08.
Difallah, D. E., Pavlo, A., Curino, C., and Cudre-Mauroux,
P. (2013). OLTP-bench: An extensible testbed for
benchmarking rel. databases. Proc. VLDB E., 7(4).
Ellison, M., Calinescu, R., and Paige, R. F. (2018). Evaluat-
ing cloud database migration options using workload
models. J. Cloud Computing, 7.
Filho, E. R. L., de Almeida, E. C., Scherzinger, S., and
Herodotou, H. (2021). Investigating Automatic Pa-
rameter Tuning for SQL-on-Hadoop Systems. Big
Data Res., 25.
Fishman, G. (2013). Monte Carlo: Concepts, Algorithms,
and Applications. Springer Series in Operations Re-
search and Financial Engineering. Springer.
Guerrini, G., Mesiti, M., and Rossi, D. (2005). Impact of
XML schema evolution on valid documents. In Proc.
WIDM’05 Workshop. ACM.
Herrmann, K., Voigt, H., Behrend, A., Rausch, J., and
Lehner, W. (2017). Living in Parallel Realities:
Co-Existing Schema Versions with a Bidirectional
Database Evolution Language. In Proc. SIGMOD’17.
ACM.
Hillenbrand, A., Levchenko, M., St
¨
orl, U., Scherzinger, S.,
and Klettke, M. (2019). MigCast: Putting a Price Tag
on Data Model Evolution in NoSQL Data Stores. In
Proc. SIGMOD’19. ACM.
Hillenbrand, A., Scherzinger, S., and St
¨
orl, U. (2021a). Re-
maining in Control of the Impact of Schema Evolution
in NoSQL Databases. In Proc. ER’21, volume 13011
of LNCS. Springer.
Hillenbrand, A., St
¨
orl, U., Levchenko, M., Nabiyev, S., and
Klettke, M. (2020). Towards Self-Adapting Data Mi-
gration in the Context of Schema Evolution in NoSQL
Databases. In Proc. ICDE’20 Workshops. IEEE.
Hillenbrand, A., St
¨
orl, U., Nabiyev, S., and Klettke, M.
(2021b). Self-adapting data migration in the context
of schema evolution in NoSQL databases. Distributed
and Parallel Databases.
Klettke, M., St
¨
orl, U., Shenavai, M., and Scherzinger, S.
(2016). NoSQL schema evolution and big data migra-
tion at scale. In Proc. SCDM’16. IEEE.
Meurice, L. and Cleve, A. (2017). Supporting schema evo-
lution in schema-less NoSQL data stores. In Proc.
SANER’17.
Mior, M. J., Salem, K., Aboulnaga, A., and Liu, R.
(2017). NoSE: Schema Design for NoSQL Applica-
tions. IEEE Trans. Knowl. Data Eng., 29.
Preuveneers, D. and Joosen, W. (2020). Automated Config-
uration of NoSQL Performance and Scalability Tac-
tics for Data-Intensive Applications. Informatics, 7.
Qiu, D., Li, B., and Su, Z. (2013). An empirical analysis
of the co-evolution of schema and code in database
applications. In Proc. SIGSOFT’13. ACM.
Saur, K., Dumitras, T., and Hicks, M. W. (2016). Evolv-
ing NoSQL Databases without Downtime. In Proc.
ICSME’16. IEEE.
Scherzinger, S. and Sidortschuck, S. (2020). An Empir-
ical Study on the Design and Evolution of NoSQL
Database Schemas. In Proc. ER’20. Springer.
Skoulis, I., Vassiliadis, P., and Zarras, A. (2015). Grow-
ing up with Stability: How Open-Source Relational
Databases Evolve. Information Systems, 53.
St
¨
orl, U., M
¨
uller, D., Tekleab, A., Tolale, S., Stenzel, J.,
Klettke, M., and Scherzinger, S. (2018). Curating
Variational Data in Applic. Devel. In Proc. ICDE’18.
Tsoumakos, D., Konstantinou, I., Boumpouka, C., Sioutas,
S., and Koziris, N. (2013). Automated, Elastic
Resource Provisioning for NoSQL Clusters Using
TIRAMOLA. In CCGrid’13. IEEE.
Vassiliadis, P. (2021). Profiles of Schema Evolution in Free
Open Source Software Projects. In Proc. ICDE’21.
IEEE.
Vassiliadis, P., Zarras, A., and Skoulis, I. (2016). Gravitat-
ing to Rigidity: Patterns of Schema Evolution-and its
Absence-in the Lives of Tables. Information Sys., 63.
MODELSWARD 2022 - 10th International Conference on Model-Driven Engineering and Software Development
286
