
Framework to Predict Energy Prices and Trades in the Wholesale
Market of PowerTAC
Filipe Pinto Reis
a
, Helena Viegas Ferreira
b
and Ana Paula Rocha
c
Faculdade de Engenharia da Universidade do Porto, Rua Dr. Roberto Frias, 4200-465, Porto, Portugal
Keywords:
Energy Market Prediction, Energy Market Simulation, Microservice Architecture, Machine Learning, Deep
Learning, Regression, Classification.
Abstract:
Machine and Deep Learning techniques have been widely used in the PowerTAC competition to forecast the
price of energy as a bulk, amongst other ends. In order to allow agents to quickly set up, train, and test
python-built models, we developed a framework based on a micro-service architecture suitable for predicting
wholesale market prices in PowerTAC. The architecture allows for algorithms to be implemented in Python as
opposed to the language used in PowerTAC, Java. This paper also presents two datasets, one for the task of
classifying whether trades occur, and another for the task of predicting the clearing price of trades that occur.
We benchmark these results with basic methods like linear regression, random forest, and a neural network.
1 INTRODUCTION
Until the rise of renewable energy, fossil fuels were
the main source of energy and because of their
method of extraction, their supply is easy to predict.
However, this non-renewable energy is unsustainable
and creates a very negative impact on the environ-
ment because of the greenhouse gases, as (Lashof
and Ahuja, 1990) have shown. Renewable energy is
great for the environment, but it also has a downside.
The production depends on natural phenomenons that
can’t be controlled (Mackay et al., 2010), which
makes the stock unpredictable. This urged authors
like (Kani et al., 2020) and (Shahriari et al., 2020)
to find ways to improve this predictability.
Due to its complexity, the energy retail market can
not be analyzed by simple game-theory, so a simu-
lated environment was created to study and evaluate
brokers economically motivated in the retail energy
markets. PowerTAC is an open, competitive market
simulation platform that models a regulated distribu-
tion utility, a wholesale market, and a population of
energy customers. An agent wins a simulation by ob-
taining the largest balance at the end of the competi-
tion (Ketter et al., 2020).
In this simulation brokers buy and sell energy in
three different markets.
a
https://orcid.org/0000-0002-8186-3910
b
https://orcid.org/0000-0001-8526-5785
c
https://orcid.org/0000-0002-8129-9758
• The Wholesale market in the PowerTAC simula-
tor works as a periodic double auction (PDA) and
represents a traditional power exchange such as
NordPool, FERC, or EEX. A set of auctions hap-
pens every simulation hour where the brokers bid
to buy energy in bulk. Every time-slot there are
24 auctions, varying only on when the energy that
they’re bidding on arrives. This means an agent
can buy energy that will arrive anywhere from 1
to 24 hours later. It is possible that, in a given
time-slot, trades do not happen for some of the
future time-slots.
• The tariff market is where brokers retail their en-
ergy to final customers by enticing them to make
an energy contract.
• The load balancing market is a market where bro-
kers can buy or sell energy from each other when-
ever they make bad predictions about how much
energy they need to buy in the wholesale market,
i.e., they buy too much or too little energy.
Our work focuses only on the wholesale market,
more specifically, solving two problems. Predicting
when trades occur and, if they do, what’s the clearing
price for the energy. For simplification’s sake, instead
of making predictions for all 24 bidding slots that oc-
cur each slot, we only consider the first slot, where the
energy that is bid on is received one time-slot after the
bidding takes place.
Reis, F., Ferreira, H. and Rocha, A.
Framework to Predict Energy Prices and Trades in the Wholesale Market of PowerTAC.
DOI: 10.5220/0010898000003116
In Proceedings of the 14th International Conference on Agents and Artificial Intelligence (ICAART 2022) - Volume 1, pages 359-366
ISBN: 978-989-758-547-0; ISSN: 2184-433X
Copyright
c
2022 by SCITEPRESS – Science and Technology Publications, Lda. All rights reserved
359

In PowerTAC, all the information is provided to
the broker agent by asynchronous messages. At the
beginning of a game, after the brokers sign in but be-
fore the brokers start playing, each broker receives
the game parameters, the broker identities, the cus-
tomer records, and the default tariffs. During two fic-
tional weeks, no competitor can buy or sell energy in
the market. The information about the bootstrap cus-
tomer data, the bootstrap market data, the bootstrap
weather data, the weather report, and the weather
forecast of these two weeks is also received before the
game starts. The bootstrap market data does not cor-
rectly reflect the future clearing prices because only
a single standard seller exists. Once per time-slot,
the predictor will receive the public information about
the 24 clearing prices of the wholesale market, the
weather report, and the weather forecast. When no
trades occur, neither the message of the wholesale
market clearing data or the wholesale market order
books is provided to the broker agent.
In section 2 a review of different PowerTAC
agents’ approaches is presented, followed by section
3, where the methodology explained. Section 4 shows
the obtained results, along with an analysis of the re-
sults. Finally, section 5 presents the conclusions that
can be drawn from this work, the advantages and lim-
itations of the proposed solution, and aspects for im-
provement in future developments.
2 RELATED WORK
The first PowerTAC competition was in 2012. Since
then, the PowerTAC brokers improve in every edi-
tion. For a complete and holistic view of the competi-
tion, we recommend the work of (Ketter et al., 2020),
which specifies 2020’s competition.
Several agents have their code open source, an ex-
ample of this is the agent SPOT (Chowdhury et al.,
2017), an agent that uses machine learning and suc-
cessfully predicts market prices in a PDA, the Pow-
erTAC wholesale market. Chowdhury et. al used
three machine learning algorithms; a REPTree (De-
cision tree), Linear Regression, and a Multilayer Per-
ceptron (Neural network). They selected some poten-
tial information between the one available in the sim-
ulation at runtime to train a price predictor. Specif-
ically, they used 8 prices from the past bidding, as
recent trading histories reflect the present wholesale
market economy. To predict the energy price in a spe-
cific hour, their models consider the clearing prices
for the previous hour and the price in the matching
time-slot in the past day and week. The rest of their
inputs are weather forecast data, number of partici-
pants in the game, and the moving average prices pre-
dicted by the baseline agent. Besides this, the authors
also investigate the feasibility of using learning strate-
gies to predict the clearing price in the wholesale mar-
ket. The paper demonstrates learning strategies are
promising ways to improve the performance of their
agent, SPOT, in future competitions
¨
Ozdemir and Unland presented some generic data-
driven electricity price forecasting approaches and
prove that weather data can successfully reduce the
electricity price forecasting error up to a certain de-
gree (
¨
Ozdemir and Unland, 2016). Their work uses
additional drivers like weather observation data to
minimize forecasting error. Thoroughly, their hybrid
model firstly makes price predictions based on histor-
ical market-clearing prices. This model alters a sea-
sonal regression model by changing the aged terms
with a belief function. Afterward, those predicted
prices are reassessed by correlating the weather ob-
servations and market-clearing prices.
The Crocodile Agent (Grgi
´
c et al., 2018) was also
very successful by placing third in the finals of Pow-
erTAC 2018. The authors use game theory and the Ef-
ficient Market Hypothesis to model their agent, creat-
ing a complex multi-module agent. Specifically, their
agent contains a Tariff Rate Creator, Smart Tariff Cre-
ator, Tariff Manager, Portfolio Manager, and a Whole-
sale Manager. Their Wholesale Manager uses rein-
forcement learning to minimize a cost-function de-
fined in their work and create bidding strategies.
The agent Maxon (Urban and Conen, 2017) has 4
types of tariffs available. Each of these tariffs is best
suited to different scenarios and is also improved over
time. This agent also makes predictions about how
much energy he’ll need to buy using a multi-linear re-
gression model. Using this prediction, the agent tries
to buy the energy in the wholesale market by placing
orders in different slots in advance, so as to counter
agents trying to monopolize this market.
(Rodr
´
ıguez Gonz
´
alez et al., 2019) has also orga-
nized their agent into well defined modules, namely
Data Management (divided into Customer Data View
and Wholesale Data View), Retail Market (containing
Production Tariff Expert and Consumption Tariff Ex-
pert), and Wholesale Market (featuring the Wholesale
Expert). Regarding the Retail Market, this agent uses
Reinforcement Learning on Markov Decision Pro-
cesses to get two objectives; attract as many producers
as possible and bring in enough consumers to reduce
the energy imbalance in client portfolio. Regarding
the Wholesale Market, the agent uses mathematical
approximations to estimate the price of energy so as
to decide whether to buy, sell, or hold on to energy.
The related work shows a clear interest in mak-
ICAART 2022 - 14th International Conference on Agents and Artificial Intelligence
360

ing price predictions for markets. This validates the
usefulness of our work, because predictions can be
made using machine and deep learning. Our work
presents a micro-service oriented architecture which
makes it possible to use different languages to code
the agent, particularly python, which is a program-
ming language of choice for cutting edge machine
learning approaches. Alongside this advantage, this
architecture also makes code easier to maintain and
test, as it is loosely coupled (Yousif, 2016). The use of
a common interface for all prediction models makes it
easy to train and test several models at the same time.
3 METHODOLOGY
The programming language used in PowerTAC agents
is Java. Despite Java’s many strengths, Python has
been a programming language of choice for data sci-
ence and machine learning, making it perfect to gather
and treat information useful in the wholesale auctions.
This is the reason that lead us to a micro-service ar-
chitecture, where the broker acts as a central service
that communicates with other services with very well
defined responsibilities. The only other service de-
veloped in this work is the forecasting service, which
makes predictions related to the wholesale market,
more specifically, labeling if there will be trades in
a specific time-slot and predicting the clearing price
when the trades do happen. For simplicity’s sake,
we’ll refer to the micro-service with the responsibili-
ties we just described as the prediction module. Fig-
ure 1 contains an overview of the whole system’s ar-
chitecture. While the simulation is running, the bro-
ker is constantly receiving messages. These messages
are broken down into pieces and re-grouped to create
single messages containing a line of features which
can be fed to a machine learning model. Whenever
a new message is ready on the side of the broker, he
sends it to the python server in the prediction mod-
ule. If the prediction module is running on training
mode, it will save this new line to the data sets used
to train the models. If it’s running on testing mode,
the features are passed to each a classifier of each of
the tasks, and the results is returned in the body of the
http response that the prediction model sends to the
broker.
3.1 Broker Agent Service
The broker agent contains listeners that can be pro-
grammed to do different actions upon receiving a
message of a certain type. We’ve identified three
types of messages that matter to us, namely clearing
price, weather report, and weather forecast. We’ve an-
alyzed what’s the correct order these messages should
appear in for each time-slot and created a state ma-
chine to make sure we can build a consistent message
for each time-slot. If we can’t build it, we don’t use
this time-slot to train the models. There’s a clearing
price for each auction of the wholesale market, mak-
ing it 24 clearing prices. Each weather report contains
four fields: temperature, wind direction, wind speed,
and cloud cover. The weather forecast is a agglomer-
ate of 24 messages like the weather report, with the
exception that they’re forecasts for the next 24 time-
slots.
3.2 Forecasting Service
It’s the prediction module’s responsibility to solve
two tasks:
• Predict trade: To predict whether trades will oc-
cur or not, which is a classification problem.
• Predict clearing price: To predict the clearing
price for one energy bidding slot when trades do
occur, which is a regression problem.
On start up, the prediction module will either
train models with a pre-compiled data-set or load pre-
trained models. The models we use are also config-
urable. Each model has to be wrapped in a class that
implements an interface. The purpose of this interface
is to unify the way models are used and easily config-
ure the server to use different regression and classifi-
cation models. When the prediction module receives
a request a pipeline is activated: the server extracts the
JSON response, passes it to a pre-processing module
that unpacks the data and saves it to a file to contin-
uously build a data-set, all configured models make
their predictions, and finally, a pre-configured model
returns the prediction in the http response so that the
broker can use that information in real time.
To predict whether trades occur or not (the clas-
sification problem) we use two models, firstly a Ran-
dom Forest with 100 estimators, no maximum depth
per tree, and mean squared error as the function to
measure the quality of a split. Secondly, a Neural Net-
work with 3 hidden layers of 10 neurons each. Re-
garding the prediction of clearing prices for energy
in bidding slots, we use three models, a Linear Re-
gression, a Random Forest with 400 estimators and
no maximum depth, and a Neural Network with two
hidden layers of 8 and 16 neurons, respectively. The
hyper parameters of the models were chosen ad hoc,
meaning that, in theory, better results can be achieved.
Framework to Predict Energy Prices and Trades in the Wholesale Market of PowerTAC
361
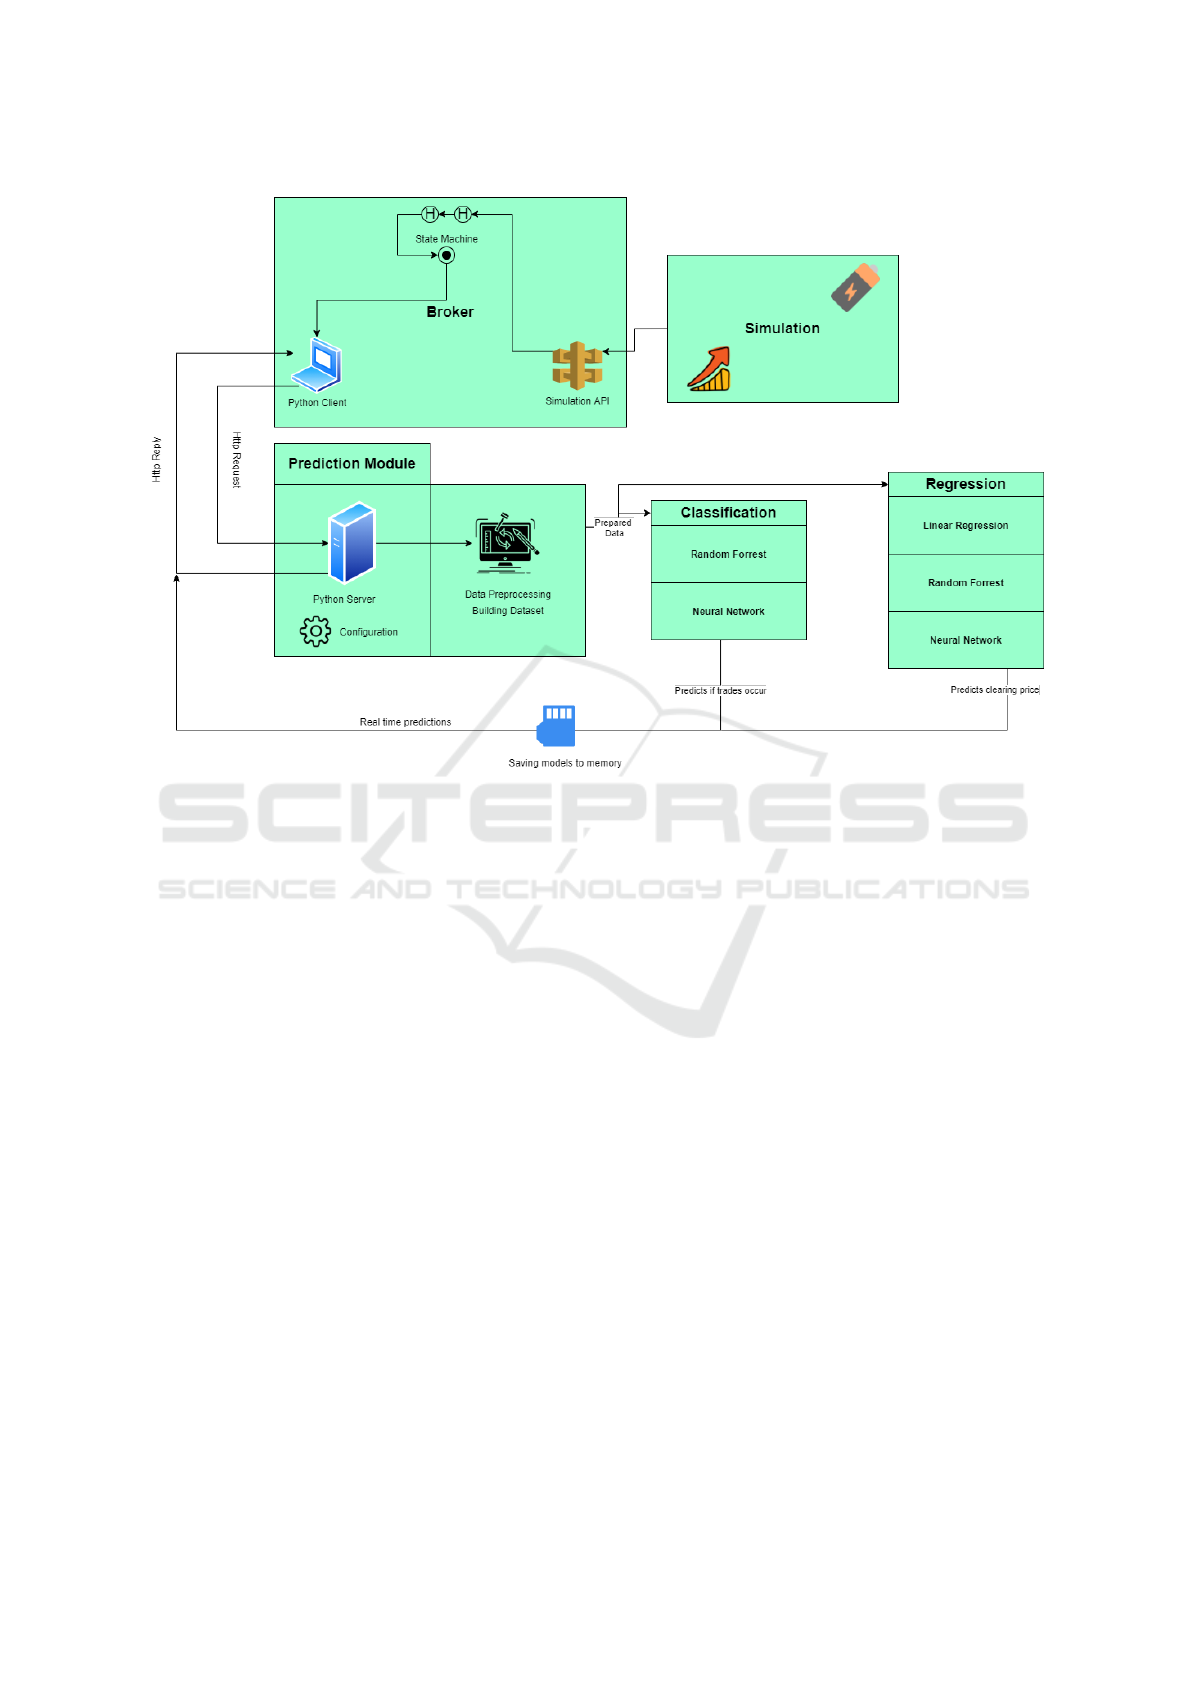
Figure 1: Overview of the architecture.
4 EXPERIMENTS AND RESULT
ANALYSIS
All tests were performed on a computer with an i7-
10510U quad-core processor with 16GB of RAM,
1.80GHz. The proposed prediction approaches have
been tested in a broker agent using the PowerTAC
simulator.
We used the Java version present in the Simula-
tion and Python version 3. All the algorithms and
the cross-validation function used the Scikit-Learn li-
brary.
In order to train, test, and validate the models
we created a data-set containing messages sent by
the broker across different instances of the simulation
with different initial configurations.
The tasks Predict clearing price and Predict trade
have a data set with 27131 and 23678 entries, re-
spectively. The data-set for Predict trade is very un-
balanced, with 999 (4.2%) of the entries have label
0 and 22679 (95.8%) have label 1, as trades occur
most often than not. Both data sets use the same
features, namely, number of competitors, number of
customers, current temperature, current cloud cover,
current wind direction, and current wind speed. In
addition to the previously mentioned, the simulation
also provides a forecast of temperature, cloud cover,
wind direction, and wind speed for the following 24
hours, which we also use as features. The first 6 plus
the following 4 times 24 sums up to 102 features per
line.
The data used by the regression algorithms can
be found on https://github.com/MHelena45/feup-
tne-PowerTAC/blob/main/WholesalePred/data.csv
and the data used by the classification algorithms
can be found on https://github.com/MHelena45/
feup-tne-PowerTAC/blob/main/WholesalePred/
data-classification.csv.
Two sets of evaluation metrics were used to eval-
uate the performance of the algorithms. In regres-
sion, the metrics considered were the mean absolute
error (MAE), the mean squared error (MSE), and the
root mean squared error (RMSE). In classification, the
metrics were the F1 score and accuracy, although F1
score is much more important, since the data-set is
unbalanced. While the former evaluates the error be-
tween predicted prices and actual clearing prices, the
latter uses the forecast label and the correct label.
The distribution of the clearing prices is demon-
strated in figures 2 and 3. The clearing prices vary
between 0.0019 and 76.3560, but are mostly concen-
ICAART 2022 - 14th International Conference on Agents and Artificial Intelligence
362
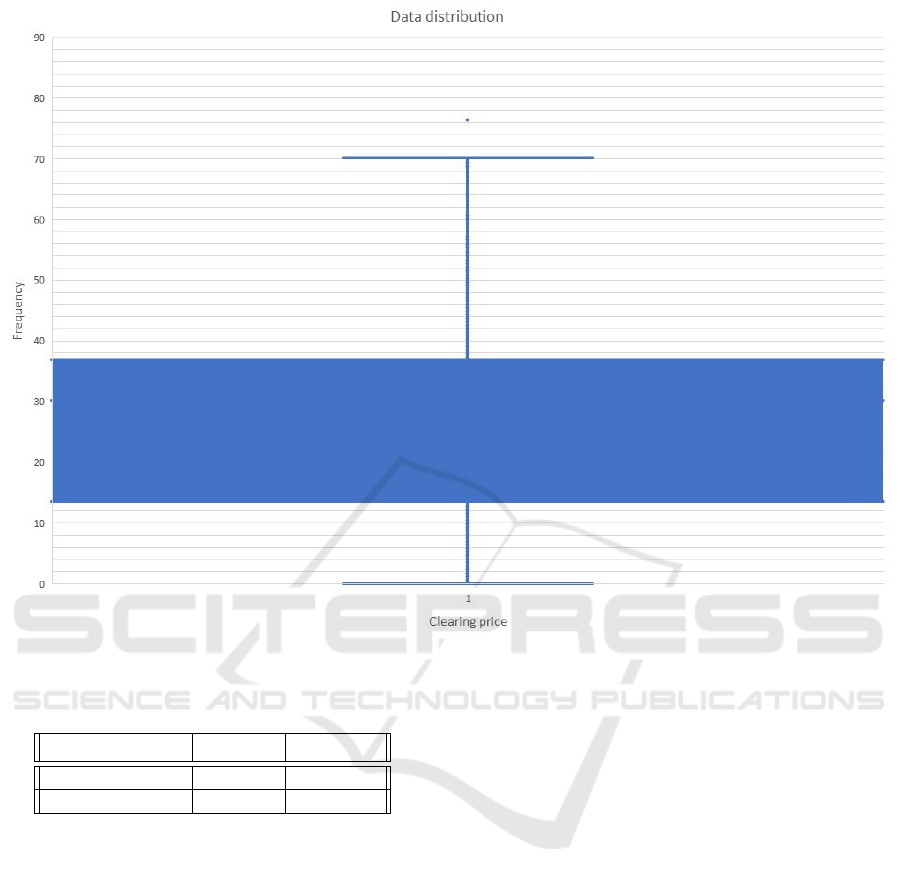
Figure 2: Box plot with the clearing prices.
Table 1: Results of different evaluation metrics for the clas-
sification algorithms.
F1 score Accuracy
Random Forest 0.9965 0.9933
Neural Network 0.9980 0.9961
trated in the range 14 to 37. The range that had the
highest frequency was 36.80 to 38.40.
4.1 Classification Algorithms for
Predicting Trade
This section presents the cross-validation results for
the task of classifying whether trades will occur in a
given time-slot or not.
In the figures 4 and 5, relative to Random For-
est and the Neural Network, respectively, the instant
score is measured: if the predicted label was differ-
ent than the correct label, the accuracy and the F1
score would be 0 in that time-slot; if the predicted la-
bel is equal to the correct label, the accuracy and the
F1 score would be 1.
The results of the 5-Folds cross-validation of the
classification algorithms are present in table 1. Both
the Neural Network and the Random Forest algo-
rithms have accuracy and an F1 score close to one,
making both excellent to predict trades in the whole-
sale market.
4.2 Regression Algorithms to Predict
Clearing Prices
The section presents the results of the regression al-
gorithms used for price predicting. The metrics mea-
sured are the mean absolute error and the root mean
squared error. In addition, it provides these two
metrics and the mean squared error for the cross-
validation.
The figures 6, 7, and 8 show the instant error using
Linear Regression, Random Forest and Neural Net-
work, respectively. The instant error represented here
includes two values: the value of the mean absolute
error; and the value of the root mean squared error in
each time-slot, without considering the error of previ-
ous time-slots. In the regression algorithms, the error
can vary between zero and a finite positive number.
When all errors are zero, the value predicted is the
same as the actual value.
Framework to Predict Energy Prices and Trades in the Wholesale Market of PowerTAC
363
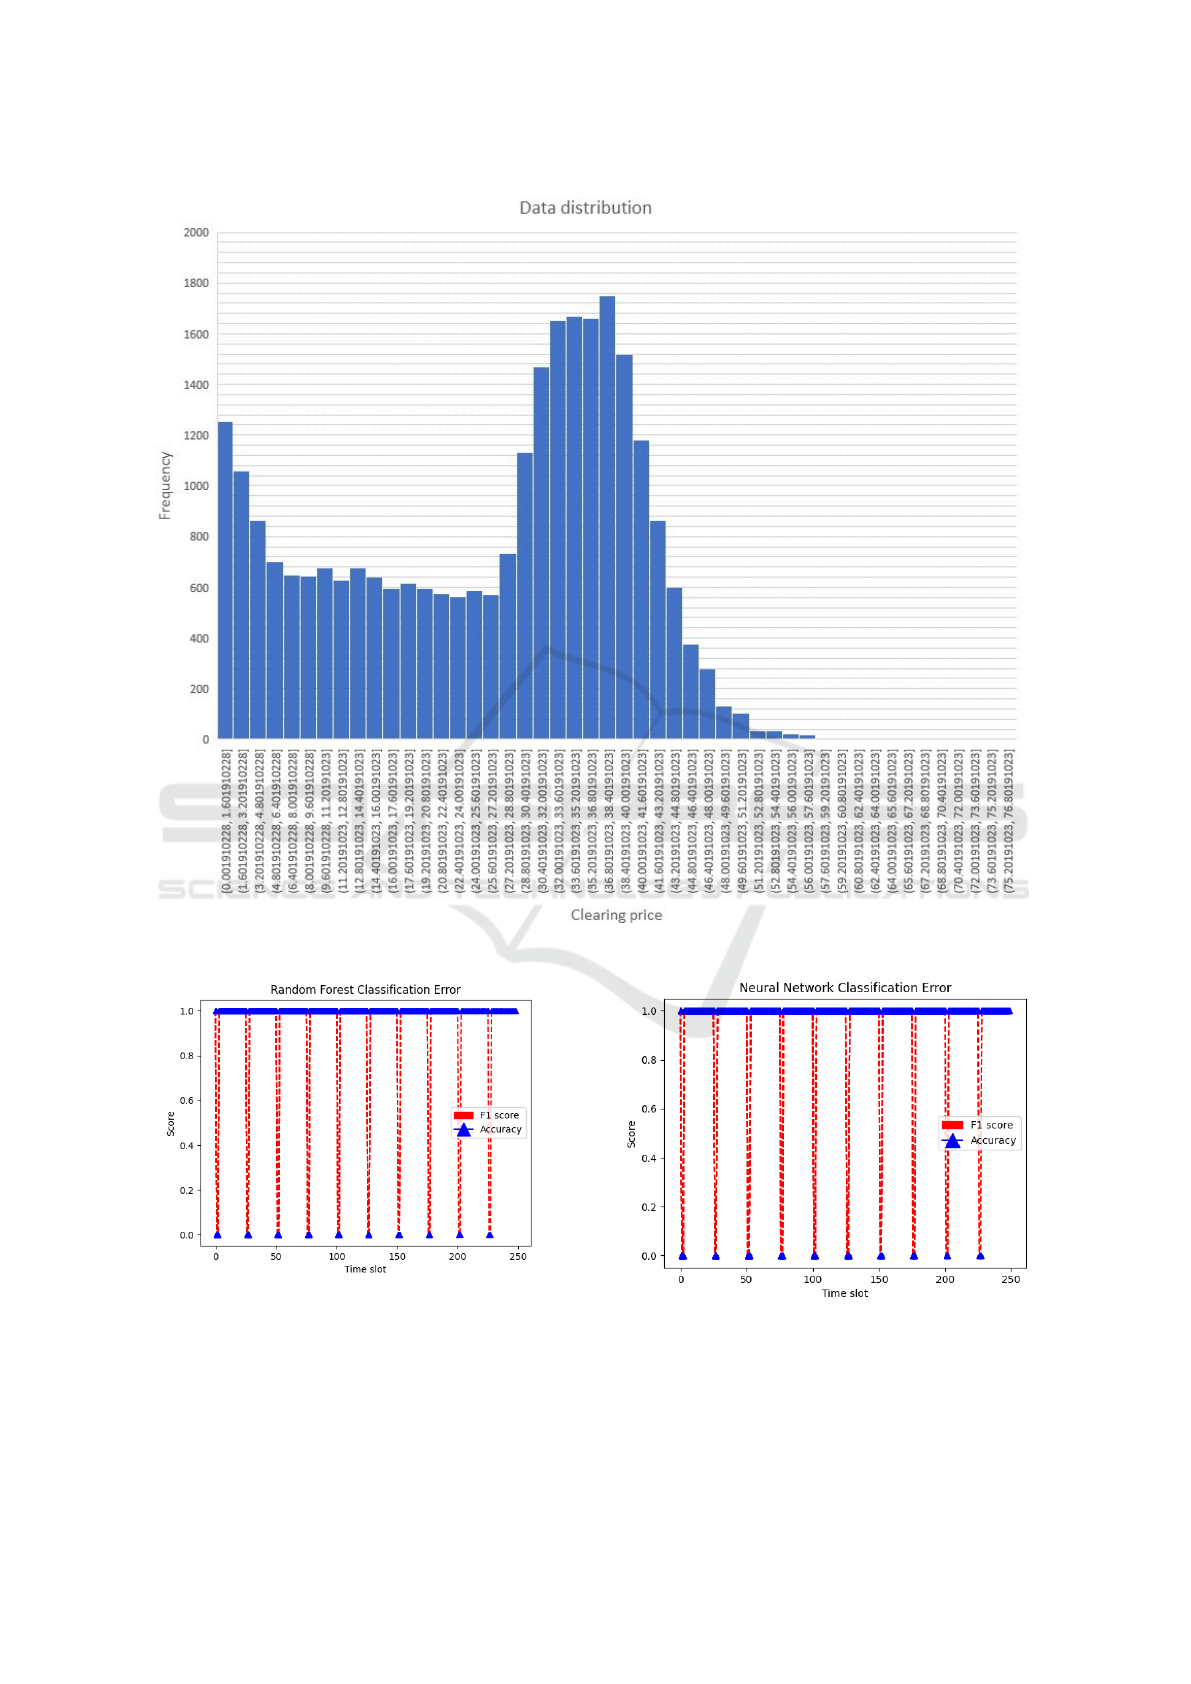
Figure 3: Histogram with the clearing prices.
Figure 4: Random Forest Classification accuracy and F1
score in real time, after 250 time-slots.
The results of the 5-Folds cross-validation of the
regression algorithms are present in table 2. The re-
gression algorithms produced significantly different
results. The Random Forest algorithm performed the
Figure 5: Neural Network Classification accuracy and F1
score in real time, after 250 time-slots.
best results, followed by the Neural Network and the
Linear Regression.
ICAART 2022 - 14th International Conference on Agents and Artificial Intelligence
364
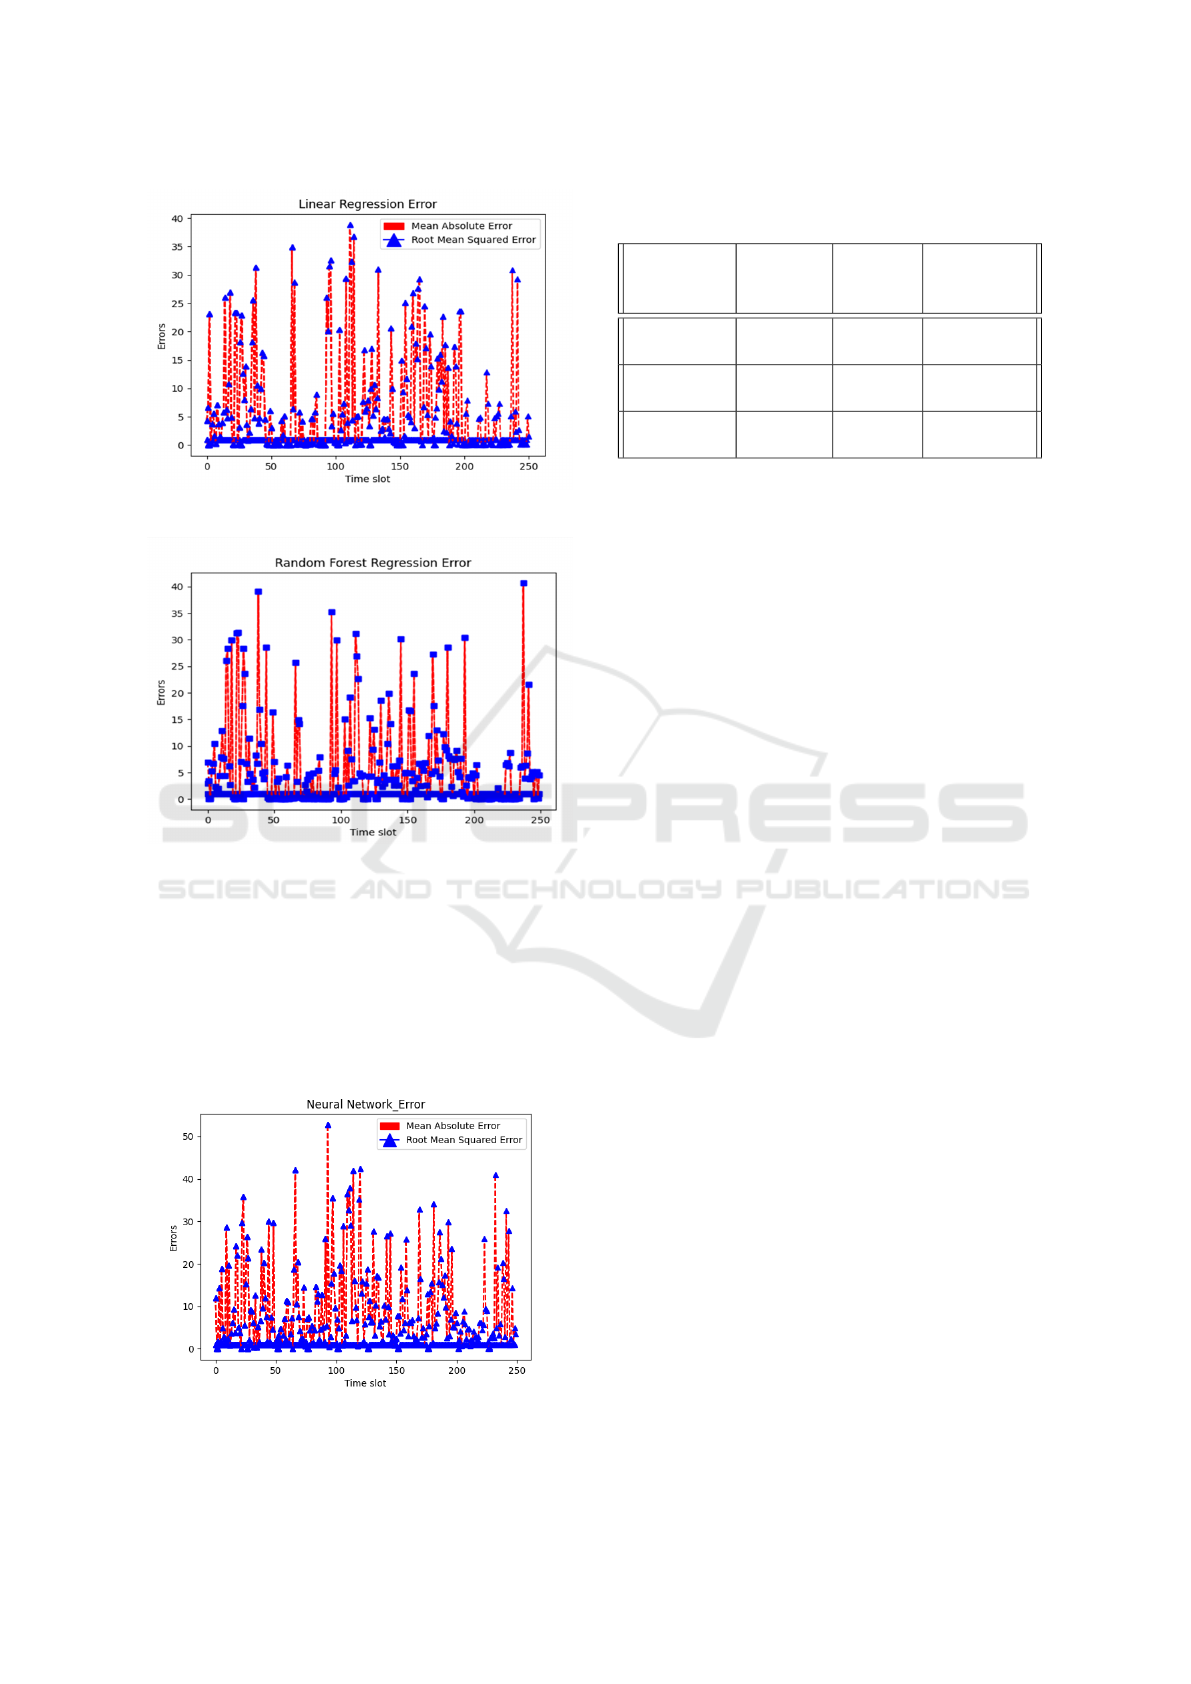
Figure 6: Linear regression MEA and RMSE error in real
time, after 250 time-slots.
Figure 7: Random forest regression MEA and RMSE in real
time, after 250 time-slots.
5 CONCLUSIONS AND FUTURE
WORK
This project created a micro-service based framework
between the PowerTAC brokers written in Java and an
easy to use pipeline that facilitates training and testing
Figure 8: Neural network regression MEA and RMSE in
real time, after 250 time-slots.
Table 2: Results of different evaluation metrics for the re-
gression algorithms.
Mean
Absolute
Error
Mean
Squared
Error
Root Mean
Squared
Error
Random
Forest
5.99 67.31 8.20
Linear
Regression
10.86 167.33 12.94
Neural
Network
6.27 69.60 8.34
results for several models at the same time. We had
a quite successful go at the problems of a) predicting
the price of energy and b) classifying whether sales
occur in a time-slot or not. These two forecasts to-
gether are very useful tools for any PowerTAC agent
that wants to buy energy in the wholesale market at
lower prices. In the future, it would be interesting
to see how other models such as recurrent neural net-
works behave in the task of predicting clearing prices.
In addition, it would be relevant to understand which
are the most significant features and perform feature
engineering on the data.
REFERENCES
Chowdhury, M. M. P., Folk, R. Y., Fioretto, F., Kiekintveld,
C., and Yeoh, W. (2017). Investigation of learning
strategies for the spot broker in power tac. In Ceppi,
S., David, E., Hajaj, C., Robu, V., and Vetsikas, I. A.,
editors, Agent-Mediated Electronic Commerce. De-
signing Trading Strategies and Mechanisms for Elec-
tronic Markets, pages 96–111, Cham. Springer Inter-
national Publishing.
Grgi
´
c, D., Vdovi
´
c, H., Babic, J., and Podobnik, V. (2018).
Crocodileagent 2018: Robust agent-based mecha-
nisms for power trading in competitive environments.
Computer Science and Information Systems, 16:40–
40.
Kani, S. A. P., Wild, P., and Saha, T. K. (2020). Improving
predictability of renewable generation through opti-
mal battery sizing. IEEE Transactions on Sustainable
Energy, 11(1):37–47.
Ketter, W., Collins, J., and Weerdt, M. d. (2020). The 2020
power trading agent competition. ERIM Report Series
Reference 2020-002.
Lashof, D. A. and Ahuja, D. R. (1990). Relative contribu-
tions of greenhouse gas emissions to global warming.
Nature, 344(6266):529–531.
Mackay, E. B., Bahaj, A. S., and Challenor, P. G. (2010).
Uncertainty in wave energy resource assessment. part
2: Variability and predictability. Renewable Energy,
35(8):1809–1819.
¨
Ozdemir, S. and Unland, R. (2016). Wholesale Bid-
ding Approaches of an Autonomous Trading Agent
Framework to Predict Energy Prices and Trades in the Wholesale Market of PowerTAC
365

in Electricity Markets. In Derksen, C. and Weber,
C., editors, 3rd and 4th International Conference on
Smart Energy Research (SmartER Europe 2016 and
2017), volume AICT-495 of Smart Energy Research.
At the Crossroads of Engineering, Economics, and
Computer Science, pages 90–104, Essen, Germany.
Springer International Publishing. Part 1: SmartER
Europe 2016.
Rodr
´
ıguez Gonz
´
alez, A. Y., Palacios Alonso, M., Lezama,
F., Rodr
´
ıguez, L., Mu
˜
noz de Cote, E., Morales, E. F.,
Enrique Sucar, L., and Crockett, D. D. (2019). A com-
petitive and profitable multi-agent autonomous broker
for energy markets. Sustainable Cities and Society,
49:101590.
Shahriari, M., Cervone, G., Clemente-Harding, L., and
Delle Monache, L. (2020). Using the analog ensem-
ble method as a proxy measurement for wind power
predictability. Renewable Energy, 146:789–801.
Urban, T. and Conen, W. (2017). Maxon16: A success-
ful power tac broker. In Proceedings of the Interna-
tional Workshop on Agent-Mediated Electronic Com-
merce and Trading Agents Design and Analysis.
Yousif, M. (2016). Microservices. IEEE Cloud Computing,
3(5):4–5.
ICAART 2022 - 14th International Conference on Agents and Artificial Intelligence
366
