
Classifying Alzheimer’s Disease using MRIs and Transcriptomic Data
∗
Lucia Maddalena
1 a
, Ilaria Granata
1 b
, Maurizio Giordano, Mario Manzo
2 c
,
Mario Rosario Guarracino
3 d
and Alzheimer’s Disease Neuroimaging Initiative (ADNI)
∗
1
Inst. for High-Performance Computing and Networking, National Research Council,Via P. Castellino, 111, Naples, Italy
2
Information Technology Services, University of Naples “L’Orientale”,Via Nuova Marina, 59, Naples, Italy
3
University of Cassino and Southern Lazio, Cassino, Italy
Keywords:
Data Integration, Alzheimers’ Disease, Omics Imaging, Transcriptomics, Magnetic Resonance Imaging.
Abstract:
Early diagnosis of neurodegenerative diseases is essential for the effectiveness of treatments to delay the onset
of related symptoms. Our focus is on methods to aid in diagnosing Alzheimer’s disease, the most widespread
neurocognitive disorder, that rely on data acquired by non-invasive techniques and that are compatible with
the limitations imposed by pandemic situations. Here, we propose integrating multi-modal data consisting of
omics (gene expression values extracted by blood samples) and imaging (magnetic resonance images) data,
both available for some patients in the Alzheimer’s Disease Neuroimaging Initiative dataset. We show how
a suitable integration of omics and imaging data, using well-known machine learning techniques, can lead to
better classification results than any of them taken separately, also achieving performance competitive with the
state-of-the-art.
1 INTRODUCTION
Dementia is a public health problem that affects about
50 million people in the world (WHO, 2019). It
is growing rapidly, counting around 10 million new
cases worldwide each year, with an estimate that this
number will triple by 2050. Dementia manifests itself
with a cognitive decline of the patient leading to the
inability to carry out daily life activities (Birkenbihl
et al., 2020). In addition to devastating the lives of pa-
tients and their families, this disease has a significant
economic burden on society, estimated at around 600
billion $ per year in 2013 (Birkenbihl et al., 2020) and
a
https://orcid.org/0000-0002-0567-4624
b
https://orcid.org/0000-0002-3450-4667
c
https://orcid.org/0000-0001-8727-9865
d
https://orcid.org/0000-0003-2870-8134
∗
The Alzheimer’s Disease Neuroimaging Initia-
tive: Data used in preparation of this article were
obtained from the Alzheimer’s Disease Neuroimag-
ing Initiative (ADNI) database (adni.loni.usc.edu). As
such, the investigators within the ADNI contributed
to the design and implementation of ADNI and/or
provided data but did not participate in analysis or
writing of this report. A complete listing of ADNI
investigators can be found at: http://adni.loni.usc.edu/wp-
content/uploads/how to apply/ADNI Acknowledgement
List.pdf
expected to reach around 2 trillion $ per year in 2030
(WHO, 2019). The most common of the forms of
dementia, Alzheimer’s disease (AD), is a progressive
disease whose pathology begins years before the cog-
nitive symptoms appear and are diagnosed by the clin-
ician. Early intervention, in the pre-symptomatic and
not cognitively disabling stages of the disease, is in-
strumental in any future therapy aimed at treating the
disease (Birkenbihl et al., 2021). Indeed, the effec-
tiveness of the treatment often depends on the stage
of the disease. For example, dietary supplements of
folic acid and vitamin B have been shown to improve
cognitive deficits in patients with mild AD, while they
are of little benefit to patients with severe AD (Lee
and Lee, 2020). However, early intervention poses
the problem of diagnosing a patient with AD before
the cognitive symptoms indicate the presence of the
disease itself. An approach to this problem is based
on the analysis of informative biomarkers of the dis-
ease, whose discovery and validation are possible by
having large sets of data available (Birkenbihl et al.,
2021).
In recent years, several longitudinal studies
(groups of patients followed over time in a set of
consecutive specialist investigations) have been con-
ducted to identify biomarkers for the early diagno-
sis of AD and to estimate progression from the in-
70
Maddalena, L., Granata, I., Giordano, M., Manzo, M., Guarracino, M. and Alzheimer’s Disease Neuroimaging Initiative (ADNI), .
Classifying Alzheimer’s Disease using MRIs and Transcriptomic Data.
DOI: 10.5220/0010902900003123
In Proceedings of the 15th International Joint Conference on Biomedical Engineering Systems and Technologies (BIOSTEC 2022) - Volume 2: BIOIMAGING, pages 70-79
ISBN: 978-989-758-552-4; ISSN: 2184-4305
Copyright
c
2022 by SCITEPRESS – Science and Technology Publications, Lda. All rights reserved
termediate state of the disease (Mild Cognitive Im-
pairment, MCI) to the final AD stage, or possibly
to its regression (Cognitively Normal, CN) (Birken-
bihl et al., 2021; Lovestone et al., 2009; Mueller
et al., 2005). The related datasets collect differ-
ent data modalities, which generally include demo-
graphic variables (age, sex, education, etc.), clinical
evaluation (results of cognitive tests, such as MMSE
- Mini Mental State Examination; CDR-SB - Clinical
Dementia Rating Scale Sum of Boxes; AD Assess-
ment Scale ADAS-Cog11 and ADAS-Cog13), geno-
type (status of APOE4 - the apolipoprotein-e4 gene
which represents the major risk factor for AD; sin-
gle nucleotide polymorphisms - SNP - associated
with AD) and magnetic resonance imaging (MRI),
to quantify the atrophy of areas of the brain from
volumes, cortical thickness and surface areas. More
recently, further imaging modalities are being made
available, including Positron Emission Tomography
(PET) with FDG-fluorodeoxyglucose, which mea-
sures cell metabolism, or Diffusion Tensor Imag-
ing (DTI), for estimation of microstructural param-
eters related to cells and axons. Other modalities
sometimes considered include measurements of cere-
brospinal fluid (CSF), to estimate the levels of the pro-
tein markers beta-amyloid, tau and phosphorylated
tau, or transcriptomics data, such as gene expression
(GE) values extracted from biopsy/autopsy or blood.
Much of the studies based on existing longitudi-
nal datasets are devoted to predicting the progression
of the disease over time, as illustrated in recent sur-
veys (Lawrence et al., 2017; Mart
´
ı-Juan et al., 2020).
Other research is aimed at the diagnosis of each pa-
tient, to classify the degree of disease (CN, MCI or
AD) based on the results of a predetermined visit. Ex-
amples include methods based on various omics data,
such as GE data (Lee and Lee, 2020; Li et al., 2018;
Voyle et al., 2016), or imaging data, such as MRIs and
PETs (Aderghal et al., 2017; Aderghal et al., 2018;
B
¨
ackstr
¨
om et al., 2018; Li and Liu, 2018; Shi et al.,
2018; Bae et al., 2020). Some research started fo-
cusing on the integration of omics data with infor-
mation from bio-medical images (Nho et al., 2016;
Peng et al., 2016; Maddalena et al., 2020; Maddalena
et al., 2021). Bringing together information coming
from different sources, these omics imaging meth-
ods (Antonelli et al., 2019) can lead to revealing hid-
den genotype-phenotype relationships, with the aim
of better understanding the onset and progression of
many diseases and identifying new diagnostic and
prognostic biomarkers.
Our research aims to develop methods for the clas-
sification of patients potentially affected by AD that
are helpful for the clinical diagnosis of the disease and
that exploit multi-modal information on the patient’s
status that is readily available. In view of the current
pandemic, which limits the possibility of patient ac-
cess to dedicated and highly specialized medical in-
frastructures, here we are interested in the early diag-
nosis of AD based on the results of individual exam
sessions rather than on longitudinal studies. Further-
more, we focus on those multi-modal data that can be
collected through easily accessible and not extremely
invasive procedures (such as blood tests and MRIs,
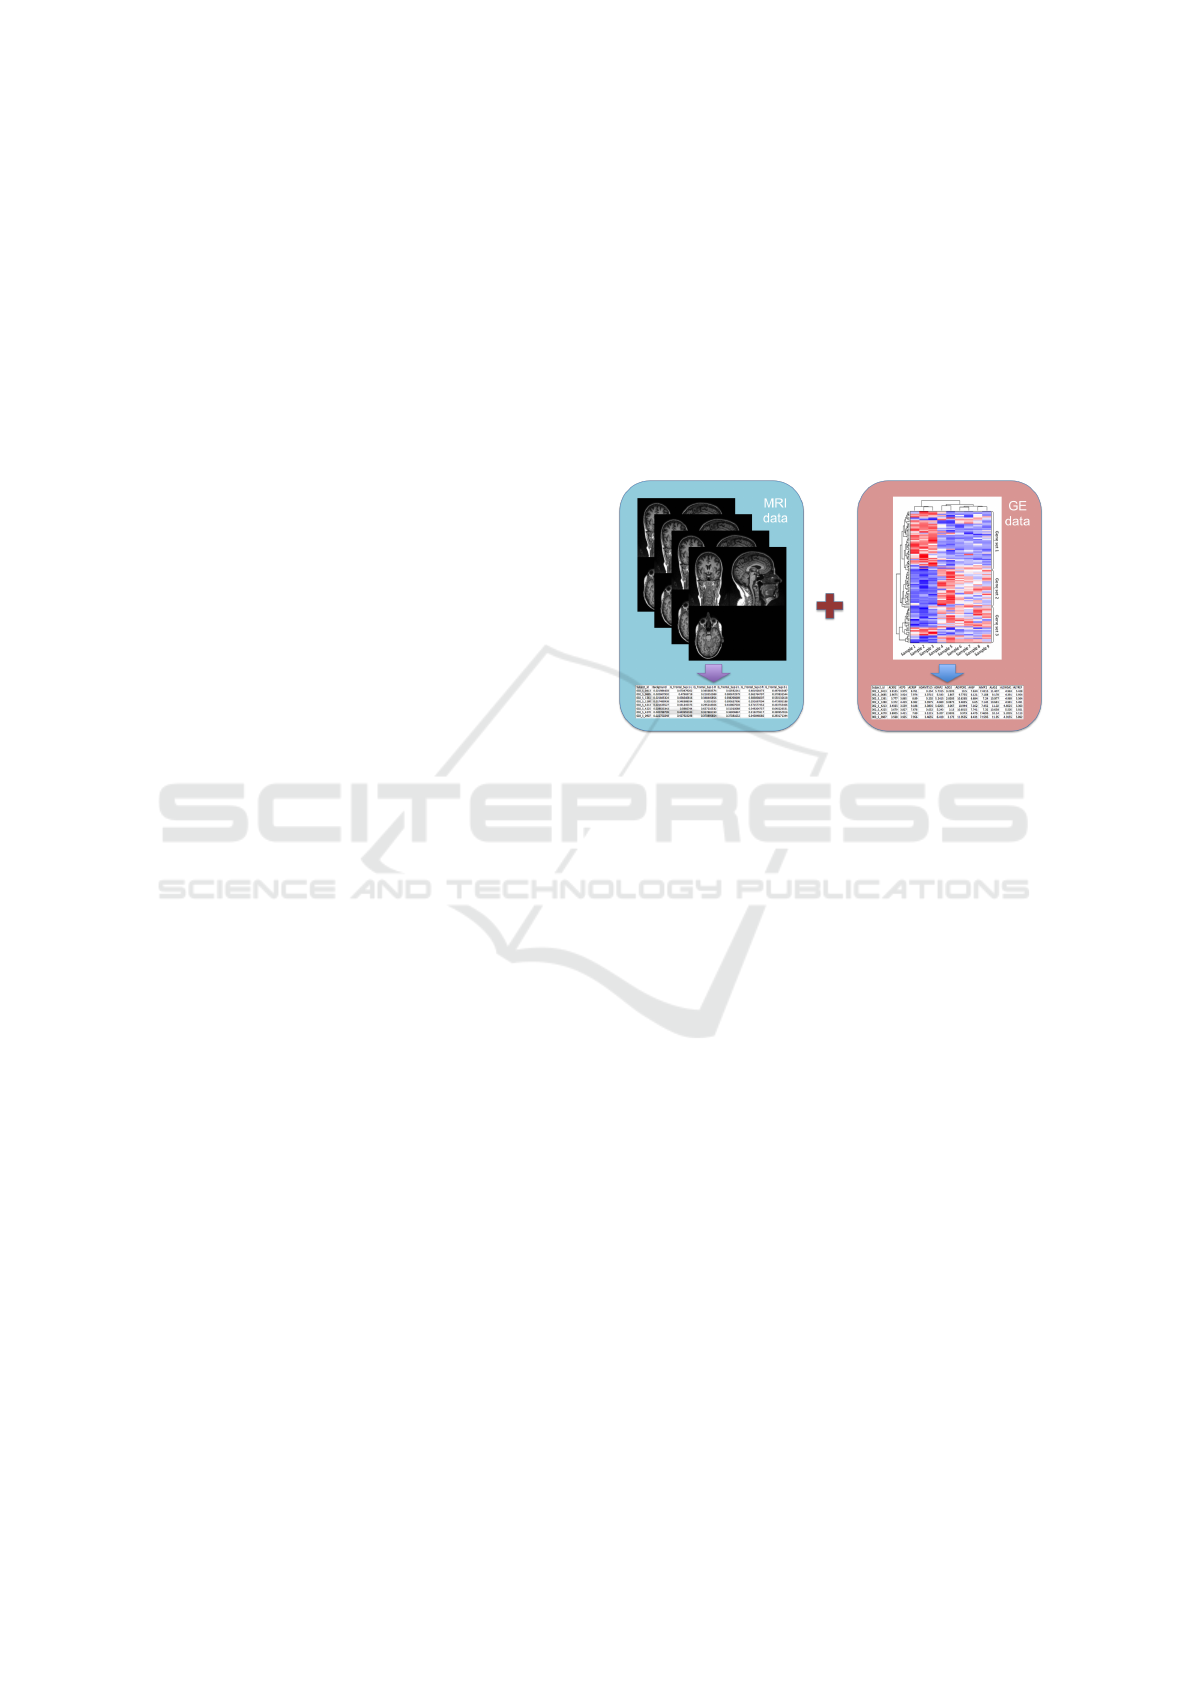
see Fig. 1), thus excluding, for example, those com-
ing from brain tissue or CSF.
Figure 1: Omics imaging data adopted for the experiments.
We show how a suitable integration of imaging
and omics features can lead to better results than
any of them taken separately. The proposed ap-
proach, based on existing machine learning tech-
niques, achieves accuracy performance competitive
with state-of-the-art methods, often based on deep
learning.
The paper is organized as follows. Section 2 ex-
plains the proposed method, describing the extrac-
tion procedure for both types of features, imaging
and omics, adopted. Section 3 discusses the results
achieved with the proposed framework and compares
them with those obtained with state-of-the-art ap-
proaches. Finally, Section 4 concludes our paper and
gives some future research directions.
2 MATERIAL AND METHODS
Data used in the preparation of this article were ob-
tained from the Alzheimer’s Disease Neuroimaging
Initiative (ADNI) database (adni.loni.usc.edu). The
ADNI was launched in 2003 as a public-private part-
nership, led by Principal Investigator Michael W.
Weiner, MD. The primary goal of ADNI has been to
test whether serial MRI, PET, other biological mark-
ers, and clinical and neuropsychological assessment
can be combined to measure the progression of MCI
Classifying Alzheimer’s Disease using MRIs and Transcriptomic Data
71
and early AD.
As our intent was to consider multi-modal infor-
mation integrating omics and imaging data acquired
by non-invasive techniques, we considered gene ex-
pression values extracted by blood samples and MRIs.
GE data from blood samples, collected between 2010
and 2012, is available for 744 ADNI patients. Only
720 of them also have T1-weighted MRIs in the same
time period. According to the baseline visit, 42 pa-
tients have been classified as AD, 428 as MCI, and
250 as CN, as summarized in Table 1.
Table 1: Classification of the selected subset of 720 ADNI
patients for which both GE and MRI data are available.
AD MCI CN
42 428 250
2.1 Extraction of Imaging Features
Imaging features from MRIs have been extracted us-
ing an open-source framework for reproducible evalu-
ation of AD classification using conventional machine
learning methods (Samper-Gonz
´
alez et al., 2018), re-
cently extended to include deep learning CNN-based
methods (Wen et al., 2020), named ClinicaDL. The
framework comprises i) tools to automatically convert
three publicly available datasets, including ADNI,
into the Brain Imaging Data Structure (BIDS) format
(Gorgolewski et al., 2016) and ii) a modular set of pre-
processing pipelines, feature extraction and classifica-
tion methods, together with an evaluation framework,
that provide a baseline for benchmarking the different
components. Its extension includes a modular set of
image preprocessing procedures, CNN classification
architectures, and evaluation procedures dedicated to
deep learning. The benchmarking presented in (Wen
et al., 2020) shows that various 3D CNN approaches
achieved similar performances, higher than those of
the 2D slice approach, but still comparable to those
achieved via Support Vector Machine (SVM) (Vap-
nik, 1995) using voxel-based features. Therefore, we
adopted the framework to generate the voxel-based
features from MRIs.
The ADNI MRI data have been curated and con-
verted to the BIDS format using Clinica (Routier
et al., 2021; Samper-Gonz
´
alez et al., 2018). Then the
T1-volume pipeline of Clinica was adopted, which
is a wrapper of the Segmentation, Run Dartel, and
Normalise to MNI (Montreal Neurological Institute)
Space routines implemented in the Statistical Para-
metric Mapping (SPM, https://www.fil.ion.ucl.ac.uk/
spm/) package. First, the Unified Segmentation pro-
cedure (Ashburner and Friston, 2005) is adopted to
simultaneously perform tissue segmentation, bias cor-
rection, and spatial normalization of each input im-
age. Next, a group template is created using DAR-
TEL, an algorithm for diffeomorphic image regis-
tration (Ashburner, 2007), from the subjects’ tissue
probability maps on the native space, obtained at the
previous step. The DARTEL to MNI method (Ash-
burner, 2007) is then applied, providing the registra-
tion of the native space images into the MNI space.
As a result, all the images are in a common space, pro-
viding a voxel-wise correspondence across subjects.
A set of imaging features is extracted based on re-
gional measurements, where the anatomical regions
are obtained by an atlas in MNI space, and the av-
erage gray matter density is computed in each of the
regions. In the experiments, the AICHA (Joliot et al.,
2015) atlas (providing 385 regional features) has been
chosen as reference atlas for the AD vs. CN and AD
vs. MCI tasks, while the AAL2 (Tzourio-Mazoyer
et al., 2002) atlas (providing 121 regional features)
for the MCI vs. CN task, as they lead to highest clas-
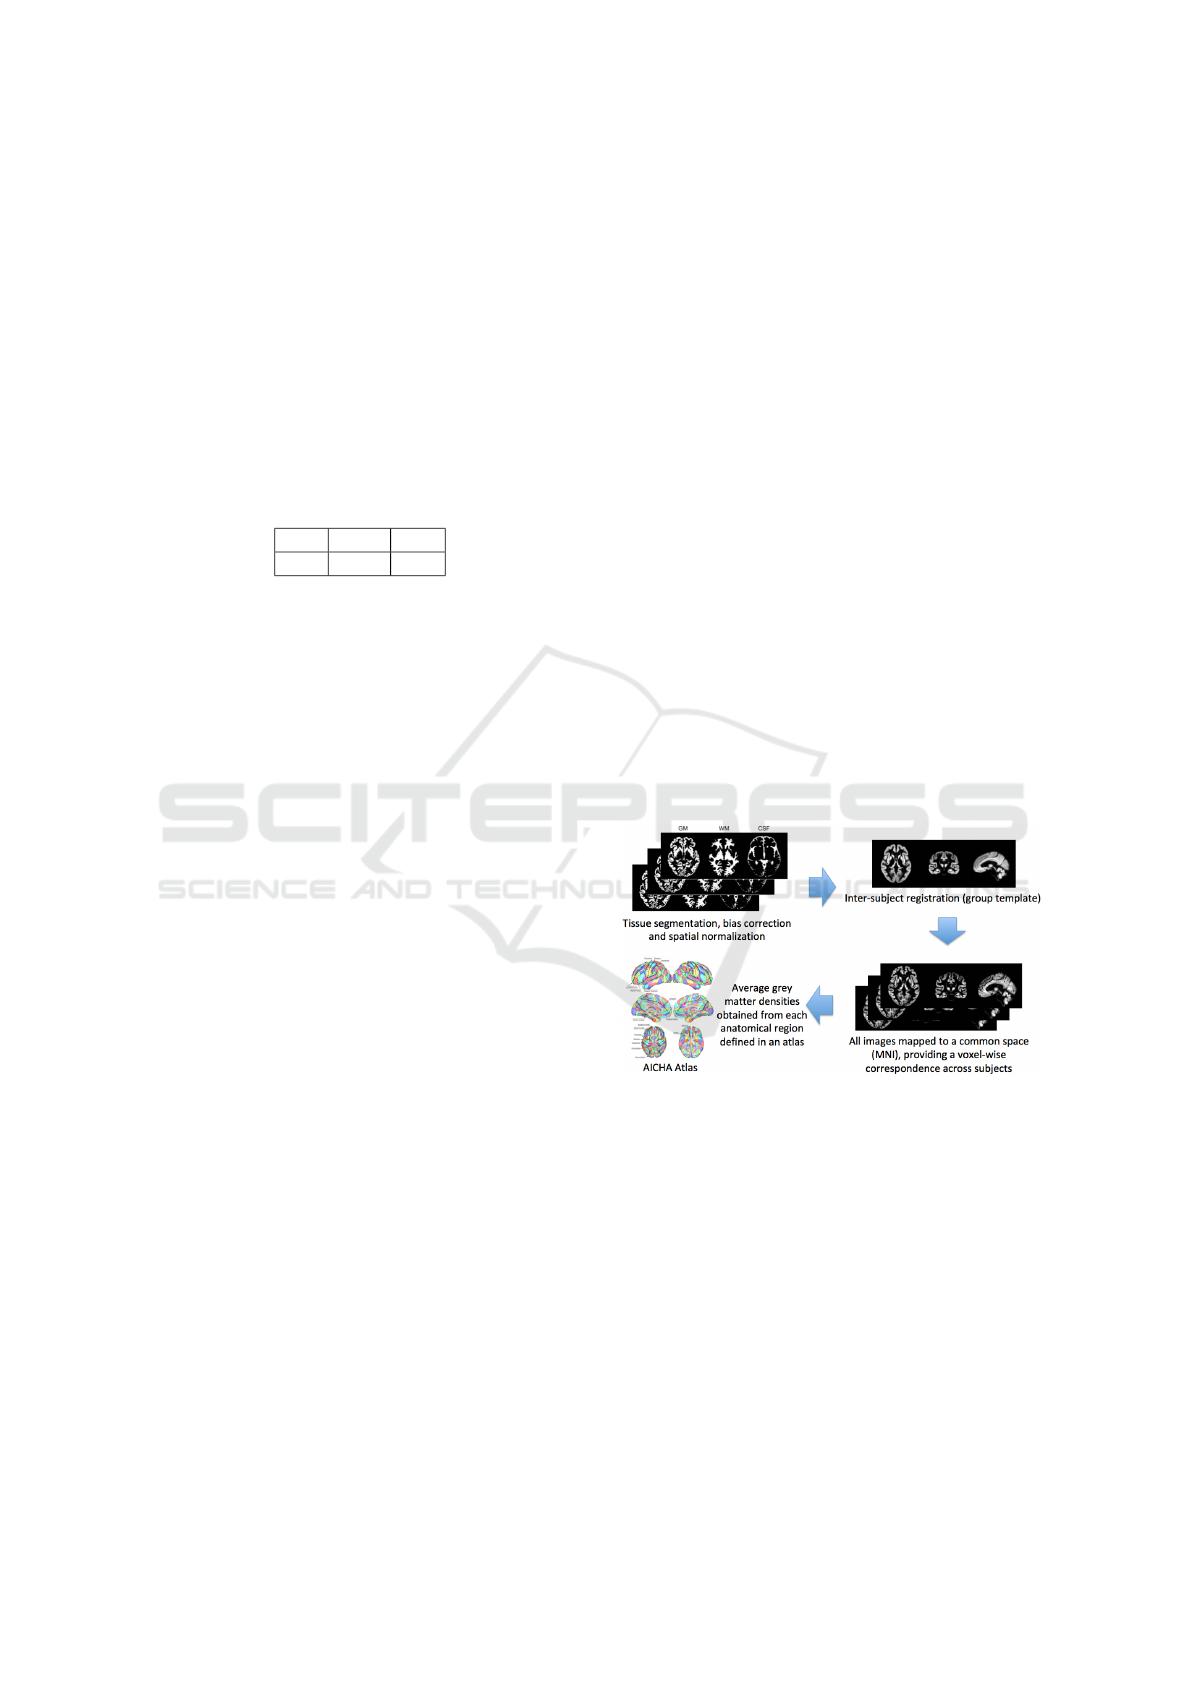
sification performance. A simplified scheme of the
image feature extraction process is reported in Fig.
2. For each of the 720 patients, these imaging fea-
tures have been extracted by the MRIs coming from
the visit closest in time to that of the corresponding
GE data sample.
Figure 2: Extraction of imaging features.
2.2 Extraction of Omics Features
Normalized gene expression profiling data from
blood samples of ADNI participants, produced by
Affymetrix Human Genome U219 Array (Affymetrix
(www.affymetrix.com), Santa Clara, CA), were
downloaded from the ADNI website. The dataset
contained 49386 probes. Multiple probes correspond-
ing to the same gene identifier were aggregated by
median value. Significance Analysis of Microarrays
(SAM) (Tusher et al., 2001), in the form of R pack-
age, was used for finding significant differentially ex-
pressed genes (DEGs) from the three different un-
BIOIMAGING 2022 - 9th International Conference on Bioimaging
72

paired two-class comparisons (AD vs. CN, AD vs.
MCI, MCI vs. CN). Both standard (t-statistic) and
Wilcoxon tests were used, random seed generated,
100 Permutations and Delta slider set. Genes were
considered differentially expressed if the q-value was
less than 5%. The best performance results have
been obtained with the features extracted using the
Wilcoxon test for the AD vs. CN (181 features) and
AD vs. MCI (211 features) classification tasks. Re-
garding the comparison MCI vs. CN, no significant
DEGs were found using SAM; thus, the genes to be
included in the integrated classification were obtained
by selecting the top 300 genes with the highest vari-
ance from the expression matrix of the two classes
samples.
3 EXPERIMENTS
3.1 Evaluation Procedure
For classification, we adopted an SVM with linear
kernel. The evaluation consists of 10 iterations of
5-fold cross-validation, using stratified partitions of
the data into train and test subsets. At each itera-
tion, training folds are z-scored, and their mean and
variance are used to z-score the test set accordingly.
The performance results have been computed as av-
erage over the iterations of the well-known metrics
summarized in Table 2. These are defined in terms
of the number of true positives (TP), true negatives
(TN), false positives (FP), and false negatives (FN).
Here, the first class in each task (e.g., AD in AD vs.
CN) is assumed as the positive class. All the metrics
assume values in [0,1], except MCC that ranges in
[-1,1]; higher values indicate better performance for
all the metrics.
3.2 Performance Results
Table 3 reports performance results obtained for each
binary classification problem by adopting only imag-
ing features (MRI), only omics features (GE), or both
(MRI+GE). Here, it can be observed that extremely
good performance is achieved for the AD vs. CN
task, with MRI+GE features leading to the best results
against MRI and GE taken separately. Indeed, even
though imaging features lead to better performance
than omics, their combination leads to increased per-
formance in all the metrics.
The remaining two binary classification tasks are
notoriously hard, and thus lower performance is
achieved. For the AD vs. MCI task, omics data
alone leads to slightly higher performance values than
imaging data alone, but their combination still leads to
increased performance. Instead, for the MCI vs. CN
task, omics data leads to such a poor performance that
its influence in the combined features leads to results
worse than using imaging features alone.
Finally, it can be observed that class unbalanc-
ing in the two binary tasks that include AD patients
(positive minority class, including a low number of
samples) leads to a much higher recognition rate for
the negative majority classes, experiencing specificity
much higher than sensitivity. On the other side, F-
measure, AUC, MCC, and BA confirm to be metrics
less dependent on class unbalancing and well support
the exposed performance analysis.
The main observations arising from the analysis
of the results are 1) in most cases, the imaging fea-
tures perform much better than the omics features; 2)
for classifying AD against CN or MCI patients, the
combination of omics and imaging features leads to
better results than the same features taken separately;
3) the MCI vs. CN task still needs to be investigated,
as none of the considered sets of features leads to ac-
ceptable performance results.
3.3 Comparison with the
State-of-the-Art
In Table 4, we report classification performance re-
sults on ADNI data published in recent literature, also
specifying the cardinality of the subsets of samples
considered (column ‘# Samples’) and the type of fea-
tures adopted (column ‘Feats.’). Even though all the
reported results have been obtained using different
subsets of ADNI data and varying evaluation pro-
tocols, the Table intends to provide a rough perfor-
mance comparison of the achieved results. Our best
results from Table 3 are also reported to make a more
immediate comparison.
(Cheng and Liu, 2017) constructed multi-level
CNNs to gradually learn and combine multi-modal
features for AD classification extracted by MRI and
PET images. First, two deep 3D-CNNs are con-
structed to transform the whole brain information into
compact high-level features for each modality. Then,
differently from conventional combination methods
that average the class probabilistic scores, a 2D CNN
is learned to combine the multi-modal features and
make the final classification.
In (Aderghal et al., 2017), a CNN is trained on
features extracted from the hippocampal region from
MRIs, using data augmentation strategies to obtain
the needed large volumes of data and data balanc-
ing strategies to handle unbalanced classes. Later on,
the same group (Aderghal et al., 2018) proposed a
Classifying Alzheimer’s Disease using MRIs and Transcriptomic Data
73

Table 2: Performance measures adopted in the experiments.
Acron. Name Formula Description
Acc Accuracy
TP + TN
TP + FN+ FP + TN
% of correctly classified samples
Spec Specificity
TN
TN + FP
% of negative samples correctly
identified
Sens
Sensitivity
(or Recall
or TPR)
TP
TP + FN
% of positive samples correctly
classified
Prec Precision
TP
TP + FP
% of positive samples correctly
classified, considering the set of all
the samples classified as positive
F
1
F-measure
2 · Prec · Sens
Prec + Sens
Weighted compromise between
Sens and Prec
Gm G-mean
p
Sens · Spec
Geometric mean of the accuracy of
both classes
AUC
Area Under
the ROC
Curve
Z
1
0
Sens(x)dx, x = 1−Spec
Uses the ROC curve to exhibit the
trade-off between the classifier’s TP
and FP rates
MCC
Matthews
Correlation
Coefficient
(Matthews,
1975)
TP · TN − FP · FN
p
(TP + FP)(TP + FN)(TN + FP)(TN + FN)
Correlation coefficient between ob-
served and predicted binary clas-
sifications. Useful for unbalanced
classes
BA
Balanced
Accuracy
Sens + Spec
2
Compromise between Spec and
Sens. Useful for unbalanced classes
Table 3: Average performance results for the three binary classification problems using only imaging features (MRI), only
omics features (GE), or both (MRI+GE). In boldface the best values for each metric and each classification problem.
Features Acc Sens Spec Prec F1 Gm AUC MCC BA
AD vs. CN
MRI 0.927 0.632 0.977 0.828 0.707 0.780 0.926 0.680 0.804
GE 0.860 0.479 0.924 0.538 0.492 0.655 0.847 0.422 0.701
MRI+GE 0.946 0.722 0.983 0.889 0.787 0.839 0.955 0.768 0.853
AD vs. MCI
MRI 0.871 0.244 0.932 0.258 0.245 0.444 0.722 0.178 0.588
GE 0.878 0.342 0.931 0.330 0.330 0.550 0.774 0.267 0.637
MRI+GE 0.915 0.394 0.966 0.546 0.448 0.606 0.869 0.415 0.680
MCI vs. CN
MRI 0.636 0.732 0.471 0.704 0.717 0.585 0.651 0.207 0.601
GE 0.524 0.601 0.394 0.629 0.614 0.484 0.499 -0.005 0.497
MRI+GE 0.562 0.632 0.443 0.661 0.645 0.526 0.555 0.073 0.537
method that combines the MRI and DTI (Diffusion
Tensor Imaging) modalities. Due to the scarce avail-
ability of DTIs, they adopted cross-modal transfer
learning from MRIs to DTIs and combined the classi-
fication results of multiple CNNs by a majority vote.
(Tong et al., 2017) presented a multi-modality
classification framework to exploit the complemen-
tarity in the multi-modal data. They first compute
pairwise similarity for each modality individually us-
ing features from regional MRI volumes, voxel-based
FDG-PET signal intensities, CSF biomarker mea-
sures, and APOE4 genetic information. Then, they
combine the similarities in a nonlinear graph fusion
process, which generates a unified graph for final clas-
sification.
In (B
¨
ackstr
¨
om et al., 2018), a 3D CNN is pro-
posed, named 3DConvNet, for AD vs. CN classi-
fication. It consists of five convolutional layers for
feature extraction from MRIs, followed by three fully
connected layers for classification.
BIOIMAGING 2022 - 9th International Conference on Bioimaging
74

Table 4: Performance comparisons of recent classification methods on the ADNI dataset. In boldface the best values for each
metric and each classification problem.
Ref. # Samples Feats. Acc Sens Spec Prec F
1
AUC BA
AD vs. CN
(Aderghal et al., 2017) 188, 228 MRI 0.828 0.796 0.859 - - - 0.828
(Cheng and Liu, 2017) 93, 100 MRI,
PET
0.896 0.871 0.920 - - 0.945 0.896
(Tong et al., 2017) 37, 35 APOE,
CSF,
MRI,
PET
0.918 0.889 0.947 - - 0.983 0.918
(Aderghal et al., 2018) 236, 285 MRI,
DTI
0.925 0.947 0.904 - - - 0.925
(B
¨
ackstr
¨
om et al., 2018) 199, 141 MRI 0.901 0.933 0.868 - - - 0.900
(Li and Liu, 2018) 199, 229 MRI 0.897 0.879 0.908 - - 0.924 0.894
(Senanayake et al., 2018) 161, 161 MRI,
Cog.
tests
0.760 - - - - - -
(Shi et al., 2018) 51, 52 MRI,
PET
0.971 0.959 0.985 - - - 0.972
(Gupta et al., 2019) 38, 38 APOE,
CSF,
MRI,
PET
0.984 1.000 0.965 0.979 0.984 - 0.983
(Bae et al., 2020) 195, 195 MRI 0.890 0.880 0.910 - - 0.940 0.895
(Lee and Lee, 2020) 63, 136 GE - - - - - 0.665 -
Our best results 42, 250 MRI,
GE
0.946 0.722 0.983 0.889 0.787 0.955 0.853
AD vs. MCI
(Aderghal et al., 2017) 188, 199 MRI 0.660 0.737 0.587 - - - 0.662
(Aderghal et al., 2018) 236, 503 MRI,
DTI
0.850 0.937 0.791 - - - 0.864
(Senanayake et al., 2018) 161, 193 MRI,
Cog.
tests
0.760 - - - - - -
Our best results 42, 428 MRI,
GE
0.915 0.394 0.966 0.546 0.448 0.869 0.680
MCI vs. CN
(Aderghal et al., 2017) 199, 228 MRI 0.625 0.600 0.640 - - - 0.620
(Tong et al., 2017) 75, 35 APOE,
CSF,
MRI,
PET
0.795 0.851 0.671 - - 0.812 0.761
(Aderghal et al., 2018) 503, 285 MRI,
DTI
0.800 0.928 0.730 - - - 0.829
(Li and Liu, 2018) 403, 229 MRI 0.738 0.866 0.515 - - 0.775 0.802
(Senanayake et al., 2018) 193, 161 MRI,
Cog.
tests
0.750 - - - - - -
(Shi et al., 2018) 99, 52 MRI,
PET
0.872 0.979 0.670 - - - 0.825
Our best results 428, 250 MRI 0.636 0.732 0.471 0.704 0.717 0.651 0.601
Classifying Alzheimer’s Disease using MRIs and Transcriptomic Data
75

(Li and Liu, 2018) proposed a classification
method based on multiple cluster dense convolutional
neural networks (DenseNets) to learn features from
MRIs. Each whole-brain image is first partitioned
into different local regions, and a fixed number of
3D patches is extracted from each region. Then, the
patches from each region are grouped into different
clusters with k-means clustering. A DenseNet is con-
structed to learn the patch features for each cluster
and the features learned from the discriminative clus-
ters of each region are ensembled for classification.
Finally, the classification results from different local
regions are combined to enhance the final image clas-
sification.
(Senanayake et al., 2018) used 3D MR volumes
and neuropsychological measure-based (NM) feature
vectors. For combining these two data sources, hav-
ing very different dimensions (35 NM features against
more than ten million features from 3D MR volumes),
they proposed a deep learning-based pipeline that re-
duces the dimension of the MRI features to a dimen-
sion comparable with that of NM, and used the feature
vector merging the two sets of features.
(Shi et al., 2018) proposed a multi-modal algo-
rithm based on a stacked deep polynomial network
(MM-SDPN). Two SDPNs are first used to learn
high-level features from MRIs and PETs separately,
which are then fed to another SDPN to fuse multi-
modal neuroimaging information to contain the in-
trinsic properties of both modalities and their corre-
lation.
(Gupta et al., 2019) proposed a machine learning-
based framework, based on SVM and feature selec-
tion, to discriminate the various stages of ADNI pa-
tients using a combination of FDG-PET, structural
MRI, CSF protein levels, and APOE genotype. Here,
the MCI group of patients is subdivided into MCIc
(MCI converted, i.e., MCI patients that converted to
AD within 24 months) and MCIs (MCI stable, i.e.,
that did not convert to AD within 24 months); there-
fore, their interesting conclusions on binary prob-
lems involving MCI patients cannot be compared with
ours.
(Bae et al., 2020) developed a CNN-based algo-
rithm to classify AD patients and CN controls using
coronal slices of T1-weighted MRI images that cover
the medial temporal lobe. They tested it on two inde-
pendent populations, including ADNI patients.
(Lee and Lee, 2020) classified AD vs. CN using
blood gene expression data. They tested five feature
selection methods and five classifiers. The best AUC
in the internal evaluation on the ADNI dataset was ob-
tained using DEGs extracted using SAM without fea-
ture selection and using a deep neural network classi-
fier.
Table 4 shows that our results using MRI and GE
features are competitive with those achieved by state-
of-the-art methods for the AD vs. CN and AD vs.
MCI classification tasks. It is interesting to observe
that the highest performance results are reported for
methods (e.g., (Tong et al., 2017; Gupta et al., 2019))
that take into account not only MRI and PET features
but also CSF. However, the extraction of such data
requires a quite invasive intervention, preventing us
from adopting them in our multi-modal setting.
Moreover, it should be explicitly observed that the
neuropsychological measures adopted as features by
some methods (e.g., (Senanayake et al., 2018)) are
generally considered by medical doctors to diagnose
the disease state of each patient. Thus, their use as
features for classification appears to strongly and pos-
itively bias the results. This is shown in Table 5,
where we report extremely high performance results
achieved with our classification procedure using as
features only three cognitive tests (CDRSB, ADAS11,
and MMSE) on the selected subset of samples. Simi-
lar results are achieved on the whole set of data from
ADNIMERGE, as shown in Table 6.
4 CONCLUSIONS
In this paper, we propose a method for classifying the
various stages of Alzheimer’s disease, which relies on
data acquired by non-invasive techniques and that are
compatible with the limitations imposed by pandemic
situations. The multi-modal data consist of omics and
imaging features extracted by gene expression values
from blood samples and MRIs, respectively. We show
how a suitable integration of omics and imaging data,
using well-known machine learning techniques, can
lead to better results than any of them taken separately
for the classification of AD against CN or MCI pa-
tients. Moreover, the achieved performance appears
competitive with the state-of-the-art. However, when
discriminating MCI and CN patients, none of the con-
sidered sets of features leads to acceptable perfor-
mance results. This classification task, well known
to be more challenging than the other two, needs to
be further investigated.
ACKNOWLEDGEMENTS
This work has been partially funded by the BiBi-
Net project (H35F21000430002) within POR-Lazio
FESR 2014-2020. It was carried out also within the
BIOIMAGING 2022 - 9th International Conference on Bioimaging
76

Table 5: Average performance results for the three binary classification problems using as features only three cognitive tests
(CDRSB, ADAS11, and MMSE) on the considered ADNI subset (42 AD, 427 MCI, 250 CN).
Task Acc Sens Spec Prec F1 Gm AUC MCC BA
AD vs. CN 0.990 0.976 0.992 0.958 0.965 0.984 0.996 0.961 0.984
AD vs. MCI 0.835 0.976 0.821 0.355 0.519 0.895 0.903 0.529 0.899
MCI vs. CN 0.867 0.926 0.768 0.873 0.898 0.841 0.931 0.716 0.847
Table 6: Average performance results for the three binary classification problems using as features only three cognitive tests
(CDRSB, ADAS11, and MMSE) on the whole ADNIMERGE dataset (397 AD, 1055 MCI, 519 CN).
Task Acc Sens Spec Prec F1 Gm AUC MCC BA
AD vs. CN 0.994 0.986 1.000 1.000 0.993 0.993 1.000 0.988 0.993
AD vs. MCI 0.930 0.813 0.975 0.924 0.864 0.890 0.978 0.821 0.894
MCI vs. CN 0.922 0.915 0.937 0.968 0.940 0.926 0.979 0.832 0.926
activities of the authors as members of the ICAR-
CNR INdAM Research Unit and partially supported
by the INdAM research project “Computational In-
telligence methods for Digital Health”. The work
of Mario R. Guarracino was conducted within the
framework of the Basic Research Program at the Na-
tional Research University Higher School of Eco-
nomics (HSE). Mario Manzo thanks Prof. Alfredo
Petrosino for the guidance and supervision during the
years of working together.
Data collection and sharing for this project was
funded by the Alzheimer’s Disease Neuroimaging
Initiative (ADNI) (National Institutes of Health Grant
U01 AG024904) and DOD ADNI (Department of De-
fense award number W81XWH-12-2-0012). ADNI
is funded by the National Institute on Aging, the
National Institute of Biomedical Imaging and Bio-
engineering, and through generous contributions from
the following: AbbVie, Alzheimer’s Association;
Alzheimer’s Drug Discovery Foundation; Araclon
Biotech; BioClinica, Inc.; Biogen; Bristol-Myers
Squibb Company; CereSpir, Inc.; Cogstate; Eisai
Inc.; Elan Pharmaceuticals, Inc.; Eli Lilly and Com-
pany; EuroImmun; F. Hoffmann-La Roche Ltd and
its affiliated company Genentech, Inc.; Fujirebio;
GE Healthcare; IXICO Ltd.; Janssen Alzheimer Im-
munotherapy Research & Development, LLC.; John-
son & Johnson Pharmaceutical Research & Devel-
opment LLC.; Lumosity; Lundbeck; Merck & Co.,
Inc.; Meso Scale Diagnostics, LLC.; NeuroRx Re-
search; Neurotrack Technologies; Novartis Pharma-
ceuticals Corporation; Pfizer Inc.; Piramal Imag-
ing; Servier; Takeda Pharmaceutical Company; and
Transition Therapeutics. The Canadian Institutes of
Health Research is providing funds to support ADNI
clinical sites in Canada. Private sector contributions
are facilitated by the Foundation for the National In-
stitutes of Health (www.fnih.org). The grantee orga-
nization is the Northern California Institute for Re-
search and Education, and the study is coordinated by
the Alzheimer’s Therapeutic Research Institute at the
University of Southern California. ADNI data are dis-
seminated by the Laboratory for Neuro Imaging at the
University of Southern California.
REFERENCES
Aderghal, K., Boissenin, M., Benois-Pineau, J., Catheline,
G., and Afdel, K. (2017). Classification of sMRI
for AD diagnosis with convolutional neuronal net-
works: A pilot 2-D+ε study on ADNI. In Amsaleg,
L. et al., editors, MultiMedia Modeling - 23rd Inter-
national Conference, MMM 2017, Reykjavik, Iceland,
January 4-6, 2017, Proceedings, Part I, volume 10132
of Lecture Notes in Computer Science, pages 690–
701. Springer.
Aderghal, K., Khvostikov, A., Krylov, A., Benois-Pineau,
J., Afdel, K., and Catheline, G. (2018). Classification
of Alzheimer disease on imaging modalities with deep
CNNs using cross-modal transfer learning. In 2018
IEEE 31st International Symposium on Computer-
Based Medical Systems (CBMS), pages 345–350.
Antonelli, L., Guarracino, M. R., Maddalena, L., and San-
giovanni, M. (2019). Integrating imaging and omics
data: A review. Biomedical Signal Processing and
Control, 52:264–280.
Ashburner, J. (2007). A fast diffeomorphic image registra-
tion algorithm. NeuroImage, 38(1):95–113.
Ashburner, J. and Friston, K. J. (2005). Unified segmenta-
tion. NeuroImage, 26(3):839–851.
Bae, J., Lee, S., Jung, W., Park, S., Kim, W., Oh, H., Han,
J., Kim, G., Kim, J., Kim, J., and Kim, K. (2020).
Identification of Alzheimer’s disease using a convo-
lutional neural network model based on T1-weighted
magnetic resonance imaging. Scientific reports, 10(1).
Publisher Copyright: © 2020, The Author(s).
B
¨
ackstr
¨
om, K., Nazari, M., Gu, I. Y.-H., and Jakola, A. S.
(2018). An efficient 3D deep convolutional net-
work for Alzheimer’s disease diagnosis using MR im-
ages. In 2018 IEEE 15th International Symposium on
Biomedical Imaging (ISBI 2018), pages 149–153.
Birkenbihl, C., Salimi, Y., Domingo-Fernandez, D., on be-
Classifying Alzheimer’s Disease using MRIs and Transcriptomic Data
77

half of the AddNeuroMed consortium, S. L., Fr
¨
ohlich,
H., Hofmann-Apitius, M., the Japanese Alzheimer’s
Disease Neuroimaging Initiative, and the Alzheimer’s
Disease Neuroimaging Initiative (2020). Evaluating
the Alzheimer’s disease data landscape. Alzheimer’s
& Dementia: Translational Research & Clinical In-
terventions, 6(1):e12102.
Birkenbihl, C., Westwood, S., Shi, L., Nevado-Holgado,
A., Westman, E., Lovestone, S., Consortium, A., and
Hofmann-Apitius, M. (2021). ANMerge: A compre-
hensive and accessible Alzheimer’s disease patient-
level dataset. J Alzheimers Dis., 79:423–431.
Cheng, D. and Liu, M. (2017). CNNs based multi-modality
classification for AD diagnosis. In 2017 10th In-
ternational Congress on Image and Signal Process-
ing, BioMedical Engineering and Informatics (CISP-
BMEI), pages 1–5.
Gorgolewski, K., Auer, T., Calhoun, V., Craddock, R.,
Das, S., Duff, E., Flandin, G., Ghosh, S., Glatard, T.,
Halchenko, Y., Handwerker, D., Hanke, M., Keator,
D., Li, X., Michael, Z., Maumet, C., Nichols, B.,
Nichols, T., Pellman, J., Poline, J., Rokem, A., Schae-
fer, G., Sochat, V., Triplett, W., Turner, J., Varoquaux,
G., and Poldrack, R. (2016). The brain imaging data
structure, a format for organizing and describing out-
puts of neuroimaging experiments. Scientific data, 3.
Copyright: Copyright 2016 Elsevier B.V., All rights
reserved.
Gupta, Y., Lama, R. K., Kwon, G.-R., et al. (2019). Predic-
tion and classification of Alzheimer’s disease based
on combined features from apolipoprotein-e geno-
type, cerebrospinal fluid, MR, and FDG-PET imag-
ing biomarkers. Frontiers in Computational Neuro-
science, 13:72.
Joliot, M., Jobard, G., Naveau, M., Delcroix, N., Petit, L.,
Zago, L., Crivello, F., Mellet, E., Mazoyer, B., and
Tzourio-Mazoyer, N. (2015). AICHA: An atlas of in-
trinsic connectivity of homotopic areas. Journal of
Neuroscience Methods, 254:46–59.
Lawrence, E., Vegvari, C., Ower, A., Hadjichrysanthou, C.,
De Wolf, F., and RM, A. (2017). A systematic review
of longitudinal studies which measure Alzheimer’s
disease biomarkers. J Alzheimers Dis., 59(4):1359–
1379.
Lee, T. and Lee, H. (2020). Prediction of Alzheimer’s
disease using blood gene expression data. Sci Rep,
10(1):3485.
Li, F. and Liu, M. (2018). Alzheimer’s disease diagno-
sis based on multiple cluster dense convolutional net-
works. Computerized Medical Imaging and Graphics,
70:101–110.
Li, X., Wang, H., Long, J., et al. (2018). Systematic analysis
and biomarker study for Alzheimer’s disease. Sci Rep,
8:17394.
Lovestone, S., Francis, P., Kloszewska, I., Mecocci, P., Sim-
mons, A., Soininen, H., Spenger, C., Tsolaki, M., Vel-
las, B., Wahlund, L., Ward, M., and Consortium, A.
(2009). AddNeuroMed–the European collaboration
for the discovery of novel biomarkers for Alzheimer’s
disease. Ann N Y Acad Sci, pages 36–46.
Maddalena, L., Granata, I., Manipur, I., Manzo, M., and
Guarracino, M. (2020). Glioma grade classification
via omics imaging. In Proceedings of the 13th Inter-
national Joint Conference on Biomedical Engineering
Systems and Technologies - Volume 2: BIOIMAGING,
pages 82–92. INSTICC, SciTePress.
Maddalena, L., Granata, I., Manipur, I., Manzo, M., and
Guarracino, M. R. (2021). A framework based on
metabolic networks and biomedical images data to
discriminate glioma grades. In Ye, X., Soares, F.,
De Maria, E., G
´
omez Vilda, P., Cabitza, F., Fred,
A., and Gamboa, H., editors, Biomedical Engineer-
ing Systems and Technologies, pages 165–189, Cham.
Springer International Publishing.
Mart
´
ı-Juan, G., Sanroma-Guell, G., and Piella, G. (2020).
A survey on machine and statistical learning for longi-
tudinal analysis of neuroimaging data in Alzheimer’s
disease. Comput. Methods Programs Biomed.,
189:105348.
Matthews, B. (1975). Comparison of the predicted and
observed secondary structure of T4 phage lysozyme.
Biochimica et Biophysica Acta (BBA) - Protein Struc-
ture, 405(2):442–451.
Mueller, S., Weiner, M., Thal, L., Petersen, R., Jack, C.,
Jagust, W., Trojanowski, J., Toga, A., and Beck-
ett, L. (2005). Ways toward an early diagnosis in
Alzheimer’s disease: the Alzheimer’s Disease Neu-
roimaging initiative (ADNI). J Alzheimers Dement.,
1(1):55–66.
Nho, K., ADNI, et al. (2016). Integration of bioinformatics
and imaging informatics for identifying rare PSEN1
variants in Alzheimer’s disease. BMC Medical Ge-
nomics, 9(Suppl 1).
Peng, J., An, L., Zhu, X., Jin, Y., and Shen, D. (2016).
Structured sparse kernel learning for imaging genet-
ics based Alzheimer’s disease diagnosis. In Inter-
national Conference on Medical Image Computing
and Computer-Assisted Intervention, pages 70–78.
Springer.
Routier, A., Burgos, N., D
´
ıaz, M., Bacci, M., Bottani, S., El-
Rifai, O., Fontanella, S., Gori, P., Guillon, J., Guyot,
A., Hassanaly, R., Jacquemont, T., Lu, P., Marcoux,
A., Moreau, T., Samper-Gonz
´
alez, J., Teichmann, M.,
Thibeau-Sutre, E., Vaillant, G., Wen, J., Wild, A.,
Habert, M.-O., Durrleman, S., and Colliot, O. (2021).
Clinica: An open-source software platform for re-
producible clinical neuroscience studies. Frontiers in
Neuroinformatics, 15:39.
Samper-Gonz
´
alez, J., Burgos, N., Bottani, S., Fontanella,
S., Lu, P., Marcoux, A., Routier, A., Guillon, J., Bacci,
M., Wen, J., Bertrand, A., Bertin, H., Habert, M. O.,
Durrleman, S., Evgeniou, T., and Colliot, O. (2018).
Reproducible evaluation of classification methods in
Alzheimer’s disease: Framework and application to
MRI and PET data. NeuroImage, 183:504–521.
Senanayake, U., Sowmya, A., and Dawes, L. (2018). Deep
fusion pipeline for mild cognitive impairment diagno-
sis. In 2018 IEEE 15th International Symposium on
Biomedical Imaging (ISBI 2018), pages 1394–1997.
Shi, J., Zheng, X., Li, Y., Zhang, Q., and Ying, S. (2018).
Multimodal neuroimaging feature learning with mul-
BIOIMAGING 2022 - 9th International Conference on Bioimaging
78

timodal stacked deep polynomial networks for di-
agnosis of Alzheimer’s disease. IEEE Journal of
Biomedical and Health Informatics, 22(1):173–183.
Tong, T., Gray, K., Gao, Q., Chen, L., and Rueckert, D.
(2017). Multi-modal classification of Alzheimer’s dis-
ease using nonlinear graph fusion. Pattern Recogni-
tion, 63:171–181.
Tusher, V. G., Tibshirani, R., and Chu, G. (2001). Signif-
icance analysis of microarrays applied to the ioniz-
ing radiation response. Proceedings of the National
Academy of Sciences, 98(9):5116–5121.
Tzourio-Mazoyer, N., Landeau, B., Papathanassiou, D.,
Crivello, F., Etard, O., Delcroix, N., Mazoyer, B.,
and Joliot, M. (2002). Automated anatomical labeling
of activations in SPM using a macroscopic anatomi-
cal parcellation of the MNI MRI single-subject brain.
NeuroImage, 15(1):273–289.
Vapnik, V. (1995). The Nature of Statistical Learning The-
ory. Springer-Verlag.
Voyle, N., Keohane, A., Newhouse, S., Lunnon, K., John-
ston, C., Soininen, H., Kloszewska, I., Mecocci, P.,
Tsolaki, M., Vellas, B., Lovestone, S., Hodges, A.,
Kiddle, S., and Dobson, R. (2016). A pathway based
classification method for analyzing gene expression
for Alzheimer’s disease diagnosis. J Alzheimers Dis,
49(3):659–69.
Wen, J., Thibeau-Sutre, E., Diaz-Melo, M., Samper-
Gonz
´
alez, J., Routier, A., Bottani, S., Dormont, D.,
Durrleman, S., Burgos, N., and Colliot, O. (2020).
Convolutional neural networks for classification of
Alzheimer’s disease: Overview and reproducible eval-
uation. Medical Image Anal., 63:101694.
WHO (2019). Risk reduction of cognitive decline and de-
mentia. World Health Organization Guidelines.
Classifying Alzheimer’s Disease using MRIs and Transcriptomic Data
79
