
Impact of Physical Layer Impairments on C+L-band Metro Networks
Filipa F. Gomes
1
, Lu
´
ıs G. Cancela
1,2
and Jo
˜
ao L. Rebola
1,2
1
Optical Communications and Photonics Group, Instituto de Telecomunicac¸
˜
oes, Lisbon, Portugal
2
Department of Information Science and Technology, Instituto Universit
´
ario de Lisboa (ISCTE-IUL), Portugal
Keywords:
ASE Noise, In-band Crosstalk, Metro Networks, Multi-band Transmission, Nonlinear Interference Noise.
Abstract:
To ensure future data traffic capacities, multi-band transmission in optical networks is being proposed, by
adding wavelength division multiplexing channels in the L-band to the existing C-band channels. In this
work, we study the filterless drop and waste amplified and unamplified solutions used in metro networks with
L-band tributary nodes. The cost and power consumption of these nodes is evaluated, as well as the impact of
several physical layer impairments on the network performance. In amplified solutions, we show that L-band
networks with 9 tributary nodes are feasible, being the optical signal-to-noise ratio achieved when considering
amplifiers noise and fiber non-linear interference above 14 dB. In unamplified solutions, to fullfil the power
budget, frequency reuse should be used between spans. We show that the in-band crosstalk caused by this
frequency reuse leads to 1.5 dB power budget degradation, for a crosstalk level of -20 dB.
1 INTRODUCTION
To offer the best Internet experience, nowadays, it is
necessary to resort to cloud services which, in the
future, will probably saturate the transport capacity
of existing metro networks. Several solutions based
on multi-band transmission are being investigated to
overcome this possible capacity crunch (Ferrari et al.,
2020), but the introduction of the L-band (by adding
wavelength division multiplexing (WDM) channels)
opens the opportunity for cheaper solutions than plac-
ing several fibres in parallel.
Filterless solutions, both amplified and unampli-
fied, are being proposed to reduce even more the cost
of upgrading the optical networks to the L-band (Em-
merich et al., 2020b), (Paolucci et al., 2020). In
particular, the filterless solution is usually applied to
networks with horseshoe topology (Emmerich et al.,
2020b). In (Paolucci et al., 2020), the L-band filter-
less unamplified solution is proposed, but due to fre-
quency reuse, in-band crosstalk becomes a relevant
impairment that degrades the network performance.
As this solution is only suitable for short-reach spans,
noise from the amplifiers and fiber non-linearities can
be neglected. Due to the impossibility of reusing fre-
quencies in the amplified solution, amplified sponta-
neous emission (ASE) noise and fiber non-linear in-
terference (NLI) become the main impairments that
degrade the network performance.
In all these works, regarding filterless L-band
transmission, we have seen that they resort on ex-
perimental results and simulations to study the up-
grade of the metro area networks. However, an an-
alytical study of the filterless solutions has not been
performed in these works.
In this work, we analyse the node components and
architectures for the C+L-band, and their cost and
power consumption are estimated. A simple analyt-
ical formalism of the various physical layer impair-
ments (PLIs) that affect the performance of the fil-
terless solution, either amplified or unamplified, in
the horseshoe topology is provided. The impact of
ASE noise and NLI on the optical signal-to-noise ra-
tio (OSNR) of the horsehoe topology is studied for
filterless L-band amplified solutions and the influence
of in-band crosstalk on the electrical signal-to-noise
ratio (SNR) is assessed for unamplified solutions.
This work is organized as follows. In section 2,
we review the L-band node architectures amplified
and unamplified solutions for the C+L transmission.
In section 3, we perform an analysis regarding the
L-band hardware cost and power consumption. In
section 4, the several PLIs that impair the L-band
nodes network performance are studied for the ampli-
fied and unamplified solutions. In section 5, the final
conclusions are drawn.
134
Gomes, F., Cancela, L. and Rebola, J.
Impact of Physical Layer Impairments on C+L-band Metro Networks.
DOI: 10.5220/0010909900003121
In Proceedings of the 10th International Conference on Photonics, Optics and Laser Technology (PHOTOPTICS 2022), pages 134-143
ISBN: 978-989-758-554-8; ISSN: 2184-4364
Copyright
c
2022 by SCITEPRESS – Science and Technology Publications, Lda. All rights reserved
2 NODE ARCHITECTURE FOR
C+L-BAND
Several solutions regarding metro networks with C+L
band transmission rely on the horseshoe network
topology to manage the access/metro network data
traffic (Paolucci et al., 2020). The horseshoe topol-
ogy is usually composed of two hub nodes (which are
nodes that communicate in a meshed topology with
other hub nodes) and several tributary nodes (which
are nodes that connect with the hub nodes or other
tributary nodes, and perform the interface with ac-
cess metro networks) (Paolucci et al., 2020), (Em-
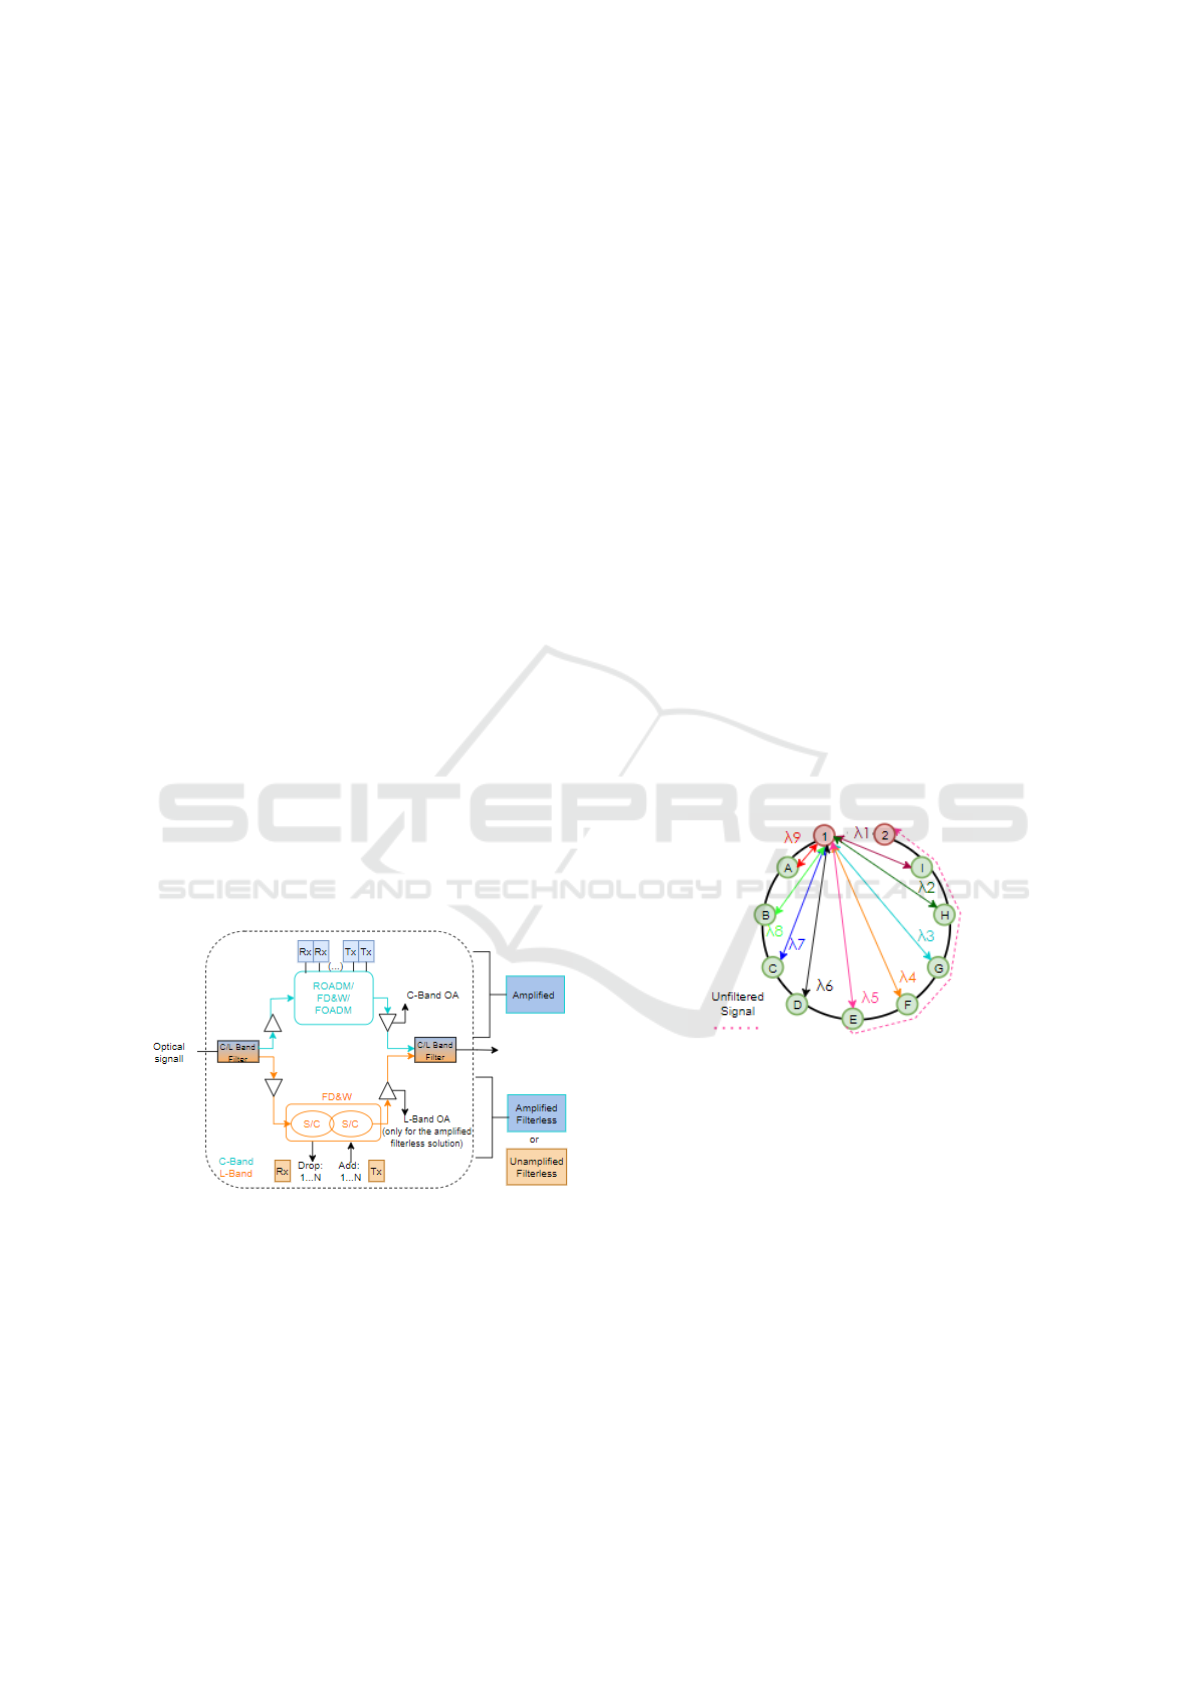
merich et al., 2020a). As shown in Fig. 1, a C+L
tributary node architecture has two independent struc-
tures, one for C-band signals and other for L-band sig-
nals (Emmerich et al., 2020a). These two bands are
separated/aggregated by a C/L band filter at the in-
put/output of the node, which typically provides high
bands isolation and low insertion losses, introducing a
300 to 500 GHz gap between the C and L bands. The
separated L-band solution causes a minimum disrup-
tion with pre-existing metro networks working only
in the C-band (Emmerich et al., 2020a).
The node configuration used for the C-band,
which is shown at the top of Fig. 1 (blue color),
can be implemented with various nodes architectures
such as filterless drop and waste (FD&W), fixed op-
tical add/drop multiplexers (FOADM) and reconfig-
urable optical add/drop multiplexer (ROADM) solu-
tions (Emmerich et al., 2020a).
Figure 1: Tributary C+L-band node configuration.
The node configuration for the L-band is shown at
the bottom of Fig. 1 (orange color). It is based only on
the FD&W solution, whose architecture relies only on
splitter/couplers (S/Cs), and can be either amplified or
unamplified (Emmerich et al., 2020a). This solution
has no filtering in the tributary nodes, which means
that when a wavelength is added to the network, it re-
mains in the network until the hub node removes it
(amplified solution) or until it is reused once again in
the network (unamplified solution) (Emmerich et al.,
2020b), (Paolucci et al., 2020). The hub node L-band
structure typically uses ROADMs as in the C-band
structure counterpart (Hernandez et al., 2020).
2.1 L-band Amplified Solution
In the amplified solution, there are optical amplifiers
(OAs) inside the node before and after the FD&W
block, see Fig. 1 (Paolucci et al., 2020).
Fig. 2 presents a possible wavelength planning
for the amplified solution in the L-band in a horse-
shoe topology, where each tributary node has a spe-
cific wavelength to communicate with the hub node.
This solution does not allow the reuse of frequencies
inside the network since each wavelength can only
be extracted by the hub node (represented in pink in
Fig. 2). The tributary nodes (represented in green in
Fig. 2) do not have such capacity since they are based
on S/Cs. In Fig. 2, the pink wavelength λ
5
is as-
signed to the connection between the hub node 1 and
the tributary node E, but node E can not remove this
wavelength, which is only removed from the network
at the hub node 2. This path is represented by the
dashed pink line, and represents a wasted wavelength
for nodes F to I (Emmerich et al., 2020a).
Figure 2: Amplified filterless solution with no frequency
reuse for the horseshoe topology. Only the L-band wave-
length assignment for the downlink transmission is de-
picted.
2.2 L-band Unamplified Solution
The main goal of the L-band unamplified solution is
to reduce the nodes cost by not using OAs. This so-
lution limits the L-band transmission distance to ad-
jacent nodes or near adjacent nodes (Emmerich et al.,
2020a).
Fig. 3 shows an example of a wavelengh assign-
ment for the unamplified solution, to illustrate a wave-
length reuse possibility. As shown in Fig. 3, the wave-
length λ
2
is reused in the next-hop and λ
1
is reused
after one hop. As the WDM channel is not amplified,
Impact of Physical Layer Impairments on C+L-band Metro Networks
135
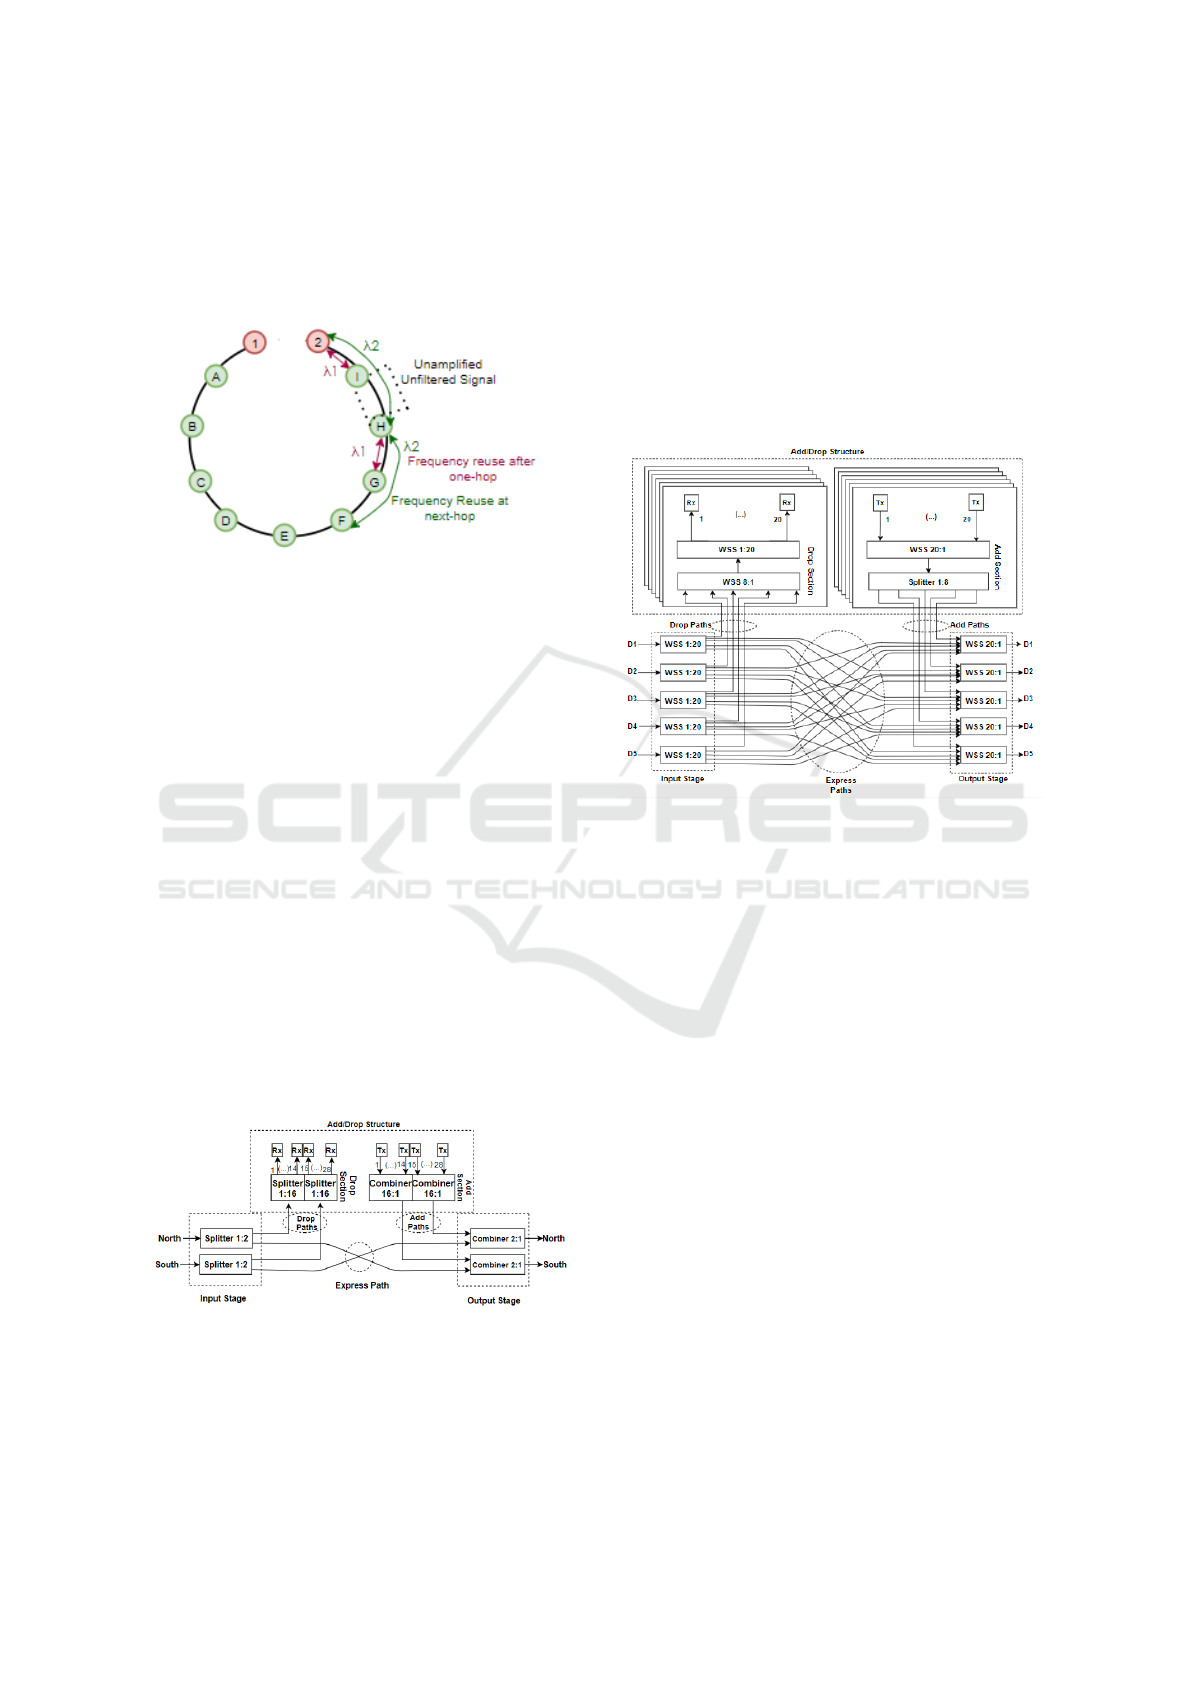
it arrives to the next node with very low power, mean-
ing that a new channel with the same wavelength can
be used. However, the (even weak) power leakage on
node H can impair the new channel leading to in-band
crosstalk. (Emmerich et al., 2020b).
Figure 3: Unamplified filterless solution with frequency
reuse for the horseshoe topology. Only the L-band wave-
length assignment for the downlink transmission is de-
picted.
2.3 L-band Nodes Architectures
In the L-band, the tributary nodes use a FD&W ar-
chitecture, while the hub nodes have usually a color-
less and directionless (CD) ROADM route and select
(R&S) architecture, as shown, respectively, in Figs. 4
and 5.
In Fig. 4, the tributary node architecture consid-
ers the transmission of 70 WDM channels with a 100
GHz channel spacing in each fiber direction. For two
directions and a add/drop (A/D) ratio of 20%, the
number of required coherent detection transponders
in each L-band node is 28. Thus, beside considering
two C/L filters to separate/aggregate the two bands
and two amplifiers per node (in the case of the am-
plified solution), each tributary FD&W node has four
S/Cs 1:2, four S/C 1:16, each with 4 unused channels
and 28 transponders, as shown in Fig. 4.
Figure 4: 2-Degree FD&W tributary node.
In Fig. 5, we consider that each 5-degree hub node
is connected to 3 different hub nodes and two tribu-
tary nodes. So, for an A/D ratio of 20%, a total of
112 wavelengths must be added/dropped in each hub
node. As wavelength selective switches (WSSs) with
maximum dimension of 1:20 are considered (Hernan-
dez et al., 2020), it is necessary to use 6 cards in
the A/D structure to achieve this number of wave-
lengths. To connect each A/D card to the ROADM
input/output directions, express WSSs 1:20 are con-
sidered. So, in Fig. 5, the hub node has five WSSs
1:20 at the input and output stages, twelve WSSs 1:20
in the A/D structure, six WSSs 1:8 at the drop section,
six S/Cs 1:8 at the add section and 112 transponders.
Figure 5: 5-Degree CD ROADM R&S hub node.
3 HARDWARE COST AND
POWER CONSUMPTION
In this section, an analysis regarding the cost, power
consumption and total offered capacity of an horse-
shoe topology with 2 hub nodes and 9 tributary nodes
(as shown in Fig. 2) is performed and presented in
Tab. 1. The analysis is performed considering that
the cost and power consumption of the hardware com-
ponents in the L-band is twice the C-band compo-
nents cost, which is taken from (Hernandez et al.,
2020). The cost is normalized to the cost of a 10 Gbps
transponder, whose price is around 330 e (Hernandez
et al., 2020).
For comparison purposes, the cost and power con-
sumption of the same horseshoe network have been
calculated for the C-band FD&W solution consider-
ing the components presented in (Hernandez et al.,
2020), and the same A/D ratio of 20%.
The total capacity per fiber reaching the tributary
and hub nodes in the L-band is, respectively, 7 Tbps
and 28 Tbps, determined from the number of WDM
channels and the transponder capacity, which is, re-
spectively, 70 channels and 100 Gbps for the tributary
PHOTOPTICS 2022 - 10th International Conference on Photonics, Optics and Laser Technology
136
node and, respectively, 140 channels and 200 Gbps
between hub nodes. The total capacity per node pre-
sented corresponds to the capacity per A/D structure.
So, the capacity per tributary node is 2.8 Tbps and the
average total capacity per hub node is calculated con-
sidering that 2/5 of the transponders are working at
100 Gbps (to communicate with tributary nodes) and
the other 3/5 are at 200 Gbps (to communicate with
other hub nodes). Hence, the average total capacity
per hub node is 17.9 Tbps.
Table 1: Total cost, power consumption and capacity of the
hub and tributary nodes and per horseshoe network.
Cost/Consumption Node architecture
Hub
Normalized cost/node 1952.44
Power consumption/node [kW] 18.96
Total capacity/node [Tbps] 17.9
Trib. Amplified
Normalized cost/node 282.2
Power consumption/node [kW] 3.43
Total capacity/node [Tbps] 2.8
Total cost/horseshoe [k] 6.45
Total pow.cons./horseshoe [kW] 68.75
Trib. Unamplified
Normalized cost/node 280.95
Power consumption/node [kW] 3.36
Total capacity/node [Tbps] 2.8
Total cost/horseshoe [k] 6.43
Total pow.cons./horseshoe [kW] 68.15
The tributary node unamplified solution is cheaper
(less 1.25 of normalized cost) and spends less power
per node (around 20 W) than the tributary node ampli-
fied solution. The difference between these solutions
is only due to the existence or not of OAs. The com-
ponents that most contribute, around 99%, to the final
cost of the node are the transponders. The normalized
cost per tributary node is around 3.5 times higher than
in the C-band. This occurs because, in the L-band,
the number of transponders is almost the double. The
power consumption of the tributary node is 3.4 kW,
which is around 1.7 times higher than the consump-
tion of the FD&W for the C-band. Other components,
such as the S/Cs have a small contribution to the final
cost.
The hub node has a normalized cost around 3.5
times higher than the C-band node cost. The power
consumption is also around 3.2 times higher than the
corresponding C-band node power consumption.
So, the estimated total network cost using FD&W
with amplified and unamplified soutions is 2134 ke
and 2128.3 ke, respectively, when the components
are twice expensive, which means that the unampli-
fied solution is 0.3% cheaper than the amplified one.
4 PHYSICAL LAYER
IMPAIRMENTS IN THE
L-BAND
In this section, the analysis of several PLIs, origi-
nated inside the nodes as well as in fiber transmission,
such as insertion losses, ASE noise, NLI noise and in-
band crosstalk is performed, considering quadrature
phase-shift keying (QPSK) signal transmission in the
L-band. The PLIs impact is quantified by the optical
signal-to-noise-ratio (OSNR) given by (Semrau et al.,
2019):
osnr =
p
Rx
p
n,ASE
+ p
NLI
(1)
where p
Rx
is the average signal power at the optical
receiver input, p
n,ASE
is the accumulated ASE noise
power and p
NLI
is the NLI power at the receiver in-
put. The following parameters are considered: the
amplifiers noise figure (F
n
) is 6.5 dB, at most 0.5 dB
higher than in C-band (Correia et al., 2021). The
fiber non-linear coefficient in the L-band, γ = 1.2
W/km, is slightly lower than in the C-band (Semrau
et al., 2018), and the attenuation coefficient is α=0.25
dB/km, slightly higher than in the C-band. The chan-
nel bandwidth of 26.75 GHz is equal to the symbol
rate, R
s
, and the WDM channel spacing is 100 GHz.
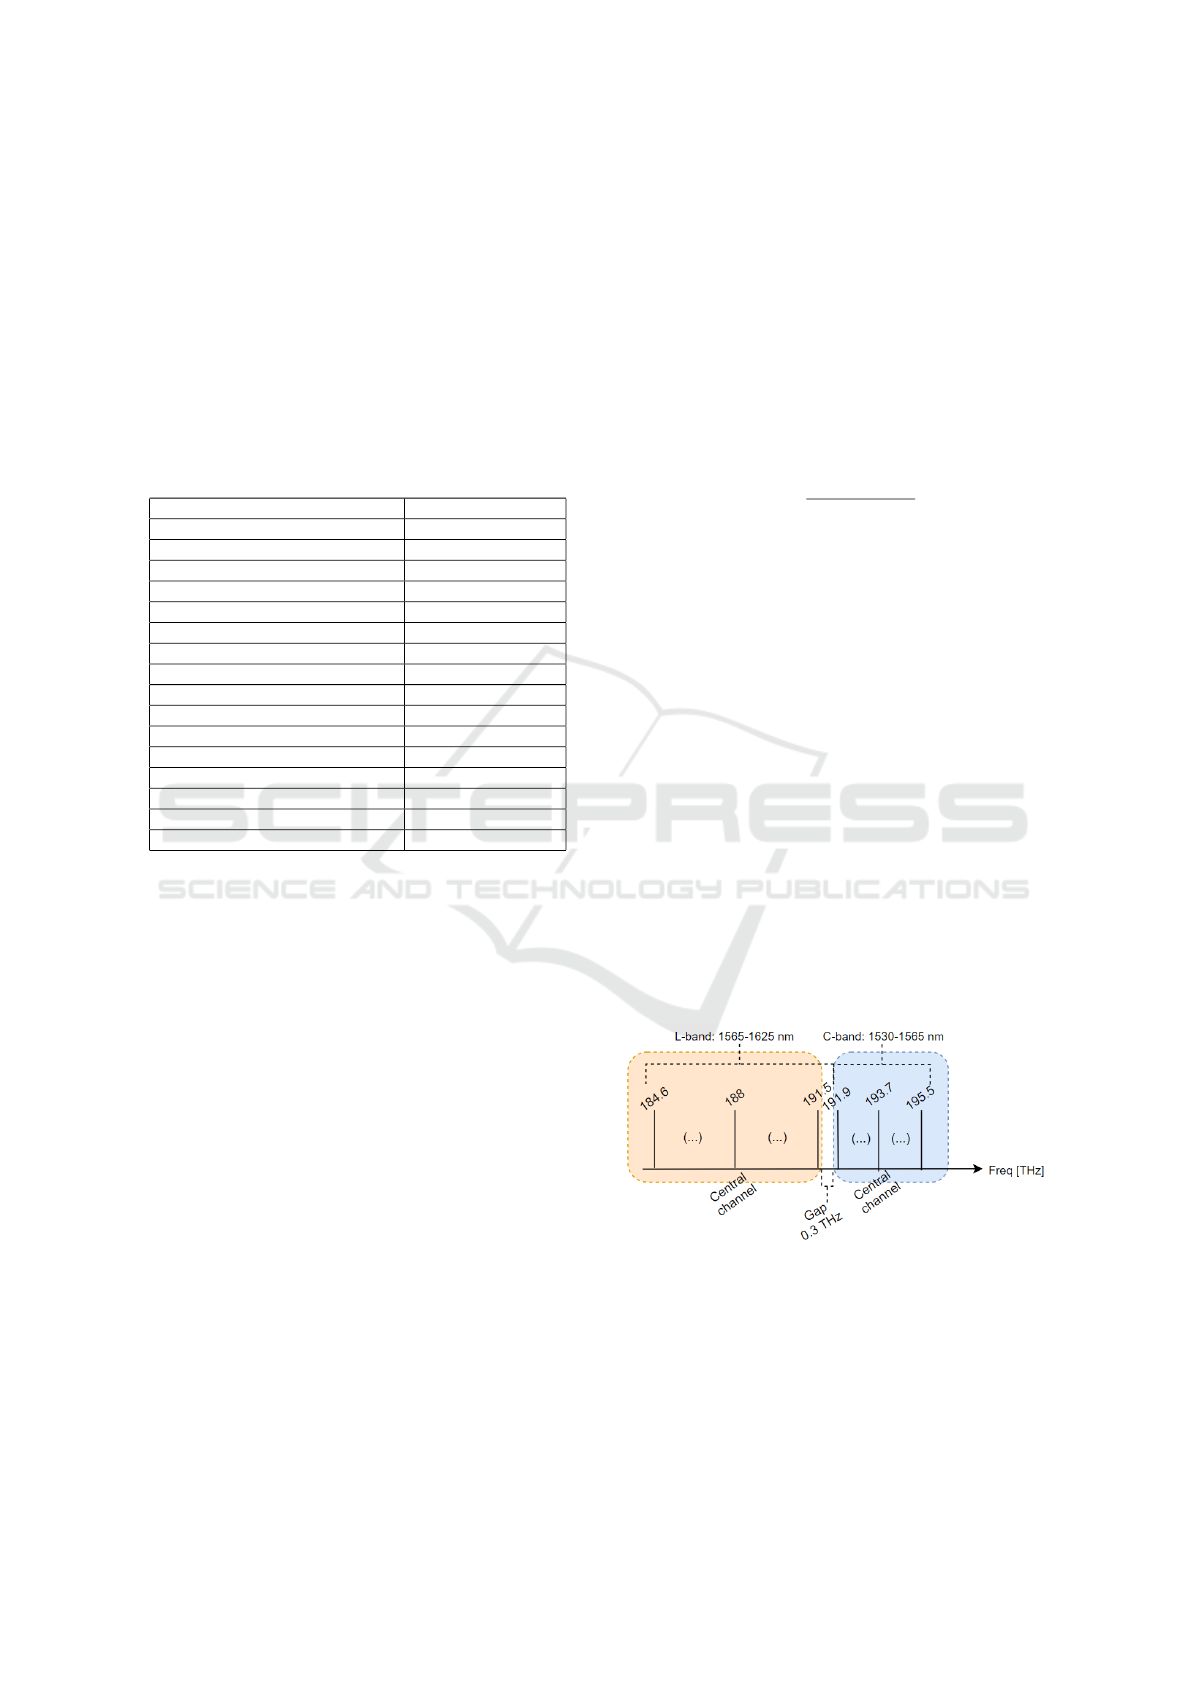
Fig. 6 represents the spectral occupancy of the
70 channels belonging to the L-band and of the
40 C-band channels, considering the International
Telecommunication Union (ITU)-T 100 GHz channel
grid (Telecommunication Standardization Sector of
ITU, 2020). The L-band central frequency is 188
THz, while, in the C-band, is 193.7 THz. A band gap
of 300 GHz between the C and L bands is considered,
which contains 3 unused channels.
Figure 6: WDM signal frequencies for the C+L-band with
100 GHz channel spacing following the ITU-T grid, consid-
ering 40 channels for C-band and 70 channels for L-band.
Regarding the optical filtering effect in the L-
band, only the WSSs in the hub nodes contribute to
this effect. Hence, the effect of the optical filtering is
neglected in the following analysis.
Impact of Physical Layer Impairments on C+L-band Metro Networks
137
4.1 Insertion Losses in Amplified and
Unamplified Solutions
In this section, we present the insertion losses of the
amplified and unamplified solutions. The losses of
each hardware element are those considered in (Her-
nandez et al., 2020). The WSS losses, which are in-
dependent of the WSS size are 7 dB (Sequeira et al.,
2021). The insertion losses considered for the S/Cs
1:2, 1:4, 1:8 and 1:16, are respectively, 4, 7, 11 and
15 dB (Inc., 2019). The losses of the C/L band fil-
ters are around 0.6 dB (Fiberdyne labs, 2021). The
connectors and splices losses are neglected.
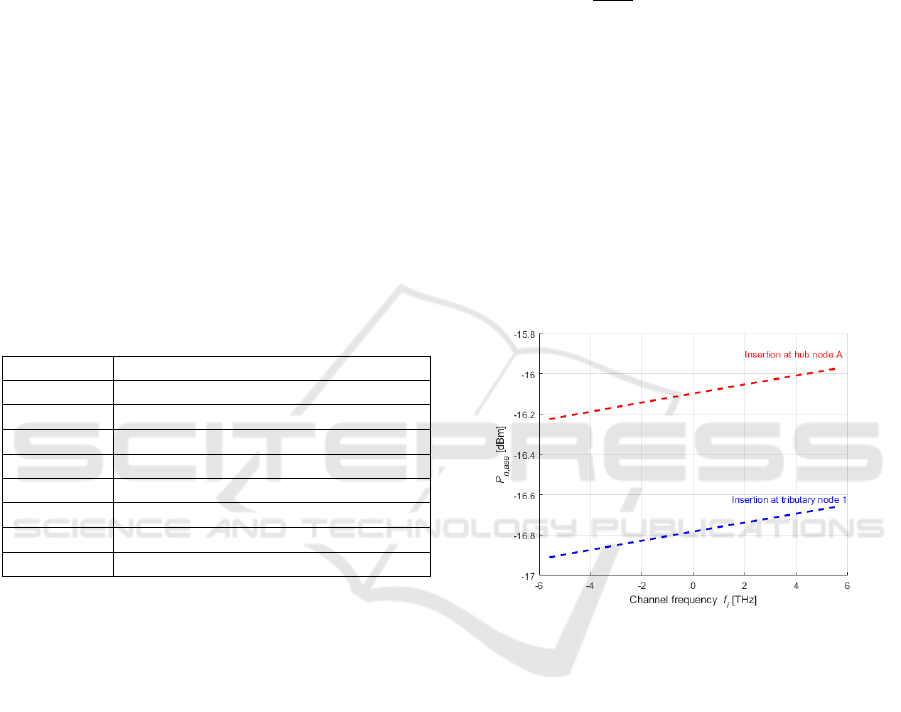
In Tab. 2, the insertion losses inside the add, drop
and express paths of the tributary and hub nodes are
shown. The fiber losses after 10 km are 2.5 dB. The
hub node leads to the highest losses, 25 dB. For the
tributary node, the add and drop paths losses are the
same, 19.6 dB.
Table 2: Insertion losses in the L-band, of the tributary node
the hub node.
Tributary node
Add
path
S/C 16:1+S/C 2:1+C/L filter=19.6 dB
Drop
path
S/C 1:2+S/C 1:16+C/L filter=19.6 dB
Express
path
S/C 1:2 +S/C 2:1 + 2 ×C/L filter=9.2 dB
Hub node
Add
path
WSS 20:1+S/C 1:8+WSS 20:1=25 dB
Drop
path
WSS 1:20 +WSS 1:8+WSS 1:20=21 dB
Express
path
WSS 1:20 +WSS 20:1=14 dB
10 km fiber 2.5 dB
The amplifier gains are designed to perfectly com-
pensate the insertion losses of the worst path inside
the node, the add path. For tributary nodes, only pre-
amplification is used and the amplifier gain is 22.1 dB
to compensate the losses of the 10 km span and node
losses.
4.2 ASE Noise in the Amplified Solution
In this section, the accumulated ASE noise power is
calculated for the amplified solution in the L-band,
considering two worst paths in the horseshoe network,
1) channel insertion at the hub node 1 and drop at
node I in Fig. 2, and 2) channel insertion at node
A and drop at hub node 2. The accumulation of ASE
noise is quantified by the OSNR using (1), firstly, con-
sidering the absence of NLI.
The accumulated ASE noise power is given by:
p
n,ASE
= 2 ×
n
spans
∑
i=1
[p
ASE, pre,i
+ p
ASE, pos,i
] (2)
where n
spans
is the number of spans, p
ASE, pre,i
is the
ASE noise power per polarization generated at each i-
th pre-amplifier output and p
ASE, pos,i
is the ASE noise
power per polarization generated at each i-th post-
amplifier output. The ASE noise power of each am-
plifier is given by
p
ASE,m,i
=
f
n,m,i
2
× (g
m,i
− 1) × h ×ν
0
× R
s
(3)
where m=pre or pos, h is the Planck’s constant and
ν
0
is the optical frequency. The ASE noise power as a
function of the channel frequency (in lowpass equiv-
alent definition) after nine spans of the horseshoe net-
work for the cases of channel insertion at tributary
node A and hub node 1 is shown in Fig. 7. The ASE
noise power increases slightly with frequency and the
difference between first and last channel frequencies
is less than 0.3 dB. The ASE noise power is about 0.7
dB higher, when the channel insertion is in the trib-
utary node in comparison with insertion in the hub
node.
Figure 7: Accumulated ASE noise power as a function of
the channel frequency after 9 spans of the horseshoe net-
work for channel insertion in hub 1 and tributary A nodes.
Fig. 8 shows the OSNR evolution along the net-
work, for both cases of signal insertion, for the chan-
nel frequency of 188 THz. When signal insertion oc-
curs at node 1, the OSNR is significantly degraded
as the signal crosses the nodes, decreasing 9.3 dB.
For signal insertion at node A, the OSNR decreases
7.1 dB. The minimum reference OSNR is 8.5 dB to
achieve a target BER 4 × 10
−3
(Sambo et al., 2020).
Fig. 8 shows that, for both cases of signal insertion,
the OSNR achieved at the optical receiver input pro-
vides a good safety margin in relation to the minimum
OSNR.
4.3 NLI in the Amplified Solution
In this section, the NLI noise power and the associated
OSNRs are studied for the amplified solution. To per-
PHOTOPTICS 2022 - 10th International Conference on Photonics, Optics and Laser Technology
138

Figure 8: OSNR in the horseshoe topology, for signal inser-
tion at the tributary node A and signal insertion at the hub
node 1 for p
Rx
=0 dBm.
form these studies, the NLI calculation and the OSNR
formulation must take into account the presence of
inter-channel Stimulated Raman Scattering (SRS). In
this section, the Gaussian noise model presented in
(Semrau et al., 2019) is considered, where the effect
of the SRS in the NLI noise is taken into account in
simplified closed-form expressions.
The NLI parameter in the L-band, used in the cal-
culation of the OSNR, is given by (Semrau et al.,
2019)
η( f
i
) ≈
n
spans
∑
j=1
P
i, j
P
i
2
[η
SPM, j
( f
i
)n
ε
spans
+ η
XPM, j
( f
i
)]
(4)
where η
SPM, j
( f
i
) is the self-phase modulation (SPM)
contribution generated in j-th span at frequency f
i
,
η
XPM, j
( f
i
) is the total cross-phase modulation (XPM)
contribution generated in j-th span, and P
i, j
is the
power of i-th channel launched into the j-th span, and
ε is the coherent factor of NLI accumulation along
multiple fiber spans. In this work, as we consider
exact loss compensation, P
i, j
=P
i
, and NLI coherent
accumulation is assumed. The SPM contribution is
given by (Semrau et al., 2019):
(5)
η
SPM
( f
i
) ≈
4
9
γ
2
B
2
i
π
Φ
i
α(2α + α)
·
T
i
− α
2
α
arcsinh
Φ
i
B
2
i
πα
+
A
2
− T
i
A
arcsinh
Φ
i
B
2
i
πA
where Φ
i
=
3
2
π
2
(β
2
+ 2π β
3
f
i
), β
2
is the group-
velocity dispersion and β
3
is the higher order dis-
persion parameter (Agrawal, 2010), A= α + α and
T
i
= (α+α−P
tot
C
r
f
i
)
2
, where P
tot
is the WDM signal
launch power, B
i
is the bandwidth of the i-th channel
and C
r
is the slope of the linear regression of the nor-
malized Raman gain spectrum (Semrau et al., 2019).
The total XPM contribution is given by (Semrau et al.,
2019)
η
XPM
( f
i
) ≈
32
27
N
ch
∑
k=1,k6=i
P
k
P
i
2
γ
2
B
k
Φ
i,k
α(2α + α)
·
T
k
− α
2
α
arctan
Φ
i,k
B
i
α
+
A
2
− T
k
A
arctan
Φ
i,k
B
i
A
(6)
where Φ
i,k
= 2π
2
( f
k
− f
i
)[β
2
+ πβ
3
( f
i
+ f
k
)]. In this
work, we consider the simplified case of α = α.
For the NLI study, C
r
=0.028 1/W/km/THz, the
dispersion parameter is 17 ps/nm/km and the disper-
sion slope is ps/nm
2
/km. In Fig. 9 (a), the NLI param-
eter as a function of the WDM channels frequency is
shown, for several input powers per channel, consid-
ering the horseshoe topology with 9 tributary nodes
and 10 km spans. Fig. 9 (a) reveals that, for higher
channel input power, the higher the NLI parameter
and the steepest its tilt, due to the stronger power
transfer from higher to lower frequencies caused by
SRS.
In Fig. 9 (b), the corresponding NLI power as a
function of the WDM channels frequency is shown.
The NLI power is determined by p
NLI
=
P
3
rx
η
(Semrau
et al., 2019), As can be observed in Fig. 9 (b), the
NLI power increases almost 5 dB, for a 4 dBm power
channel, as the channel frequency decreases from the
highest to the lowest channels. Also, it can be ob-
served that, as the input power decreases, the NLI
power increase is smoother from the highest to the
lowest frequency channel. For the -2 dBm channel
power, the NLI power remains practically constant for
all frequency channels due to the reduced SRS. Notice
that the results presented for the NLI power are inde-
pendent on where the signal is inserted in the network.
The OSNR as a function of the channel frequency
after 9 spans considering the ASE noise power and
NLI is shown in Fig. 10, for several input chan-
nel powers, including the optimal power per chan-
nel, which leads to the best OSNR, and the maximum
power per channel to comply the minimum OSNR,
for the worst channel. Fig. 10 corresponds to the case
of: (a) channel insertion at the tributary node A and
(b) channel insertion at the hub node 1. The OSNR is
calculated using Eq. (1).
As can be seen in Fig. 10, for the input power
per channel of -2 and 0 dBm, the NLI power tilt
has practically no influence, so an almost constant
Impact of Physical Layer Impairments on C+L-band Metro Networks
139
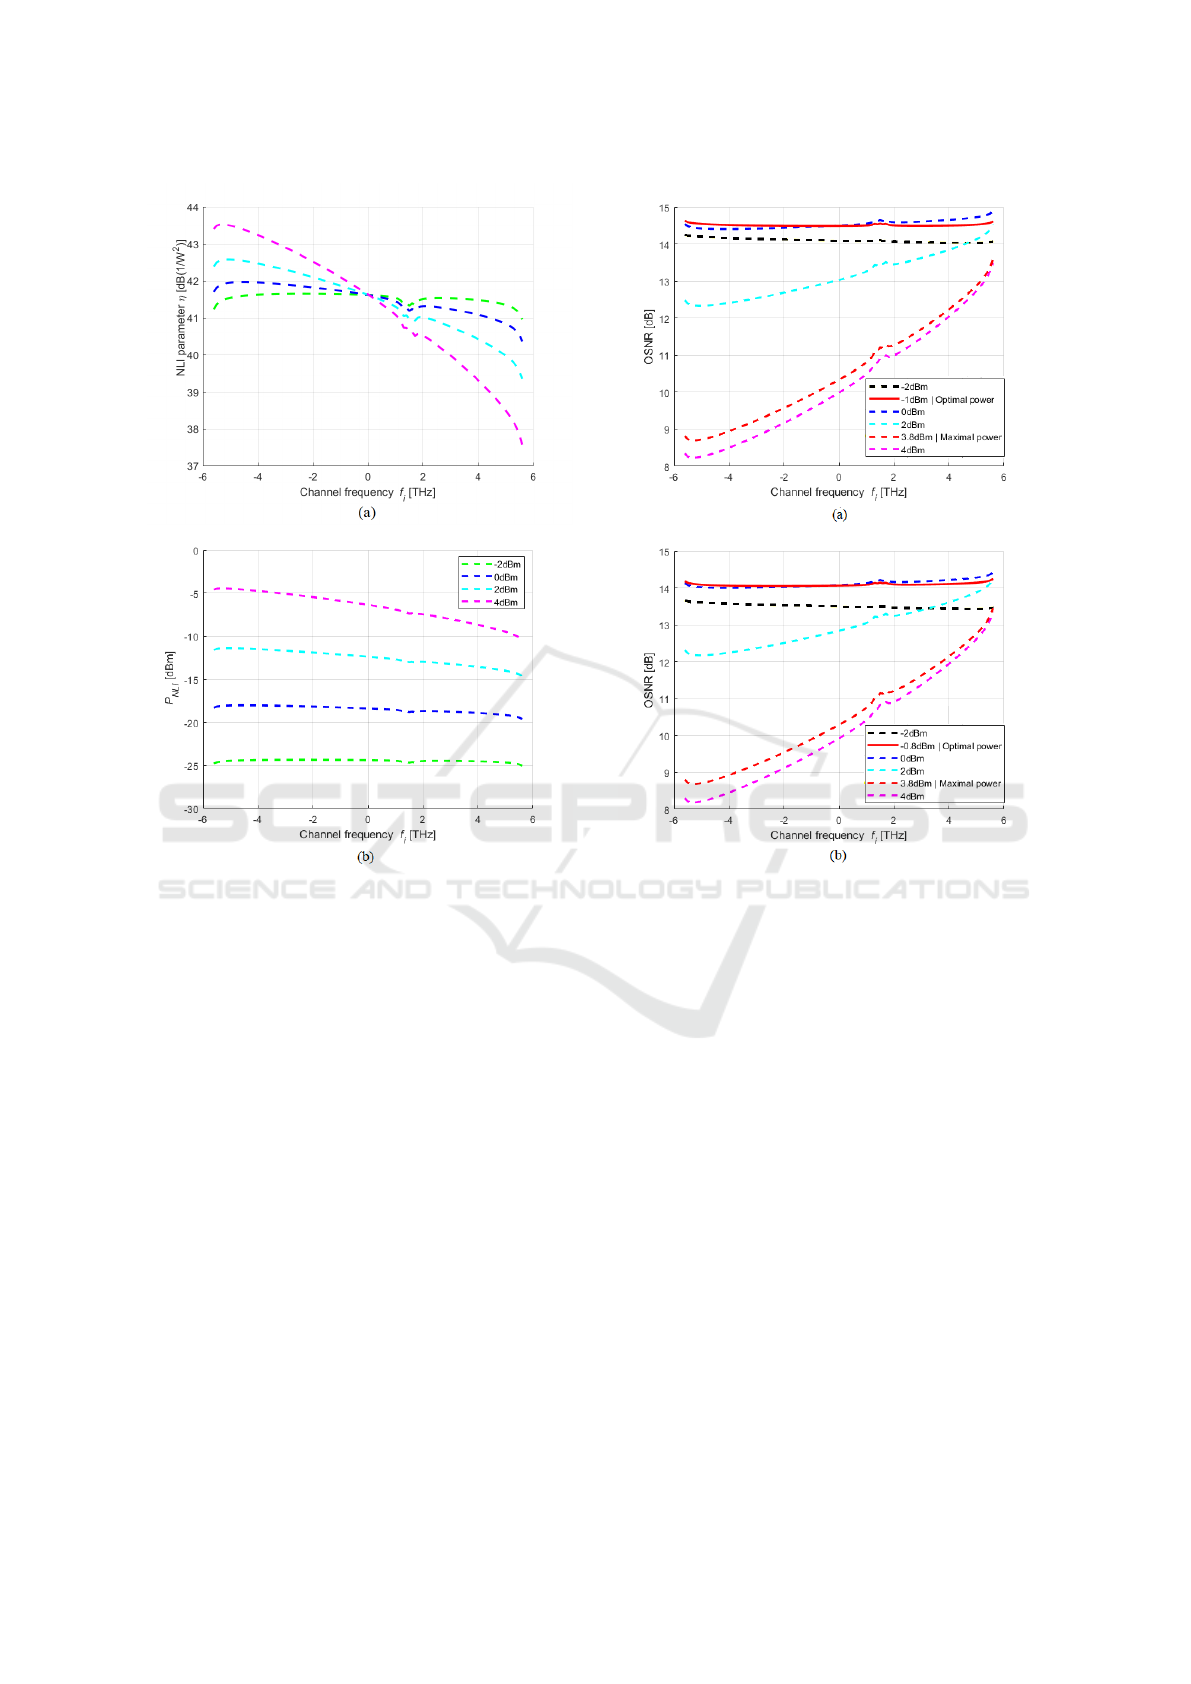
Figure 9: NLI parameter and p
NLI
as a function of the chan-
nels frequency after nine 10 km spans considering coherent
NLI accumulation, for several input powers per channel.
OSNR along all channels is observed. For input pow-
ers higher than 0 dBm, we observe that the OSNR
increases as the channel frequency increases due to
the higher NLI power contribution to the OSNR slope
variation. So, we can state that there is an input chan-
nel power that gives an optimum OSNR. This opti-
mum OSNR is obtained by evaluating the best possi-
ble OSNR, with the highest flatness along the WDM
signal bandwidth (slope as close to zero as possible).
Hence, the optimal input power that leads to the best
OSNR is -1 and -0.8 dBm, respectively, in Fig. 10
(a) and (b), corresponding to the optimal OSNRs of
14.5 and 14 dB. It can be observed that the optimal
OSNR is practically constant along frequency ensur-
ing the same received quality for all WDM channels.
When the signal is inserted in the hub node, the op-
timum OSNRs are around 0.5 dB lower than in the
case of channel insertion in the tributary node due to
the higher ASE noise power added by the hub node.
Finally, it can be observed that all channel powers
considered in Fig. 10 comply with the 8.5 dB mini-
Figure 10: OSNR as a function of the channel frequency
after 9 spans considering the ASE noise power and NLI, for
several input channel powers and insertion channel in the
(a) tributary node A and (b) hub node 1.
mum OSNR required, except for the input power of
4 dBm, where this value is not achieved in the low-
est channel frequencies. The maximum input power
that ensures the minimum OSNR for all WDM chan-
nels is also represented in Fig. 10 and corresponds to
3.8 dBm, for both cases of channel insertion. There-
fore, the difference between the optimal OSNR and
the minimum OSNR is at least 5.5 dB higher, which
ensures enough margin to include other PLIs. For ex-
ample, if we consider a minimum system margin of
3 dB and an extra power penalty due to other trans-
mission effects of 1.5 dB, like components aging, the
minimum OSNR is still accomplished.
4.4 In-band Crosstalk in the
Unamplified Solution
In this subsection, the analysis of PLIs, considering
the signal transmission in the L-band in a horseshoe
topology based on tributary nodes with the FD&W
PHOTOPTICS 2022 - 10th International Conference on Photonics, Optics and Laser Technology
140
unamplified solution is performed. In this scenario,
the main PLI is the in-band crosstalk that arises due
to the wavelength reuse in these networks. First, we
present the analytical formalism used to assess the
impact of this phenomenon, based on the electrical
SNR at the receiver output. We start our analysis by
presenting the SNR at the receiver output without in-
band crosstalk (Rizzelli et al., 2021), and assess the
maximum number of spans a signal can cross in a
lightpath of the horseshoe topology. After, we intro-
duce the in-band crosstalk in our formalism and as-
sess the respective degradation in terms of the number
of spans.
The SNR without in-band crosstalk is given by
(Rizzelli et al., 2021)
snr =
p
Rx
σ
2
th
P
CW
L
+ P
CW
L
σ
2
nLO
CMRR + σ
2
shot
+
p
Rx
SNR
q
(7)
where P
CW
L
is the continuous wave optical power of
the local oscillator (LO), CMRR is the Common Mode
Rejection Ratio of the balanced photodetector, SNR
q
is an additional term to include several implementa-
tion penalties occurring in a coherent system, σ
2
th
is
the variance of the transimpedance amplifier thermal
noise (TIA), σ
2
nLO
is the variance of the LO transmit-
ter relative intensity noise (RIN) and σ
2
shot
is the vari-
ance of the shot noise. The variances σ
2
th
, σ
2
nLO
and
σ
2
shot
are given, respectively, by (Rizzelli et al., 2021)
σ
2
th
=
i
2
T IA
·B
RX
eq
8·R
2
λ
; σ
2
shot
=
q·B
RX
eq
2·R
λ
; σ
2
nLO
= RIN ·
B
RX
eq
2
, where
R
λ
is the overall responsivity of the coherent receiver
(considering also the passives losses before the pho-
todiodes), i
T IA
is the input-referred noise current den-
sity of a TIA, B
RX
eq
is the the receiver effective noise
bandwidth, q is the electron charge and RIN is the LO
RIN parameter. The parameters used to calculate the
SNR are based on the fitting to experimental results
and are given in (Rizzelli et al., 2021). Only a differ-
ent symbol rate of 26.75 Gbaud is considered.
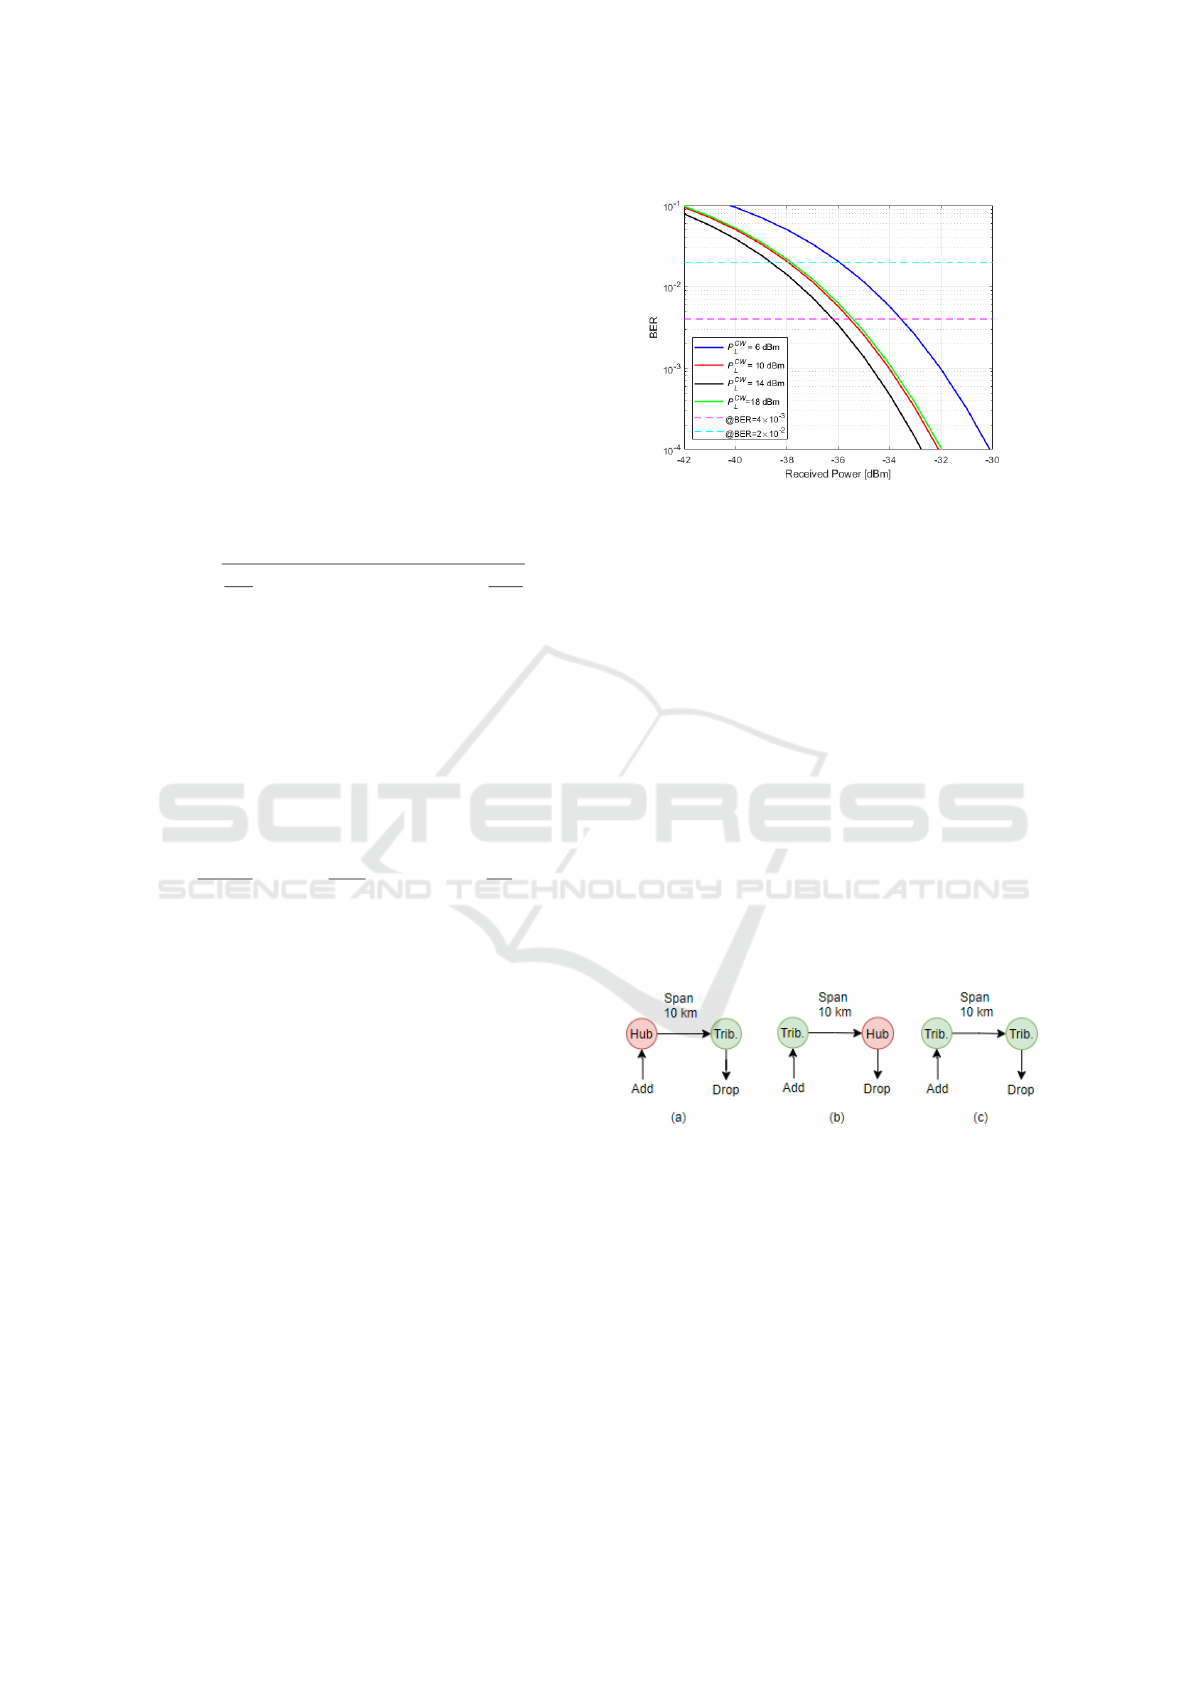
In Fig. 11, the BER as a function of the received
signal power for different local oscillator powers is
presented, considering QPSK modulation, and ob-
tained from the SNR calculated from Eq. 7. The re-
quired target BER assumed for the system is 4 ×10
−3
(HD-FEC) or 2 × 10
−2
(SD-FEC) (Rizzelli et al.,
2021). As observed in Fig. 11, for each LO pow-
ers of 6, 10, 14 and 18 dBm, the minimum received
power required to achieve the target BER is -36.1, -
35.7, -35.6 and -33.8 dBm, respectively, for HD-FEC
and -38.9, -38, -37.9 and -36 dBm for SD-FEC, which
leads to at least 2.2 dB of power budget improvement
for SD-FEC in relation to HD-FEC.
From Fig. 11, it can also be observed that the
LO power of 14 dBm leads to the minimum received
Figure 11: BER as a function of the received signal power
for different local oscillator powers P
CW
L
, for QPSK signals.
power that ensures the target BER, while P
CW
L
= 6
dBm leads to the higher and most demanding received
power to reach the same target BER. Hence, in the
following results, we consider P
CW
L
= 14 dBm, as
the optimum LO power that leads to the target BER.
So, knowing the minimum received power, the main
goal is to compute the maximum power budget and
the maximum reach of the horseshoe network with an
unamplified solution, considering 10 km spans and a
reference input power of 0 dBm, taken from the maxi-
mum input power considered in (Rizzelli et al., 2021).
The maximum power budget is, therefore, 36.1 dB
and 38.9 dB, respectively for the HD-FEC and SD-
FEC.
Then, the insertion losses per span for hub-
span-tributary, tributary-span-hub and tributary-span-
tributary transmission, as shown in Fig. 12, are com-
puted.
Figure 12: Possible span configurations considered to eval-
uate the performance of the unamplified solution.
In Tab. 3 are shown, the insertion losses consid-
ering the configurations of Fig. 12 for different S/C
dimensions are shown. Note that, the green values are
the ones that are feasible for each configuration. As
can be seen in Tab. 3, by comparing the power bud-
gets and the insertion losses of just one span with S/Cs
1:16, it can be concluded that the power budgets are
not sufficient to accommodate these insertion losses.
A possible solution to decrease the insertion losses
per span is to reduce the S/C dimension in the A/D
structures. So, in the tributary nodes shown in Fig.
Impact of Physical Layer Impairments on C+L-band Metro Networks
141
4, the S/Cs 1:16 are replaced by S/Cs with smaller
size, as considered already in some works (Emmerich
et al., 2020b), (Emmerich et al., 2020a), for the un-
amplified solution. The associated insertion losses are
shown in Tab. 3. The A/D structure of the hub node
remains the same as in the amplified scenario.
Table 3: Insertion losses considering the configurations of
Fig. 12 for different S/C dimensions in the A/D structure of
the tributary node.
Total ILs [dB] S/C 1:2 S/C 1:4 S/C 1:8 S/C 1:16
Hub-span-trib. 36.1 39.1 43.1 47.1
Trib.-span-hub 32.1 35.1 39.1 43.1
Trib.-span-trib. 19.7 25.7 33.7 41.7
It can be concluded that one span is possible
with S/Cs 1:2 for the configurations of Fig. 12,
whereas only the tributary-span-hub and tributary-
span-tributary configurations are possible for S/Cs
1:4, and, for the S/C 1:8, only the tributary-span-
tributary configuration is possible. Two spans trans-
mission is not possible.
In order to take into account the impact of in-band
crosstalk, the SNR given by Eq. (7) is rewritten as,
snr =
p
Rx
σ
2
th
P
CW
L
+ P
CW
L
σ
2
nLO
CMRR + σ
2
shot
+
p
Rx
SNR
q
+ p
xc
(8)
where p
xc
is the crosstalk power defined as p
xc
= X
c
×
p
rx
, with X
c
the crosstalk level.
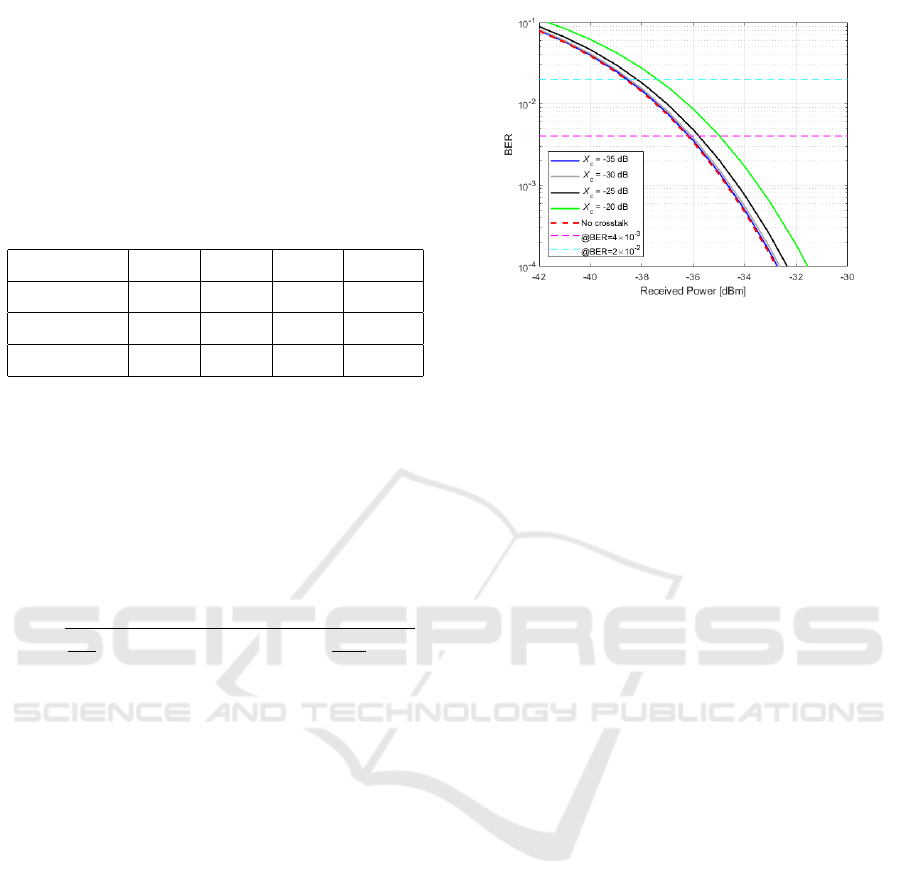
In Fig. 13, the BER as a function of the re-
ceived signal power with different crosstalk levels is
shown. The BER without crosstalk is also repre-
sented for comparison purposes. We have consid-
ered P
CW
L
=14 dBm since it leads to the lowest re-
ceived optical signal power. So, for an input signal
power of 0 dBm, and considering the insertion losses
shown in Tab. 3, for S/Cs 1:2, 1:4 and 1:8, when the
crosstalk level ranges between -35 and -25 dB, the
optical power budget is still feasible for all cases as-
suming a BER=2×10
2
(SD-FEC). For X
c
=-20 dB, the
minimum received power is about -37.4 dBm, consid-
ering SD-FEC, leading to 1.5 dB degradation in rela-
tion to the case without crosstalk. Although the opti-
cal power budget is reduced, the unamplified solution
is still feasible for all the configurations in Fig. 12 for
one span. For a 2 spans transmission, the most fea-
sible configuration is tributary-span-tributary due to
its lower insertion losses, which are very close to the
highest power budget.
Figure 13: BER as a function of the received signal power
with the crosstalk level as a parameter.
5 CONCLUSIONS
In this work, the L-band tributary node architectures
known as FD&W with amplified and unamplified so-
lutions have been studied analytically. The hardware
components, cost, power consumption, offered capac-
ity and the main PLIs that impair the transmission per-
formance in such nodes have been studied,
When the L-band components cost is twice the C-
band cost, the L-band hub and tributary nodes cost is
3.5 times higher than the corresponding C-band node
cost. The transponders contribute around 99% to the
node final cost.
For the amplified solution, considering an horse-
shoe network with 2 hub nodes, tributary nodes, and
10 km spans, and two worst path cases of signal trans-
mission, the optimum OSNR achieved at the optical
receiver input is above 14 dB, when ASE noise and
NLI are considered. This leaves enough margin to
guarantee the minimum OSNR in the amplified solu-
tion.
In unamplified solutions, to accomplish the power
budget, smaller S/Cs 1:2 and 1:4 must be used in the
A/D structure of the tributary nodes, and transmission
should not exceed one fiber span. This allows fre-
quency reuse in the horseshoe network, leading to in-
band crosstalk. For the crosstalk level of -20 dB, a 1.5
degradation on the optical power budget is observed.
ACKNOWLEDGEMENTS
This work was supported under the project of Instituto
de Telecomunicac¸
˜
oes UIDB/50008/2020.
PHOTOPTICS 2022 - 10th International Conference on Photonics, Optics and Laser Technology
142

REFERENCES
Agrawal, G. (2010). Fiber-optic communication systems.
New York: Wiley, 14th ed.
Correia, B. et al. (2021). Power control strategies and net-
work performance assessment for C+L+S multiband
optical transport. Journal of Optical Communications
and Networking, 13:147–157.
Emmerich, R. et al. (2020a). Capacity limits of C+L metro
transport networks exploiting dual-band node archi-
tectures. Optical Fiber Communication Conference
(OFC) 2020, OSA Technical Digest (Optical Society
of America, 2020).
Emmerich, R. et al. (2020b). Dual-band node architec-
tures for C+L-band capacity upgrades in optical metro
transport networks. 21th ITG-Fachtagung.
Ferrari, A. et al. (2020). Assessment on the achievable
throughput of multi-band itu-t g.652.d fiber trans-
mission systems. Journal of Lightwave Technology,
38:4279–4291.
Fiberdyne labs, i. (2021). C and C/L band WDM filters.
Hernandez, J. A. et al. (2020). Comprehensive model for
technoeconomic studies of next-generation central of-
fices for metro networks. Journal of Optical Commu-
nications and Networking, 12:414–427.
Inc., T. F. O. A. (2019). Testing fiber optic cou-
plers, splitters or other passive devices. Available:
www.thefoa.org/tech/ref/testing/test/couplers.html.
Paolucci, F. et al. (2020). Disaggregated edge-enabled C+L-
band filterless metro networks. Journal of Optical
Communications and Networking, 12:2–12.
Rizzelli, G., Nespola, A., Straullu, S., Forghieri, F., and
Gaudino, R. (2021). Scaling laws for unamplified co-
herent transmission in next-generation short-reach and
access networks. Journal of Lightwave Technology.
Sambo, N., Ferrari, A., Napoli, A., Costa, N., Pedro, J.,
Sommerkorn-Krombholz, B., Castoldi, P., and Curri,
V. (2020). Provisioning in multi-band optical net-
works. Journal of Lightwave Technology, 38:2598–
2605.
Semrau, D. et al. (2018). The Gaussian noise model in the
presence of inter-channel stimulated raman scattering.
Journal of Lightwave Technology, 36:3046–3055.
Semrau, D., Killey, R., and Bayvel, P. (2019). A closed-
form approximation of the Gaussian noise model in
the presence of inter-channel stimulated raman scat-
tering. Journal of Lightwave Technology, 37:1924–
1936.
Sequeira, D., Cancela, L., and Rebola, J. (2021). CDC
ROADM design tradeoffs due to physical layer impair-
ments in optical networks. Optical Fiber Technology,
62:102461.
Telecommunication Standardization Sector of ITU, I.-T.
R. G. (Oct. 2020). Spectral grids for WDM applica-
tions: DWDM frequency grid.
Impact of Physical Layer Impairments on C+L-band Metro Networks
143
