
Detection and Identification of Threat Potential of Ships using Satellite
Images and AIS Data
Akash Kumar, Aayush Sugandhi and Yamuna Prasad
a
Indian Institute of Technology Jammu, India
Keywords:
Automatic Identification System (AIS), VGG16, Faster RCNN, MMSI Number, Draught Weight, Blind
Period, Port Call.
Abstract:
This paper addresses the issue of vessel tracking using Automatic Identification Systems (AIS) and imagery
data. In general, we depend on AIS data for the accurate tracking of the vessels, but there is often a gap
between two consecutive AIS instances of any vessel. This is called as blind period or the inactivity period.
In this period, we can not be sure about the location of the ship. The duration of inactivity period is quite
variable due to various factors like weather, satellite connectivity and manual turn off. This makes tracking
and identification of any threat difficult. In this paper, we propose a two-fold approach for tracking and
identifying the potential threat using deep learning models and AIS data. In the first fold, the ships out of
satellite imaging are identified while in the second fold, the corresponding AIS data is analysed to discover
any potential threat or suspicious activity.
1 INTRODUCTION
The problem of surveillance and threat monitoring
is utmost important for the security in coastal areas.
This problem is very challenging and many concerns
with national security. There were many attempts
to monitor the suspicious activities in sea using im-
agery and signal data (JH et al., 2018); (Lane et al.,
2010); (Chang, 2003); (Garagic et al., 2009). In gen-
eral, ocean-going vessels communicates their posi-
tions and route informations among each other using
AIS to avoid collisions. AIS can also be used to mon-
itor the vessels remotely. There are many gaps in AIS
transmissions due to high vessel density, poor qual-
ity transmission and jamming/disabling of transmit-
ters etc. This leads to broken monitoring which is
a critical problem in vessel monitoring and collision
avoidance. In (JH et al., 2018), the authors proposed
a model to identify the high risks gaps occured due
to intentional disabling of the transmitter using prob-
abilistic models in Arafura Sea vessels. Further in
(Lane et al., 2010), five anomalies such as deviation
from standard routes, unexpected AIS activity, unex-
pected port arrival, close approach, and zone entry are
explored and the risk is computed using bayesian net-
work.
a
https://orcid.org/0000-0002-3709-7956
In (Rhammell, 2018), satellite images of ships in
bay areas are produced in 2018 at Kaggle website.
There were many attempts to do segmentation and
identify the ships in satellite images (Swamidason
et al., 2020); (Xie et al., 2020). The methods avail-
able in the literature as outlined above does not ex-
ploit the use of AIS data. In this paper, we attempt to
exploit the AIS data alongwith the satellite imagery.
for surveillance and threat monitoring caused due to
the inconsistency in data. In this work, we assumed
to monitor any particular area at a time. The first step
is to identify any boats in the specified location using
the satellite images. In the next step, we need to locate
all the vessels in the image and find their exact GPS
coordinates. Once we have the latitude and longitude
of all the vessels, we can look up for them in AIS data
to identify the vessels or the vessels that should be
present on the basis of their last transmission. In the
first step, we present the results for identification of
the vessels in any vicinity.
In the next step, we identify the threat potential
of all the vessels using the AIS data. In AIS data, we
can get certain details about the vessel like- MMSI ID,
Vessel type, Cargo number, SOG, transmission times-
tamp, Course, heading, maximum speed and Draught
weight of the vessel. We can use the MMSI id and
the Cargo details to check whether the vessels are au-
thorized or not. Further, even if authorized, vessels
Kumar, A., Sugandhi, A. and Prasad, Y.
Detection and Identification of Threat Potential of Ships using Satellite Images and AIS Data.
DOI: 10.5220/0010914600003124
In Proceedings of the 17th International Joint Conference on Computer Vision, Imaging and Computer Graphics Theory and Applications (VISIGRAPP 2022) - Volume 4: VISAPP, pages
691-698
ISBN: 978-989-758-555-5; ISSN: 2184-4321
Copyright
c
2022 by SCITEPRESS – Science and Technology Publications, Lda. All rights reserved
691

may pose threat, so we can run all the AIS transmis-
sions by that vessel over a few days (or weeks) on a
deep learning model and try to identify the pattern in
the transmission in order to find any suspicious ac-
tivity that could have been performed by the vessel.
It should be noted that the current state-of-the-art ap-
proaches try to analyse the threat entirely on the basis
of AIS data, where, the threat is identified only af-
ter the transmission is back online. In this case, the
information about the blind period is not available.
The paper is organised as follows: In the Section
2, we describe the available literature for ship identi-
fication and suspicious activity monitoring task. Sec-
tion 3, presents the proposed methodology and exper-
iments. The results are discussed in Section 4. Also,
in Section 4, Further directions for the improvements
are also discussed in Section 4. We conclude our work
in Section 5.
2 RELATED WORK
In this Section, we present the related work done on
Ship data available in (Rhammell, 2018). The sample
dataset is available for illustration in Figure 9.
2.1 Generative Additive Models (GAM)
(JH et al., 2018)
In this model, a GAM based model is proposed to
compute the spatial and temporal probability of a suc-
cessful transmission in a specific time window and
geolocation. This model calculates the expected fre-
quency of the transmissions using AIS polls received
from the vessels on daily basis. This expected fre-
quency is affected by terrestrial receiver availabil-
ity, satellite coverage, traffic density, and vessel den-
sity. This paper focuses on identifying intention-
ally disabled transmissions that arises due to longer
runs of non-transmission or much lesser transmis-
sion frequencies. The deviations in expected trans-
mission frequencies are computed in order to identify
the intentionally disabled transmissions. This can also
identify the malfunctioned AIS transmitters.
2.2 Bayesian Method (Lane et al., 2010)
In this approach, authors describes the five anomalies
such as deviation from standard routes, unexpected
AIS activity, unexpected port arrival, close approach,
and zone entry. The authors presented various proba-
bility distribution models to address the above issues
as follows:
• Gaussian mixture model (GMM) for Identifying
deviations from standard routes.
• Bayesian Estimates for identifying unexpected
AIS activity.
• Markov models for identifying unexpected port
arrival.
• Spatial indexing for identifying close approach.
• Gaussian distribution for identifying zone entry.
Further, these five anomalies are modelled using
Bayesian Network to infer the potential threat prob-
ability.
In our proposed work, we would like to combine
the satellite imagery and AIS data to monitor the ves-
sels for any potential threats.
3 PROPOSED METHODOLOGY
AND EXPERIMENT
As our first step is to identify ships in a satellite image,
we have used a dataset of cropped satellite images of
ships (1000) and non-ships (3000), downloaded from
Kaggle-datasets. As the data was imbalanced, we
augmented the data to get 1:1 ratio of ships to non-
ship images. Then we trained a VGG16 based archi-
tecture on the dataset. Here, instead of running clas-
sification sequentially over the total image, a selec-
tive search segmentation method is used which dis-
tinguishes main region of interests (ROIs) and then
the saved VGG16 classification model is run on that.
Once the Ships are identified, we are supposed to
locate them on the image and then find their coordi-
nates. Now, as we have to only pinpoint the ships in a
predefined proposed regions (due to selective search
in the previous step), we used Faster RCNN model
to make bounding box around all the ships in the im-
age. Then we used an open-source API to pinpoint
the coordinates of the vessels using the location of the
nearest port.
Using the coordinates and matching the details
with the AIS database, we will all the necessary de-
tails about the ship. Now, in case the ship can not
be traced back to the AIS data, it should be put under
suspicion. Otherwise, we use the Cargo number of the
vessel and apply the government formula to it to find
the type of cargo and the threat that cargo poses. The
MMSI number is then used to see if the vessel is au-
thorised. Unauthorised vessels should be considered
suspicious.
Lastly, we check the past record of the authorised
vessel for any suspicious activity. For this, we use all
of its last AIS transmissions over past few days. We
VISAPP 2022 - 17th International Conference on Computer Vision Theory and Applications
692
used features like Coordinates, Timestamp, Draught
weight and maximum speed. Using the Coordinates,
we computed the distance of the vessel to the near-
est port at every time it transmitted. As there are dif-
ferent sources for the datasets, we have chosen the
commonly available features for analysing the data.
Now using the time stamp we calculated the time gap
between every two transmissions. There is no stan-
dard threshold for identifying the blind period, we
have used statistical method between two continuous
transmissions to mark blind period. For this, we com-
puted the average time gap over 10 continuous trans-
missions and the standard deviation for the same. If
the time gap between any two transmissions is more
than the sum of average and the standard deviation,
we marked it as ’Blind period’. We also computed
the difference in draught weight between every two
transmissions. We then developed a deep learning
model and trained in on a dataset with features like
time gap, change in latitude and longitude, maximum
speed, SOG, distance from port before and after and
the target class as the suspicion level.
In addition, we are using rule based application
of the model. We are only applying the model when
there is a possibility of something suspicious, i.e. ei-
ther a blind period or a change in draught weight. We
then used this model on the features extracted from
the data of the vessel that we are tracking. The model
provides the suspicion level of the vessel, and also the
type of suspicious activity it could have been doing
like unauthorised port call, illegal ship to ship trading
or illegal fishing. The proposed approach is illustrated
in Figure 4.
In this work, we have proposed a model for ves-
sel tracking and threat prediction using deep learn-
ing framework by employing satellite images and syn-
chronised AIS data. The primary results are motivat-
ing for the deployment of the our proposed model in
real-time.
4 RESULTS
4.1 Dataset
We have used a dataset of cropped satellite images of
ships (1000) and non-ships (3000), downloaded from
Kaggle datasets https://www.kaggle.com/rhammell/
ships-in-satellite-imagery (Rhammell, 2018). This
dataset is imbalanced. In order balance the datasets,
offline image augmentation is performed using Hor-
izontal flips, random crops, strengthening and weak-
ening of brightness as well as contrasts, and applying
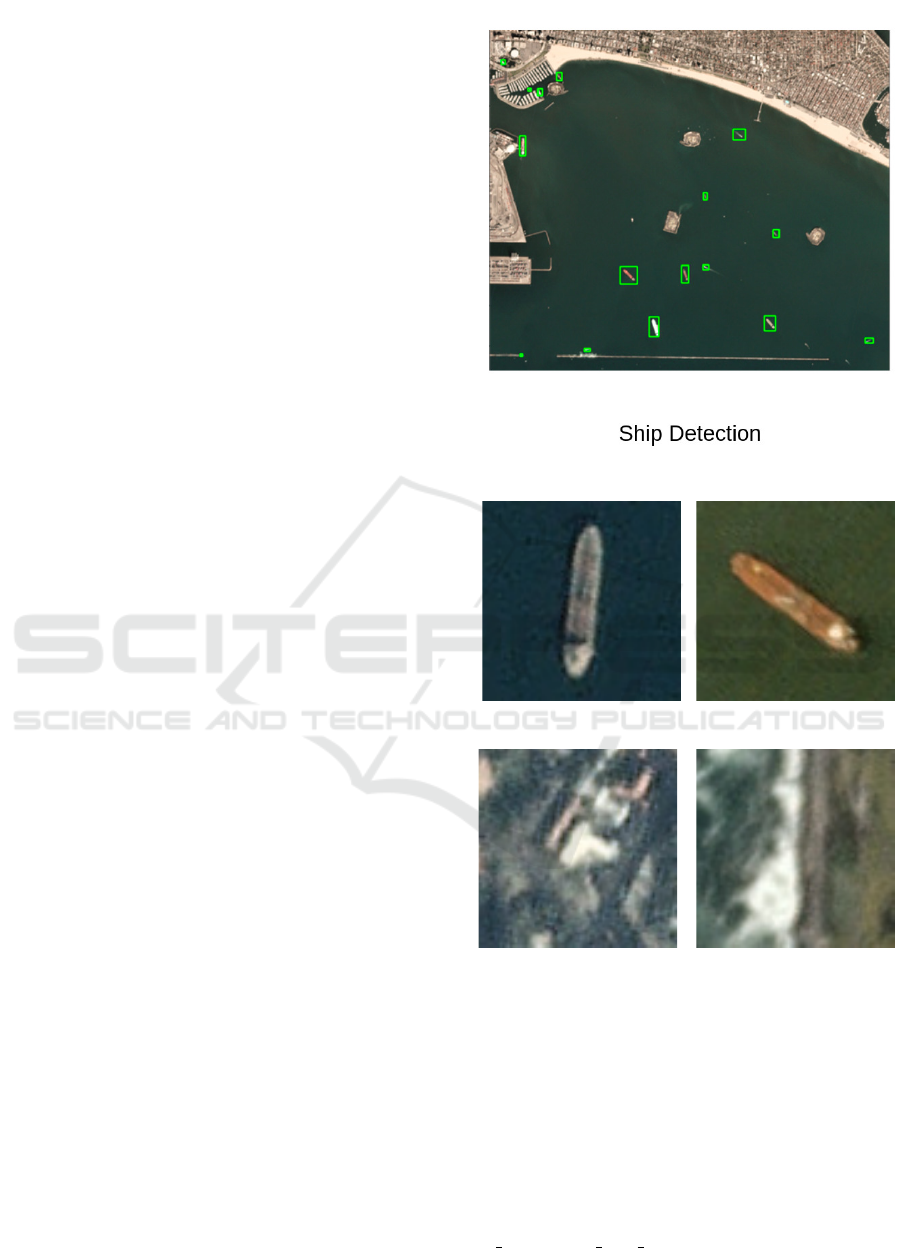
Figure 1: Ship Detection.
(a) Scene 1: ship (b) Scene 1: ship
(c) Scene 2: No ship (d) Scene 2: No ship
Figure 2: These figure represents the scenes containing
ships (a and b) and no ships (c and d).
affine transformations. After the augmentation, the
data has 1:1 ratio of ships to non-ship images.
In order to identify the suspicion level from AIS
data, we used dataset from IEEE Dataport (Hakola,
2020). The AIS dataset contains the information
about timestamp, mmsi, lat, lon, speed (meters per
second), course (degrees), heading (degrees), turn-
rate (degrees per minute), breadth (meters), ves-
sel type, vessel max speed (meters per second), draft
(meters), power, dwt (tons) and ice-class. Out of
Detection and Identification of Threat Potential of Ships using Satellite Images and AIS Data
693
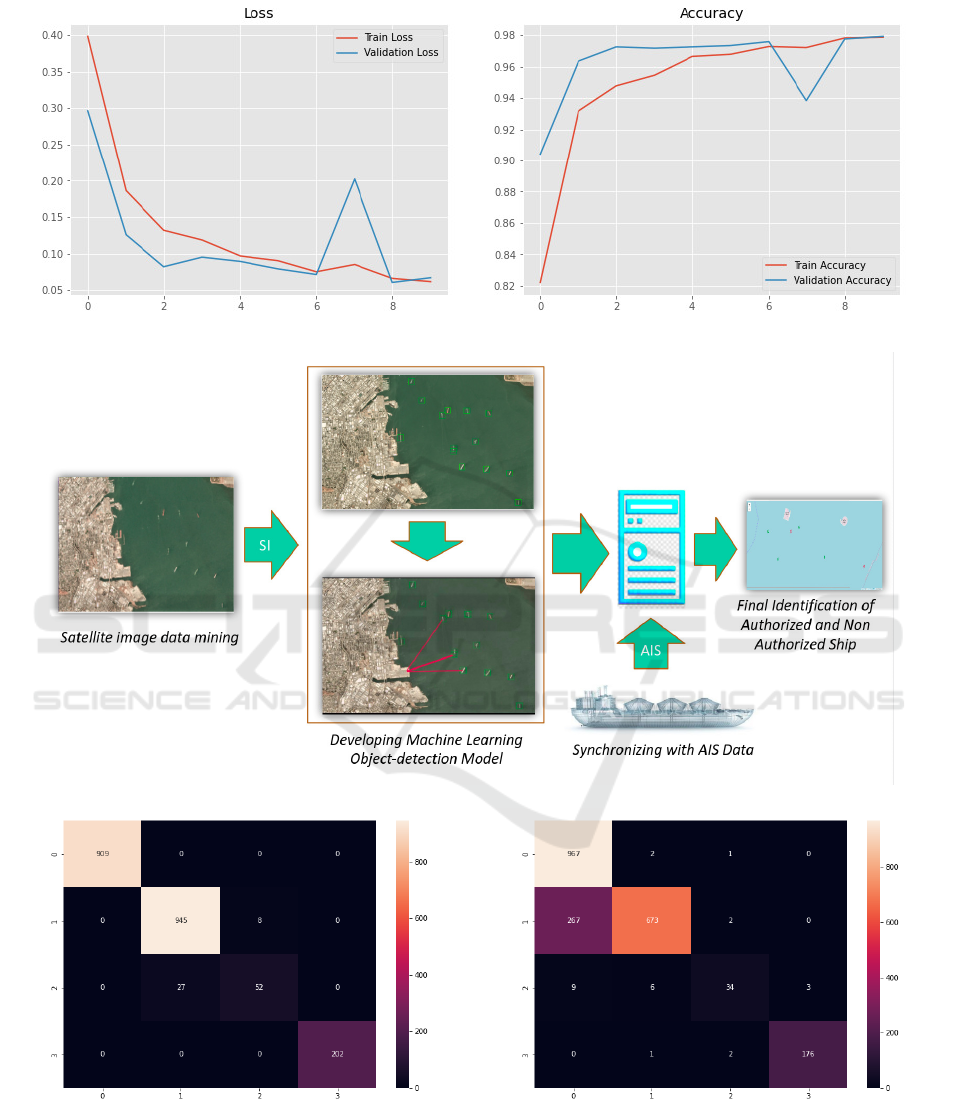
Figure 3: Ship Detection Accuracy.
Figure 4: Proposed Approach.
Figure 5: AIS threat detection (confusion Matrix) for
Dataset1.
these many features, the seven features were derived
from the dataset. These features are time difference,
longitude difference, latitude difference, max speed,
draught weight difference, distance from shore for
Figure 6: AIS threat detection (confusion Matrix) for
Dataset2.
first instance and distance from shore for second in-
stance. All these features are derived from a pair of
consecutive AIS transmissions.
As the dataset didn’t have any threat/suspicion la-
VISAPP 2022 - 17th International Conference on Computer Vision Theory and Applications
694
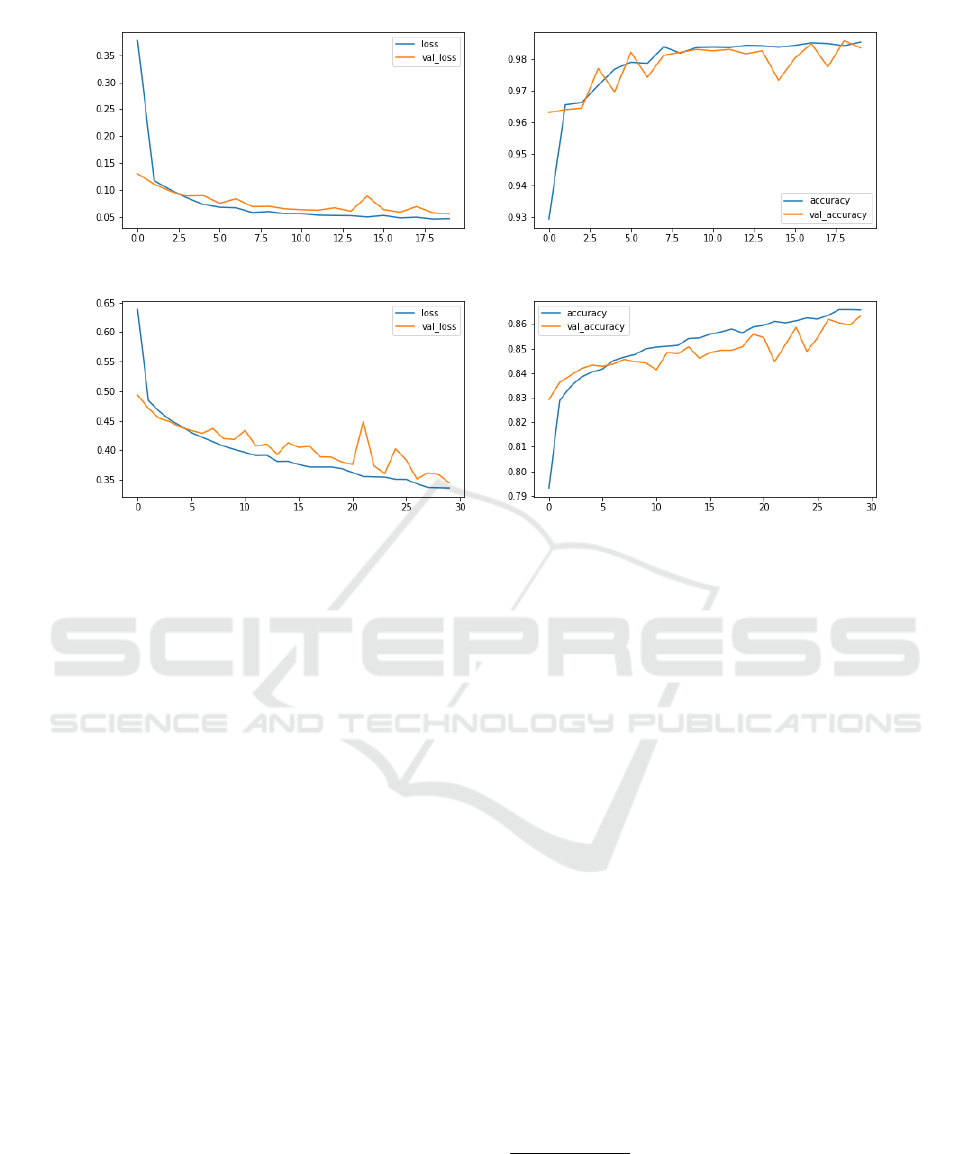
Figure 7: AIS threat detection loss and accuracy for Dataset1.
Figure 8: AIS threat detection loss and accuracy for Dataset2.
bel, we created the labels using statistical approach.
It lacked certain features like ‘Draught Weight’, so
we added the same on our own. The first step was to
identify Blind Periods, now if the blind period was
less than an hour, we assumed it to be some tech-
nical issue and marked it safe (label 0), if the blind
period was over an hour and less than 6 hours, and
there is a difference in draught weight, we assume
it to be suspicious (label 1) of doing some illegal
ship to ship trading, illegal garbage dumping or ille-
gal fishing. Now in case, the blind period is over six
hours and less than 24 hours, and if the total distance
of the ship from the nearest port, before and after
the blind period is less than max(speedo f vessel) ×
(blind period–2hours), we assumed it to be a port call
(label 2). And if the Blind period was over 24 hours,
we assumed it to be in a dockyard (label 3). Rest all
are assumed to be safe i.e. label 0. We name this
dataset as dataset1 in our experiments.
Further, we have used the same dataset but instead
of going for a staring forward statistical labelling, we
introduced randomness varying from 5% to 40% for
different labels while keeping the same approach as
the previous one. This dataset is named as dataset2 in
out experiments. Both the datasets are used to detect
the threat.
4.2 Discussion
The satellite images were used to find the ship using
Faster RCNN ((Ren et al., 2017)) with VGG-16 based
CNN model ((Liu and Deng, 2015))
1
. The Faster
RCNN created the bounding boxes around the vessels
while VGG-16 framework (a CNN model) detects the
vessels with an accuracy of 98% (Figure 1 and Figure
3
2
.
Once the vessels (ships) are identified, the cor-
responding synchronised AIS data is captured for
threat detection. In order to develop a threat model
the synchronised dataset1 and dataset2 is used for
threat detection. A simple 4-layer dense neural net-
work (DNN) model with relu activations has been
used to train the AIS data for threat detection. The
4
th
-layer represents the multi-class classification out-
put, therefore, we have used softmax activation with
cross-entropy as the loss function. The proposed
DNN model achieves a validation accuracy of around
98.37% for detecting the possible suspicious activi-
ties (Note: the labels were created on the basis of
statistical approach (dataset1; Figure 7)). The same
model gave an accuracy of 86.33% when some ran-
domness was introduced in the dataset (dataset2; Fig-
ure 8). Figure 2, presents the scenes with ships (a and
b) and without ships (c and d). It should be noted that,
Figure 1 and Figure 3 illustrates the ship detection and
accuracy results while Figures 7 - 8 presents the loss
1
We have choosen Faster RCNN due to its lower com-
plexity over YOLO and RCNN
2
we tried multiple models like VGG-16, VGG-19, In-
ception, Simple Convolutional models and we found that
VGG-16 outperformed VGG-19, Inception and Simple
Convolutional models for this data.
Detection and Identification of Threat Potential of Ships using Satellite Images and AIS Data
695
(a) Scene 1
(b) Scene 2
(c) Scene 3
(d) Scene 4
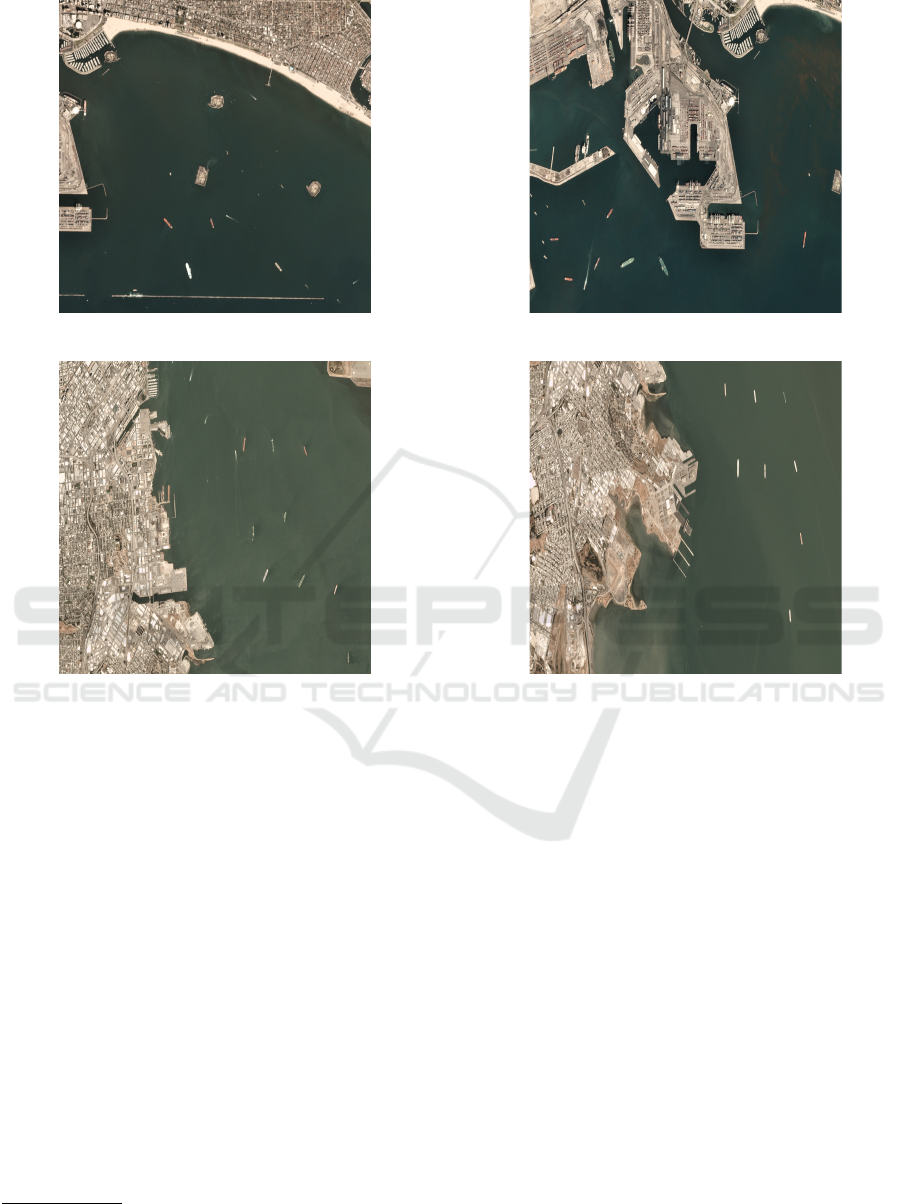
Figure 9: These figure represents ships at different locations.
and accuracies for threat detection for dataset1 and
dataset2 respectively. We would like to demonstrate
the proposed tool during the conference if accepted
3
.
4.3 Future Work
In addition to the current work, there are two more ap-
proaches that can be used in order to determine threat
more accurately.
4.3.1 Like for Like Comparison
Using the AIS data of ships that travelled through that
region, we can predict if the transmission gap/ blind
period is due to some network issue or the AIS trans-
mitter is turned off manually. Additionally if multiple
ships go dark in the same vicinity and in the same
timeframe, we can determine illegal ship to ship trad-
ing more accurately by processing the AIS data for all
3
The code is available at https://github.com/
akash-iitjammu/AIS-threat-monitoring.
those ships simultaneously.
4.3.2 Path Prediction
We can use RNNs to predict the possible path of a ves-
sel in its blind period using its trajectory before and
after the dark period, time difference and maximum
speed. Knowing the possible trajectory can help us
determine illegal port calls, ship to ship trading with
more precision.
4.3.3 Density based Clustering
We can use Density based clustering algorithms to
find out regions with minimum to no transmissions at
all by all the ships in a particular timeframe. This will
help us identify regions with poor network connectiv-
ity, and then if a vessel went dark in one cluster and
then re-appears in another, we can take it as it passed
through a low connectivity zone and so can’t transmit,
and we can mark it safe i.e. not suspicious.
VISAPP 2022 - 17th International Conference on Computer Vision Theory and Applications
696

5 CONCLUSIONS
There are very few literatures available in this field to
identify the potential threats during vessels movement
in ocean. There is a huge scope of developments and
improvements to identify the threat potential of the
Vessels. In most of the works, only AIS data is con-
sidered for monitoring the ships.
In this work, we have proposed a deep learning
based approach where, we are not just tracking the
vessels by its AIS data but also using satellite imaging
to detect the vessels. Satellite imaging gives us an
added advantage, as for in any region, we can know
the ships that passed through even if their AIS beacon
was turned off. This increases the reliability of our
approach. The results obtained show the applicability
of our proposed model in real-time.
REFERENCES
Chang, S. (2003). Vessel identification and monitoring sys-
tems for maritime security. In IEEE 37th Annual 2003
International Carnahan Conference on Security Tech-
nology.
Chawla, N., Bowyer, K., Hall, L., and Kegelmeyer, W.
(2002). Smote: Synthetic minority over-sampling
technique. Journal of Artificial Intelligence Research,
16:321–357.
Connor, S. and Taghi, M. (2019). A survey on image data
augmentation for deep learning. Journal of Big Data,
6(60).
Garagic, D., Rhodes, B. J., Bomberger, N. A., and
Zandipour, M. (2009). Adaptive mixture-based neu-
ral network approach for higher-level fusion and au-
tomated behavior monitoring. In NATO Workshop on
Data Fusion and Anomaly Detection for Maritime Sit-
uational Awareness, La Spezia, Italy.
Hakola, V. (2020). Vessel tracking (ais), vessel metadata
and dirway datasets. In IEEE Dataport.
He, K., Gkioxari, G., Doll
´
ar, P., and Girshick, R. (2017).
Mask r-cnn. In IEEE International Conference on
Computer Vision (ICCV), pages 2980–2988.
I., H. (2018). Data augmentation by pairing samples for
images classification. ArXiv e-prints.
JH, F., D, P., D, K., BD, H., U, R., and C, W. (2018). De-
tecting suspicious activities at sea based on anomalies
in automatic identification systems transmissions. In
PLoS ONE 13(8): e0201640.
Karen, S. and Andrew, Z. (2015). Very deep convolutional
networks for large-scale image recognition. In Inter-
national Conference on Learning Representations.
Lane, R. O., Nevell, D. A., Hayward, S. D., and Beaney,
T. W. (2010). Maritime anomaly detection and threat
assessment. In 13th International Conference on In-
formation Fusion.
Liu, S. and Deng, W. (2015). Very deep convolutional
neural network based image classification using small
training sample size. In 2015 3rd IAPR Asian Confer-
ence on Pattern Recognition (ACPR), pages 730–734.
Luis, P. and Jason, W. (2017). The effectiveness of data aug-
mentation in image classification using deep learning.
Stanford University research report.
Ren, S., He, K., Girshick, R., and Sun, J. (2017). Faster r-
cnn: Towards real-time object detection with region
proposal networks. IEEE Transactions on Pattern
Analysis and Machine Intelligence, 39(6):1137–1149.
Rhammell (2018). Ships in satellite imagery https://www.
kaggle.com/rhammell/ships-in-satellite-imagery.
Swamidason, Joseph, I. T., Sasikala, J., and Juliet, S.
(2020). Detection of ship from satellite images us-
ing deep convolutional neural networks with improved
median filter. In Artificial Intelligence Techniques for
Satellite Image Analysis. Remote Sensing and Digital
Image Processing, vol 24. Springer.
Xie, X., Li, B., and Wei, X. (2020). Ship detection in multi-
spectral satellite images under complex environment.
In Remote Sens. 12, 792.
APPENDIX
The proposed model for ship detection based on
VGG-16 with detailed layer architecture is presented
in the figure (10) below. After detecting the ship,
Faster RCNN method is applied to get the bounding
box around the ships.
Detection and Identification of Threat Potential of Ships using Satellite Images and AIS Data
697
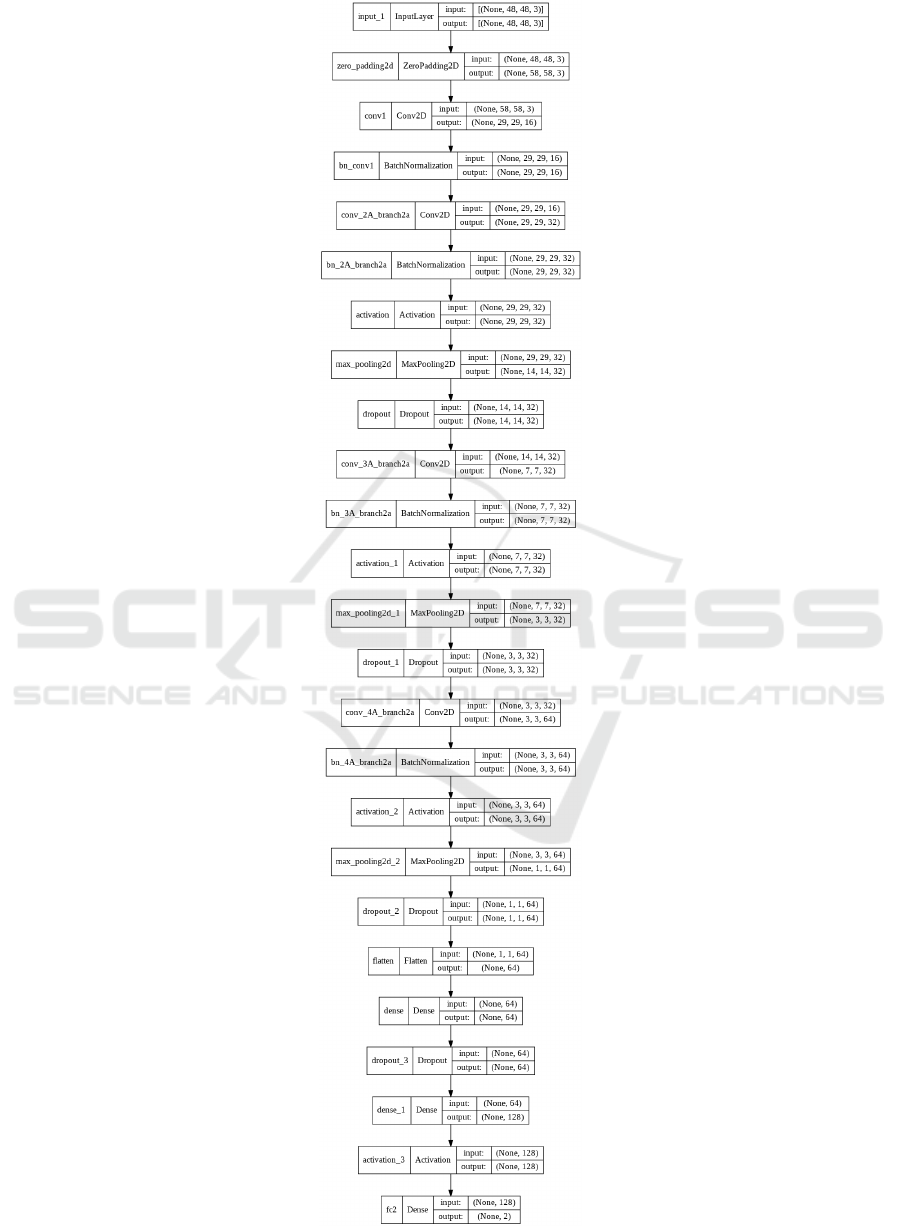
Figure 10: Ship Detection Model Based on VGG-16.
VISAPP 2022 - 17th International Conference on Computer Vision Theory and Applications
698
