
Text Classification of English News Articles using Graph Mining
Techniques
Hasan Hameed Hasan Ahmed Abdulla
a
and Wasan Shakir Awad
b
College of Information Technology, Ahlia University, Exhibition Road, Manama, Bahrain
Keywords: Graph Mining, News Articles, Text, Classification, Algorithm, Language Processing, Weighting Scheme.
Abstract: Several techniques can be used in the natural language processing systems to understand text documents, such
as, text classification. Text Classification is considered a classical problem with several purposes, varying
from automated text classification to sentiment analysis. A graph mining technique for the text classification
of English news articles is considered in this research. The proposed model was examined where every text
is characterized by a graph that codes relations among the various words. A word's significance to a text is
presented by the graph-theoretical degree of a graph's vertices. The proposed weighting scheme can
significantly obtain the links between the words that co-appear in a text, producing feature vectors that can
enhance the English news articles classification. Experiments have been conducted by implementing the
proposed classification algorithms in well-known text datasets. The findings suggest that the proposed text
classification using graph mining technique as accurate as other techniques using appropriate parameters.
1 INTRODUCTION
An article is defined as "a written work published in
a print or electronic medium." It may deliver news,
study results, theoretical analysis, or discussions. On
the other hand, a news article presents the current
information of common interest or a particular topic.
Using the recent advancements in technology to
collect and share news, texts can be produced all the
time. Therefore, text classification (TC) has become
the most suitable solution to efficiently searching
available textual information. TC is an essential field
of natural language processing (NLP). It involves the
efficient use of NLP to maximize the data value
obtained from a text document (Sarkar, 2019).
TC serves as one of the critical tasks while gaining
knowledge from various sources. It assigns a
predetermined label to texts written in natural
language. Deciding the most desired features in the
text document plays a vital role in classification
problems. Developing an algorithm for TC is
essential to enhance information search given recent
text data collection classification requirements and
characteristics. (Mukherjee, Sahana and K. Mahanti
2017).
a
https://orcid.org/0000-0001-7561-5366
b
https://orcid.org/0000-0001-7152-3480
Applying classification techniques to solve
English news articles TC problems has challenges.
First, it has practical memory and processing power
limitations. Also, numeric features must get complex
text semantics, taken from word occurrence, and
noise-free. Moreover, the classifier design uses
massive model governance rather than hidden text
functions through reversed classifier performance—
furthermore, the spreading variety of text nature with
highly changeable content, quality, and breadth.
Lastly, TC might drive independence because of new
classes and outliers. (Torres-Carrion et al. 2018).
While dealing with massive text data, keeping the
TC model accuracy and performance becomes a big
challenge. The model performance depends on the
words typically used in the tokens and the
classification features. Improving the performance
metrics is essential, which is a valuable assessment of
how well a classifier works. Various algorithms have
been proposed for TC. (Sokolova 2017).
The support vector machine (SVM) model
involves a regularization parameter that can get
around overfitting. Its kernel design aids in
incorporating expert knowledge. Still, it challenges
926
Abdulla, H. and Awad, W.
Text Classification of English News Articles using Graph Mining Techniques.
DOI: 10.5220/0010954600003116
In Proceedings of the 14th International Conference on Agents and Artificial Intelligence (ICAART 2022) - Volume 3, pages 926-937
ISBN: 978-989-758-547-0; ISSN: 2184-433X
Copyright
c
2022 by SCITEPRESS – Science and Technology Publications, Lda. All rights reserved

choosing the most suitable kernel and increases the
time for testing and training. (Sarkar 2019).
Artificial neural networks are more comfortable
to use, about any function, and nearly match the
human brain. It needs extensive test and training data;
many operations are hidden and challenging to
improve accuracy. (Mukherjee, Sahana and K.
Mahanti 2017).
Representing the text in Graph-based
representations can be used to solve TC tasks using
graph mining techniques. Graph mining is a
collection of methods and tools used to analyze real-
world graph characteristics. It can predict how a
graph structure and properties affect some
applications. It also develops models that can produce
realistic graphs like real-world graph patterns. (Baker
and Korhonen 2017).
News articles consist of bundled scattered text.
Articles TC is a complicated task as it involves
dealing with text that is inherently unstructured, semi-
structured, and in a fuzzy form. Many news article TC
algorithms need structuring these text documents in
scales unavailable to human coding.
Artificial neural networks can outperform every
traditional TC algorithm out there, but they have a
cost. Their TC will take much longer to train rather
than other TC algorithms. Although it depends on
how deep the TC artificial neural network
architecture and the size of text data is but still, in
most cases, it has an impact on computational power
and time. (Kowsari et al. 2019).
This research is to propose a graph-mining model
that improves news article TC performance accuracy
and has efficient computer performance compared to
artificial neural networks.
1.1 Problem Statement
With the increasing of English news articles, new
tools for textual content managing arise. These tools
should pre-process, analyze, and classify raw text to
better interact with it. Typical characteristics of such
tools include entity recognition, sentiment analysis,
syntactic analysis, and content classification. Since
this trend now exists for a long time, there are
solutions in NLP techniques available, including
computing methods for automatic analysis of news
articles. One NLP approach that offers an immediate
solution for content classification is TC.
The earlier techniques have limitations that affect
TC accuracy and efficiency. Better and more accurate
results can still be achieved. Moreover, graph mining
opens a new research area in TC, leading to
significant accuracy improvement. Consequently,
approaching 100% in news articles TC accuracy is
challenging, but improving the current obtained TC
performance metrics can be targeted. This research
aims to strengthen TC of English news articles'
performance metrics using graph-based text
representation and graph-mining techniques.
1.2 Objectives
The main research objectives are as follows.
I. To conduct a gap analysis for identifying the
key factors impacting TC accuracy.
II. To propose a graph-mining model that
improves TC accuracy.
III. To verify and benchmark the overall
performance of the model using various
performance metrics.
2 THEORETICAL
BACKGROUND
NLP is a specialized area of artificial intelligence
(AI), information technology, and linguistics related
to programs, computers, and human interactions to
analyze and process massive natural language data.
(Sarkar 2019)
TC is the method of classifying the text based on
its content. It is one of NLP's main tasks with
extensive implementations for sentiment analysis,
content management, labeling, context search, and
spam filtering. (Sarkar 2019)
Two different main approaches have been
identified to classify a text. First, the rule-based
approach categorizes text into ordered sets by using a
set of semantic rules. These rules direct the system to
use relevant linguistic text elements to identify
applicable labels based on its content. Each rule
includes a label and pattern. They are human-
understood and can be altered with time. However,
this approach has notable drawbacks. They are too
challenging to manage and do not scale thoroughly,
given that appending additional rules can affect the
pre-existing rules. (Thangaraj and Sivakami 2018)
Secondly, using the Machine Learning (ML)
techniques approaches to learn to classify previous
observations. ML algorithms can learn various text
relationships using pre-labeled samples as training
data and assign a particular text label (“Automated
Machine Learning” 2019).
Graph mining is described as “mining non-trivial
graph structures from a single graph or a collection of
graphs.” An initial move to train a classifier is feature
Text Classification of English News Articles using Graph Mining Techniques
927
extraction, a process applied to convert all text to a
graph. A common approach is a bag-of-words that a
graph that describes a word in a text. Thus, the graph-
mining algorithm is supplied by training data that
includes graph sets for various text samples and labels
to create a classification model. (Hartmann et al.
2019).
Once the model is trained by sufficient data, the
graph mining model can give accurate classifications.
Similarly, a feature extractor is used to reconstruct
text into a graph and serve the graph mining model.
(Barberá et al. 2020).
Cross-validation is a standard way to judge a text
classifier performance. It randomly divides the
training data set into equal data groups. Each group,
a text classifier, is trained with the remaining data.
Next, classifiers give classification on their groups,
and results correlate with human-labeled labels. This
determines when a label is valid and when it is
invalid. With these results, performance metrics can
be devised to assess how properly classifiers work.
(Torres-Carrion et al. 2018).
This research will use graph mining as a base to
improve TC performance metrics.
2.1 Bag-of-Words Text Representation
A bag-of-word model is a simplified text
representation that is applied in NLP. The text is
defined as a multiset of its word while ignoring
grammar and even word sequence but maintaining
multiplicity. It is commonly used in TC methods
where the word frequency is used as a feature to train
a classifier (Zhao and Mao 2018).
2.1.1 Limitation of Bag-of-Words
Bag-of-Words is a standard method of describing text
data as an input functionality vector to the machine
learning model. It codes all the words in a vocabulary
being as a one-hot vector. Every text is converted to
a dimensional feature vector (V), the vocabulary size.
Every dimension in the functional vector contains the
word that occurs in the text document. (HaCohen-
Kerner, Miller and Yigal 2020).
Hence, only a single value will be nonzero for
each dimension; this outcome is a high dimensional
feature vector due to the enormous size of vocabulary
(V). Additionally, it does not provide concurrence
word weights. In other words, it assumes all words
are independent. Because vocabulary could
theoretically go into billions, bag-of-words models
cope with scalability difficulties. It results in a highly
tenuous vector as there is a value that is not in
dimensions associated with the words that appear in
the sentence (HaCohen-Kerner, Miller and Yigal
2020).
2.2 Term Frequency-Inverse Document
Frequency
Jones (2017) suggested the inverse document
frequency (IDF) be applied in combination with term
frequency (TF) to reduce implied frequently used
words throughout the dataset. It gives greater weight
to the words through high or low frequencies inside
the text. The TF and IDF combination are commonly
referred to as TF − IDF. Following are the equation
gives a statistical representation of a word's weight in
a text in TF− IDF (Kandé et al. 2018).
𝑊
(
𝑑,𝑡
)
=𝑇𝐹
(
𝑑,𝑡
)
×log
𝑁
𝑑𝑓
(
𝑡
)
(1)
Where (𝑁) is the number of texts, and 𝑑𝑓(𝑡)
symbolizes the total number of text documents,
including the word (𝑡) in the dataset. The first term in
the formula enhances the recall, though the second
term increases the accuracy of word embedding. Even
if TF-IDF seeks to beat the frequent text words, it has
additional explanatory limits. Specifically, TF-IDF
will not consider the similarity among the
corresponding words because every word exists
individually given an index.
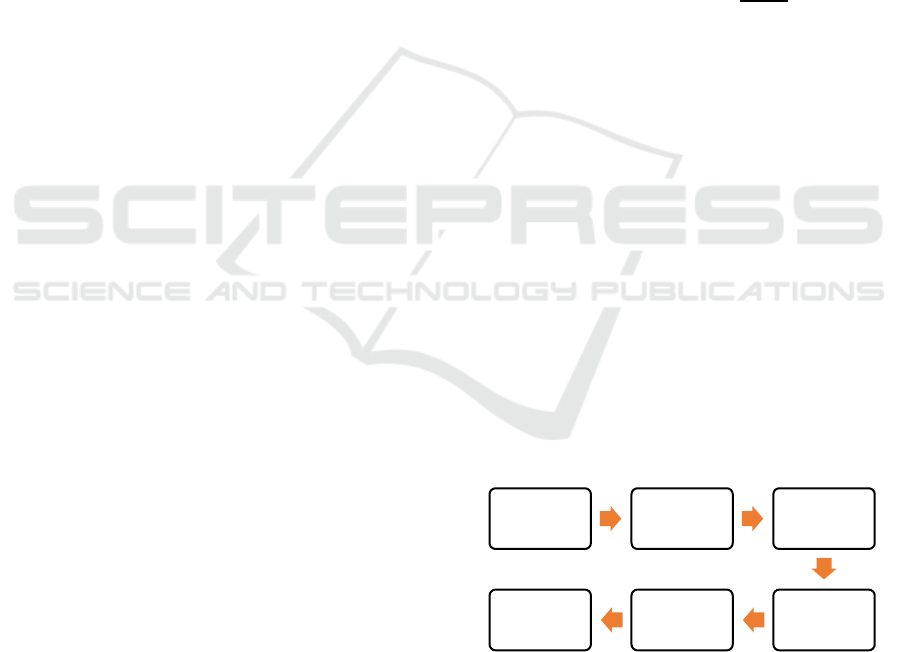
2.3 Text Classification Pipeline
Figure 1 represents the primary linear TC system
sequence. A typically followed pipeline to cope with
the TC problem is to learn the classifier's parameters
from collecting training texts along with known labels
and subsequently predicting the unlabeled texts.
(Verma, Goyal and Gigras 2020).
Figure 1: Basic text classification pipeline.
The first step in TC is to turn texts that describe
characters' strings into a representation appropriate
for the classification task and the learning algorithm.
The primary method is to use the spatial texts
representation by a vector space model.
Textual Data Preprocessing
Feature
Extraction
Dimensionality
Reduction
Text
Classification
Evaluation
ICAART 2022 - 14th International Conference on Agents and Artificial Intelligence
928

Then, a vector represents text through the n-
dimensional space, which a word from the whole
texts’ vocabulary resembled by dimension.
Let a collection of (𝑚) texts:
𝐷=
𝑑
,𝑑
,…,𝑑
And the words set in (𝐷) obtained by
tokenization, stop-words removal, lowercasing, noise
removal, stemming and lemmatization:
𝑇=
𝑡
,𝑡
,…,𝑡
Each text 𝑑
∈𝐷 is represented as a vector of
word:
𝑑
=𝑤
,
,𝑤
,
,…,𝑤
,
The weight word (k) is represented by 𝑤
,
in text
𝑑
. In this manner, text may be represented by the size
𝑚 × 𝑛 Text-Word matrix, in which the rows are
consistent with the texts and the columns to the
distinct set 𝑇 word features.
2.4 Dimension Reduction
Dimension reduction techniques may perhaps be
helpful due to the vast number of features. Latent
Semantic Analysis (LSA) in NLP is a method for
distribution semantics, analyzing links between a
collection of texts and the words they possess by
establishing a set of concepts linked to the texts and
words. (Kherwa and Bansal 2017).
LSA pretends to which the words near within the
meaning will appear in a similar text. A matrix
including word counts per text (rows correspond to
distinctive words and columns explaining every text)
is built from a more significant text portion. The
mathematical technique named "Singular Value
Decomposition (SVD)" is used to decrease rows
while maintaining the columns' similarity structure.
Texts are then compared by getting the cosine of an
angle among the two vectors created through two
columns. Values close on 1 are remarkably similar
texts, whereas values relative to 0 are different texts
(Al-Taani & Al-Sayadi, 2020).
The vector space model's main issue is locating
suitable weights used for the words inside a text.
When text is represented using the Bag-of-Words
model, every text is depicted as a multiset of its
words, order, and ignoring grammar. Inside this
model, the word's significance for a word is based on
its frequency (Eminagaoglu, 2020).
The word's weight inside the text will be based on
the 𝑡𝑓 (𝑡,𝑑) inside the text. Moreover, words that
frequently occur in a single text but not frequently
throughout the remainder of the texts are far more
expected to be suitable for the text subject. This is
referred to as the 𝐼𝐷𝐹 factor, and it can be calculated
by assuming the logarithm of the overall number of
texts divided on the total number of texts that contain
the word, as shown in the following:
𝑖𝑑𝑓
(
𝑡,𝐷
)
=log
𝑚+1
|
𝑑∈𝐷∶ 𝑡∈𝑑
|
(2)
(𝑚) indicates the overall count of texts in
collection (𝐷), and divided on the number of texts
that word 𝑡 appears.
𝑡𝑓 − 𝑖𝑑𝑓
(
𝑡,𝑑
)
=
1+ln1+ln𝑡𝑓
(
𝑡,𝑑
)
1−𝑏+𝑏 ×
|
𝑑
|
𝑎𝑣𝑒𝑟𝑎𝑔𝑒 𝑡𝑒𝑥𝑡 𝑙𝑒𝑛𝑔𝑡ℎ
×𝑖𝑑𝑓()
(
𝑡,𝐷
)
(3)
(𝑑) is the text's length. This scoring function
describes the hunches in which they are:
1. Most frequently in the word takes place in a text,
the more it represents its content.
2. The greater the texts a word appears in, the fewer
discriminating it becomes.
Make use of each word's TF-IDF score, the Text-
Word matrix weights can be filled.
2.5 Classification Models
It is the primary component of the TC. To every text
𝑑
∈ 𝐷 is related along with a label 𝑦
, that creates
the vector 𝑌. But the TC problem's aim is to classify
a collection of test texts into labels. Based upon this
formulation, the SVM classification algorithms could
be applied to classify the test texts.
3 RELATED WORKS
In previous literature, the authors used TC algorithms
to classify text. Below is a summary of the studies that
used graph-mining classifiers.
Joulin, Grave, Bojanowski, and Mikolov's (2016)
experiments showed that their fastText classifier is
usually on a level with deep learning classifiers. Its
classifier offers quicker data training and evaluation.
Liu, Qiu, and Huang (2017) proposed a TC using
a bi-directional long-term memory network, a type of
recurrent neural network that explicitly addresses
long-term dependencies.
Vaswani et al. (2017) proposed a simplistic graph
architecture based on the method of attention. Their
work shows these models to be more generous in
quality and need less time to train.
Shinde, Shaikh, and Thepade (2017), from their
experiments on Multinomial Naïve Bayes, SVM, and
Text Classification of English News Articles using Graph Mining Techniques
929
k-nearest neighbors algorithm on Reuters R8, the
result has shown that SVM performs better.
Wang et al. (2018) suggested TC can be
performed by converting a word into a joint
embedding. It indicates the attention framework that
measures the embedding compatibility among
different text arrangements and the tags.
Yao, Mao, and Luo (2019) used convolutional
graphs designed for TC. They made a one-text graph
for each word based upon its frequency, text
associations and later produce a text graph for the
dataset.
Haonan, Huang, Ye, and Xiuyan (2019)
introduced a graph star network, an innovative graph
neural network architecture that utilizes attention
mechanism and message-passing relay for graph
classification and link prediction.
Wu et al. (2019) examined the convolutional
graph network with their modifications, encountered
critical attention, and became the state-of-the-art
technique for learning graph representations.
Yao, Mao, and Luo (2019) represented TextEnt, a
neural network model which learns distributed
entities representations and documents straight from
a knowledge base.
Yamada and Shindo (2019) suggested a neural
attentive bag-of-entities model, a neural network
model that operates TC by utilizing a knowledge
base.
Pei et al. (2020) presented the application of the
scheme in graph convolutional networks, called
geometric graph convolutional networks, to perform
transudative learning on graphs.
Zhu et al. (2020) studied the power of graph
neural network representation in the semi-supervised
TC task in networks where connected text may have
several class labels and different features.
Yan et al. (2021) characterized the connections
between heterophily and over smoothing, both of
which lead to indistinguishable node representations
in graphs.
Zhu and Koniusz (2021) proposed graph
convolutional networks that have drawn significant
attention and become promising methods for learning
graph representations.
4 PROPOSED METHODS
As previously discussed, Bag-of-Word's
representation of texts' subsequent scoring does not
preserve data about the words' position and ordering
in the text. Even though the N-gram model will be
used, information on the relation among the two
separate N-grams will be neglected.
The suggested graph-based text representation
model and its effectiveness in the English news TC
will be reviewed. Also, an overview and details of the
proposed technique will be provided regarding:
1. How to turn a text into a graph
2. How to weigh and the significance of words
under this model.
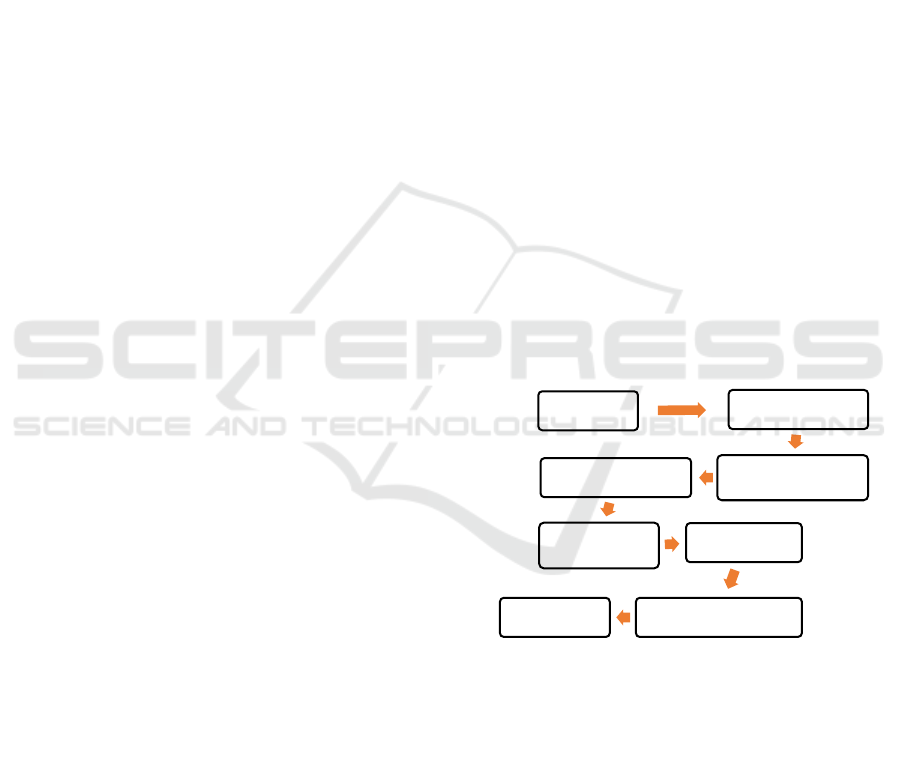
4.1 Proposed Text Classification
Method
The suggested approach for English news articles TC
is following the general TC pipeline outlined in
Figure 1. The main contribution will be to the way the
words in texts are weighed. Rather than utilizing word
frequency criteria, creating a graph-based technique
that describes co-occurrent relations among a text's
words and preserves the text's structural information
to enhance the English news articles TC. Figure 2
illustrates the proposed text classification technique.
The algorithm below illustrates the steps required
for the suggested representation as well as the
weighting method. The exact graph-based text
representation and the weighting method are used
throughout both the train and test collection in a
dataset.
Figure 2: Proposed text classification process.
Algorithm 1: Proposed Text Representation Algorithm.
SET D to Collection of Texts
SET T to Dictionary of Words
FOR each text in D
Create a graph for text G = (V, E)
Vertex v corresponds to a word t
IF Word u AND Word v occurred in same window
of size W
Add Edge e = (u, v)
FOR each word in T
Compute word wight based on word
degree score in graph G
Fill Text-Word matrix
END FOR
Textual Data
Pre-Processing and
Text Preparation
Convert to Graph-of-
Words
Feature extraction
using TW-IDF
Text
Classification
Dimensionality
Reduction
Text Classification
using SVM
Evaluation
ICAART 2022 - 14th International Conference on Agents and Artificial Intelligence
930

4.2 Graph Construction
A graph represents every text document in a dataset.
This method is called the Graph-of -Words model. As
stated earlier, the Graph-of-Words remains a separate
text representation method that describes word
relations and challenges word independence. Broadly
speaking, a graph 𝐺 = (𝑉,𝐸) represents each text
𝑑 ∈ 𝐷 in which the vertices relate to the words (𝑡)
of the text, and the edges encapsulate co-occurrence
relationships between the words inside a fixed size
(𝑤) sliding window.
Despite the words that cooccur through the
window, edges are added among the corresponding
vertices. The windows overlap from the first word of
the text; in every step, only the first word is removed,
and the new one from the text is added. The graphs
represent rich developing structures, so the parameters
regarding the creation phase require to be detailed.
4.2.1 Directed and Undirected Graph
The graph-of-words model has several parameters,
one of them is whether the text's graph representation
will be directed or undirected. Directed graphs can
maintain the same text flow; however, in undirected
graphs, the occurrence of two words represented by
an edge, no matter what the respective order among
them is. This study is needed to assess which
representation is more suitable for the English news
article TC.
4.2.2 Weighted and Unweighted Graph
The text representation in the suggested graph-based
model can be weighted or unweighted. In weighted
graphs, the higher occurrences of two words in the
text, the greater the corresponding edge's weight as its
weight shall be equal to the occurrences of the vertex.
On the other hand, the graph can be considered
unweighted. The initial experiments in the next
chapter concentrated on graphs that are unweighted
owing to the minimalism of the model.
4.2.3 SLIDING Window of Size (𝒘)
As mentioned before, under the graph-of-words
model, edges were added among the words that take
place within a size (𝑤) sliding window. The size of
the window is one of the parameters. The experiment
window of size (𝑤 = 3) was considered because
this was doing good in contrast with other values.
Though expanding the window size could catch
occurrence connections within not certainly nearby
words, a dense graph will be constructed.
4.3 Word Weighting Criteria
Once the graph is created for every text, the word
weighing process will proceed. The TF-IDF criterion
forms the basis for weighting every text's word If the
text is expressed by the Bag-of-Words model.
However, the graph-of-words model is using the
graph vertex degree criteria weighting. In that
manner, the word's significance in a text can be
implied by the equivalent vertex reputation in the
graph. Through the graph analysis domains and
theory, numerous vertex degree criteria can be
suggested.
A critical attribute of such models is that they use
vertex weighting schemes based on graph properties
such as centrality, weighted degree, clustering
coefficient, or more graph features. Due to the
significance of the vertices, their global properties in
the graph are considered, such as eigenvector,
PageRank, closeness, and betweenness centrality.
4.4 Degree Centrality
It is a local criterion representing one of the most
specific vertex significance criteria, taking the
neighbors to count every vertex has. It allows 𝑁(𝑖) to
be the collection of vertices linked to the vertex (𝑖).
Later, the degree centrality can be determined upon
the next formula:
𝑑𝑒𝑔𝑟𝑒𝑒 𝑐𝑒𝑛𝑡𝑟𝑎𝑙𝑖𝑡𝑦
(
i
)
=
|
𝑁
(
𝑖
)|
|
𝑉
|
− 1
(4)
4.4.1 In-degree and out-Degree Centrality
For a vertex, "the number of incoming edges ends
adjacent to a vertex" is called the indegree of the
vertex, and "the number of outgoing ends adjacent to
a vertex" is its outdegree (Zhao, R., & Mao, K., 2018).
Both measures represented in directed graphs with
degree centrality.
4.4.2 Closeness Centrality
For a vertex, "the number of incoming edges ends
adjacent to a vertex" is called the indegree of the
vertex, and "the number of outgoing ends adjacent to
a vertex" is its outdegree. (Barberá et al. 2020) Both
measures are represented in directed graphs with
degree centrality.
Let 𝑑𝑖𝑠𝑡𝑎𝑛𝑐𝑒(𝑖,𝑗) be the shortest path distance
among the vertices in the (𝑖) and (𝑗), a vertex (i)
closeness centrality will be calculated as it is shown
in the following:
Text Classification of English News Articles using Graph Mining Techniques
931
𝑐𝑙𝑜𝑠𝑒𝑛𝑒𝑠𝑠
(
𝑖
)
=
|
𝑉
|
− 1
∑
𝑑𝑖𝑠𝑡𝑎𝑛𝑐𝑒
(
𝑖,
𝑗
)
∈
(5)
The closeness score remains a metric as it
combines information from all the graph vertices.
Here, the closeness centrality is computed into the
undirected graph.
The centrality criteria mentioned above are
bounded and represent just the ones applied in the
evaluation of experiments. More centrality criterion
can be applied to weigh words for the English news
articles TC.
Once a centrality criterion has been selected,
𝑡𝑤(𝑡,𝑑) can be allocated to the word in a text. This
weighting scheme is known as word weight.
Moreover, this weighting criterion can be extended
by considering the word (𝑡) inverse document
frequency in the set (𝐷). In that manner, the word
weight-inverse document frequency (TW-IDF)
model can be driven to look like the following:
𝑡𝑤 − 𝑖𝑑𝑓
(
𝑡,𝑑
)
=
𝑡𝑤
(
𝑡,𝑑
)
1−𝑏+𝑏×
|
𝑑
|
𝑎𝑣𝑔 𝑡𝑒𝑥𝑡 𝑙𝑒𝑛𝑔𝑡ℎ
×𝑖𝑑𝑓
(
𝑡,𝐷
)
(6)
Last, a crucial point relates to the selected
centrality criteria computational complexity. As
expected, various requirements are practical to be
calculated, like degree centrality, whereas others not.
This the potential trade among classification accuracy
and complexity of calculating the features is equally
significant because it can influence the performance
of the English news articles TC.
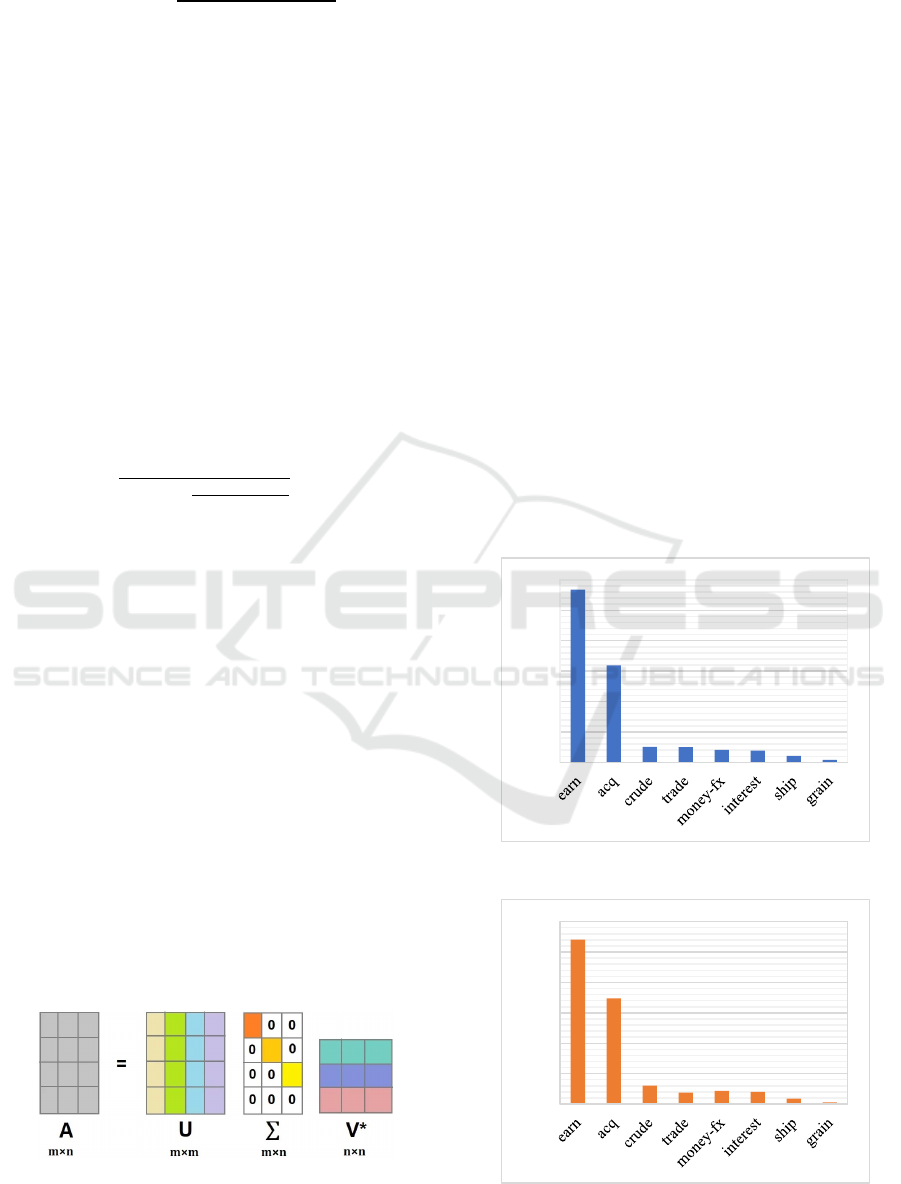
4.5 Dimensionality Reduction
An essential preprocessing phase in any classification
mission is dimension reduction. As discussed
previously, dimensionality reduction may be applied
in the Word-Text matrix such as LSA. Though, it will
be attractive to that dimensionality reduction
extended to a text graph. In the experiments, the SVD
factors a single matrix into the matrix U, D, and V.
Were, U, and V are orthogonal matrices. D is a
singular value diagonal matrix, as shown in Figure 3.
Figure 3: Singular value decomposition.
4.6 Experimental Evaluation
The next paragraphs present the initial graph-based
word weighting criteria experimental evaluation for
English news articles TC. Before delivering the
findings, the data sets used throughout the research
and the experimental setup will be described.
4.6.1 Description of the Datasets
Experiments were conducted with the R8, and
WebKB datasets. The R8 collection texts are in line
with news articles that showed up on the Reuters
news channel throughout 1987. Besides, the WebKB
dataset relates to academic web pages that fit into four
distinctive classes. The datasets are available online
in “https://ana.cachopo.org/datasets-for-single-label-
text-categorization”
Both datasets are broken into the training and testing
components, 70% as training and 30% as a testing set.
Figure 4, Figure 5, Figure 6, and Figure 7 provide
detailed information on the datasets. A definitive
evaluation of the technique is performed on the
testing text documents, and the objective will be to
predict the classes.
Figure 4: Training documents of the R8 dataset.
Figure 5: Testing documents of the R8 dataset
2840
1596
253
251
206
190
108
41
0
500
1000
1500
2000
2500
3000
1083
696
121
75
87
81
36
10
0
200
400
600
800
1000
1200
ICAART 2022 - 14th International Conference on Agents and Artificial Intelligence
932
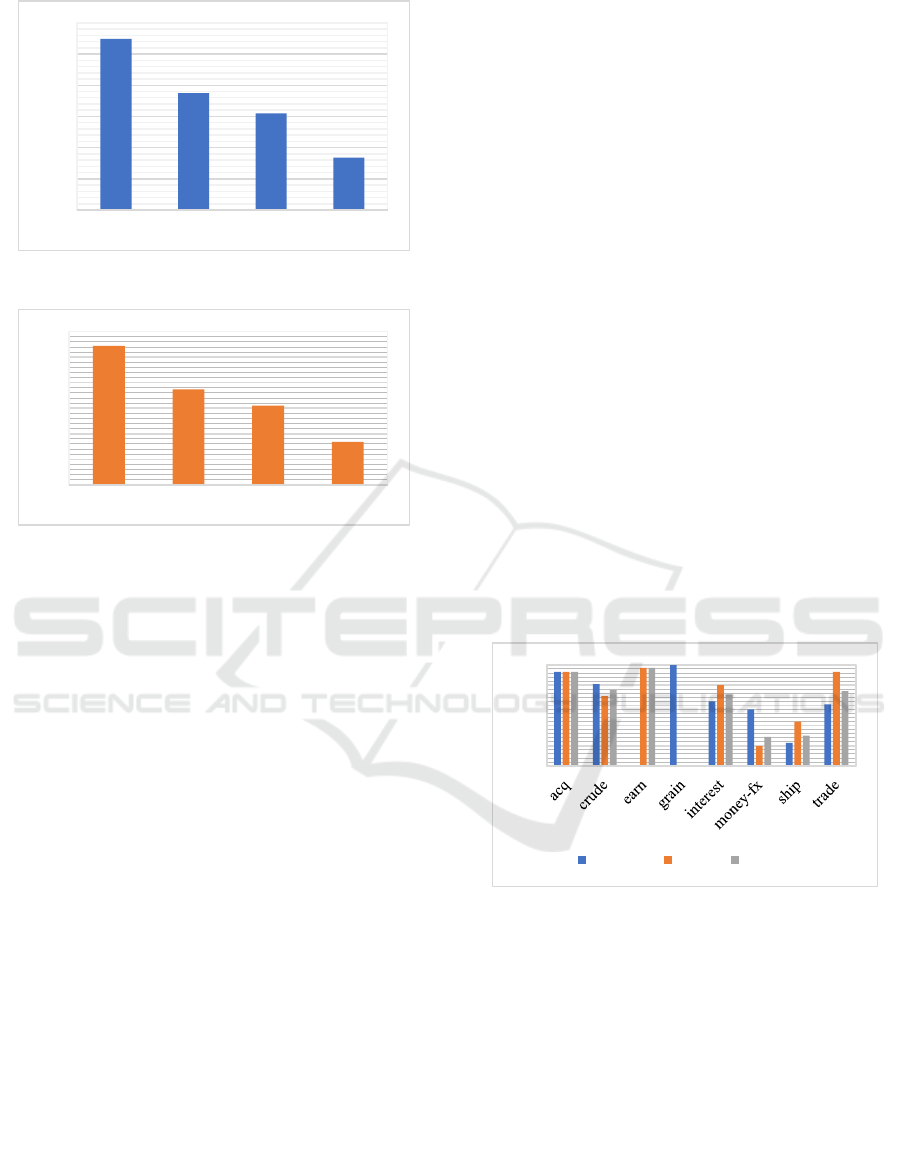
Figure 6: Training documents of the WebKB dataset.
Figure 7: Testing documents of the WebKB dataset.
The datasets are given here (both Train and Test)
have been preprocessed and cleaned using the criteria
presented in section 4.3.
4.6.2 Experimental Tools and Setup
The suggested graph-based word weighting criteria in
the algorithm were developed in Python programing
language utilizing the GowPy library. The SVM
algorithms with linear support vector classification
and dimensionality reduction using truncated SVD
have been used in the sci-kit-learn library on the
classification model.
Initial experiments were conducted in Google
Colab notebooks, an interactive environment that
allows the writing and execution of programming
codes. Classifications will be performed on top of the
testing text documents in datasets after training the
train collection in the classification model. The TC
model performance is evaluated using accuracy,
precision, recall, and f1-score performance metrics.
Moreover, the classification scores were reported for
every category of the datasets.
The proposed technique is being compared versus
the bag-of-words model that uses the TF-IDF scores.
The window size 𝑤 was set to 3 in the
experimentation since it consistently produces
satisfactory results.
4.6.3 Text Cleaning and Pre-processing
Most text datasets include useless words like stop
words, misspellings, and slangs. In various
probabilistic learning and statistical algorithms, noise
and excessive characteristics can negatively affect TC
performance. Tokenization, stop word removal,
lowercasing, noise removal, Stemming, and
lemmatization techniques were used for text
cleansing and dataset text preprocessing.
5 RESULTS
Preliminary experiments were reported concerning
the performance of the graph-based word weighting
criteria. While the Bag-of-Words model performs
well for the R8, it is mainly involved in examining the
abilities of the proposed model to attain results near
to or better than the ones of bag-of-words and
benchmark with other solutions.
5.1 R8 Dataset Results
The following paragraph are reporting the
experiments results for R8 dataset using the TF-IDF
model and TW-IDF Model.
Figure 8: Precision, recall, and f1-score for TF-IDF in R8
dataset.
The Figure 8 illustrates the comparison between
precision, recall and f1-score in R8 dataset TC. It is
measured in percentages. At the precision scale, the
acq class has the highest precision, whereas earn class
has the highest recall and f1-score.
The graph in Figure 9 shows the macro average
which compute the metric independently for each
class and then take the macro as well as the weighted
average that considers the varying degrees of
importance of the numbers in R8 dataset of TF-IDF
Model.
1097
750
620
336
0
200
400
600
800
1000
1200
student faculty course project
544
374
310
168
0
100
200
300
400
500
600
student faculty course project
0,00
0,20
0,40
0,60
0,80
1,00
Percision Recall F1-score
Text Classification of English News Articles using Graph Mining Techniques
933
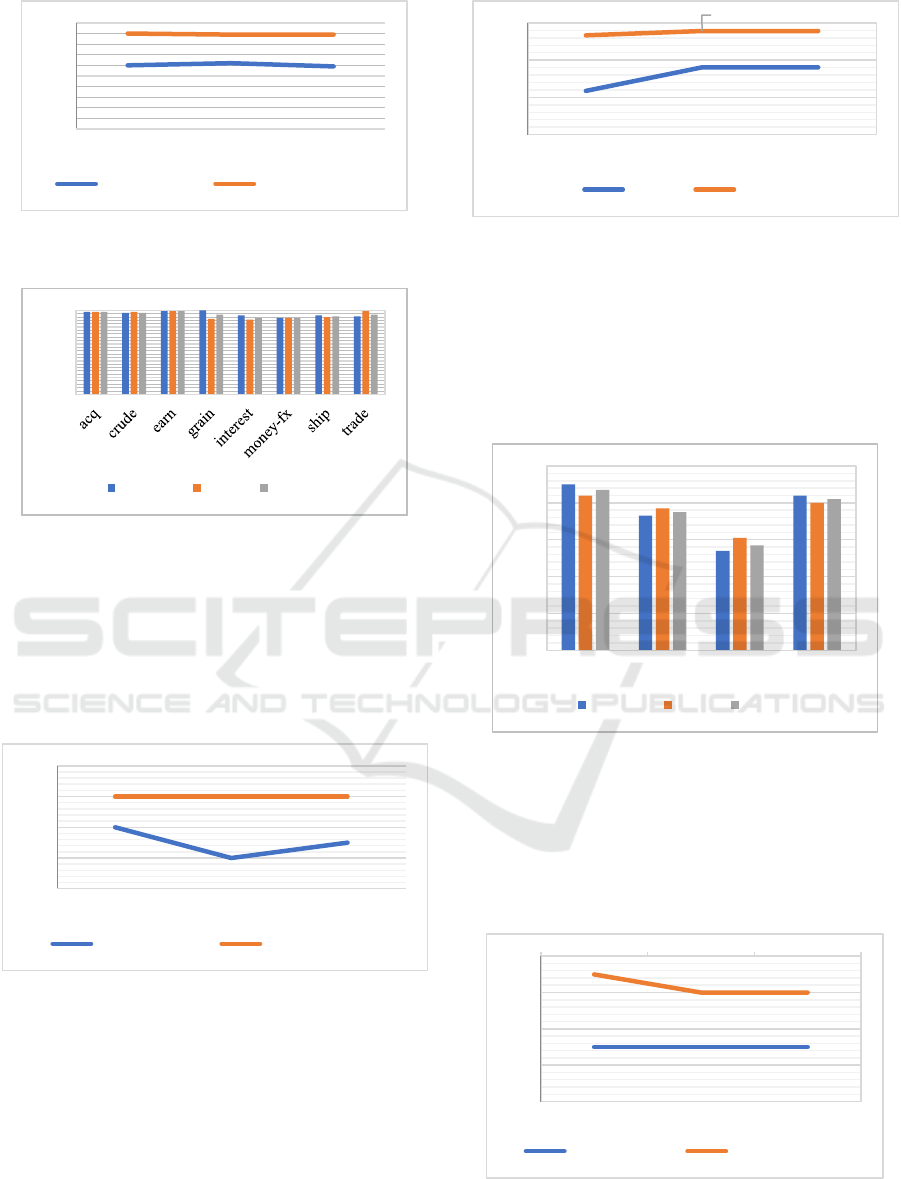
Figure 9: Macro and weighted average of TF-IDF model in
R8 datatset.
Figure 10:
Precision, recall, and f1-Score for TW-IDF in R8
dataset.
The Figure 10 illustrates the comparison between
precision, recall and f1-score in R8 dataset for TC
using TW-IDF Model. It is measured in percentages.
At the precision scale, the earn has the highest
precision, whereas earn and trade class has the highest
recall and earn has the highest f1-score.
Figure 11:
Macro and weighted average of TW-IDF model
in R8 dataset.
The graph in Figure 11 shows the macro average,
which measures the metric independently for every
class and then uses the average and weighted average
that reflects the different degrees of the significance
of the numbers in R8 dataset using TW-IDF Model.
The graph in Figure 12 illustrate the superior
performance of TW-IDF over TF-IDF Model in
various performance metrics in R8 dataset.
Figure 12: Matthews’s correlation coefficient (MCC),
accuracy and f1-micro for TF-IDF and TW-IDF in R8
dataset
5.2 WebKB Dataset Results
The following paragraph are reporting the
experiments results for WebKB dataset using the TF-
IDF model and TW-IDF Model.
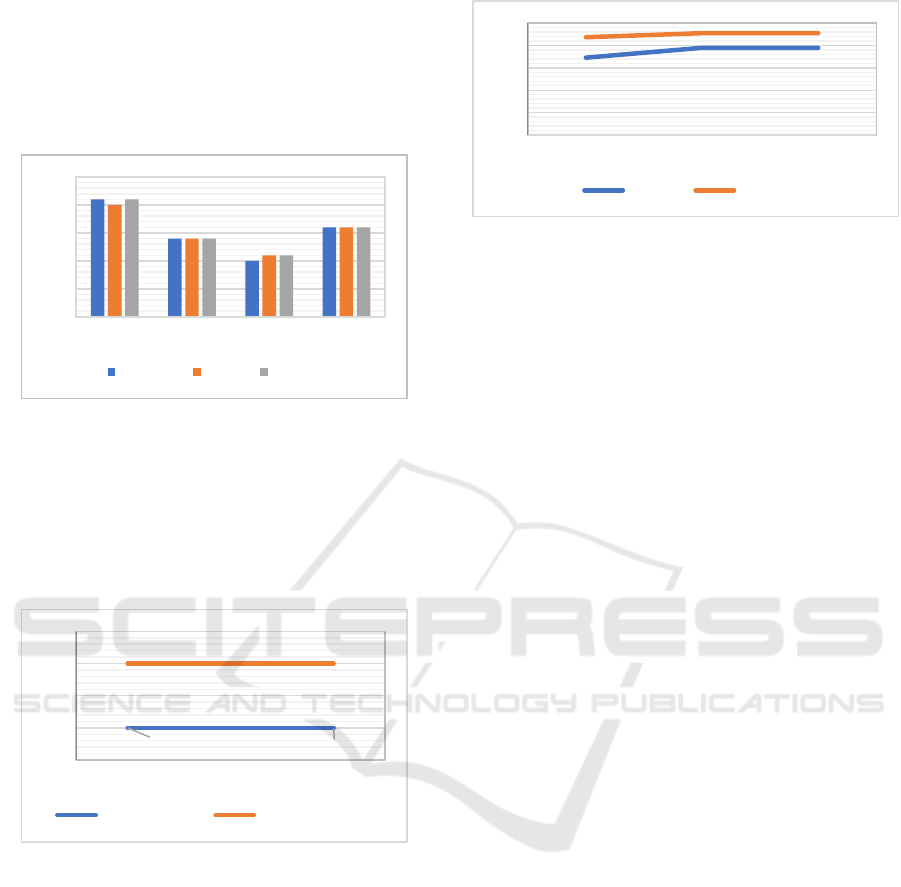
Figure 13: Matthews’s correlation coefficient (MCC),
accuracy and f1-micro for TF-IDF and TW-IDF in WebKB
dataset.
The Figure 13 illustrates the comparison between
precision, recall and f1-score in WebKB dataset TC.
It is measured in percentages. At all scales, the course
class has the highest precision recall and f1-score.
Figure 14: Macro and weighted average of TF-IDF model
in WebKB dataset.
0,60
0,62
0,59
0,90
0,89
0,89
0,00
0,50
1,00
Precision Recall F1-score
Macro Average Weighted Average
0,00
0,20
0,40
0,60
0,80
1,00
Percision Recall F1-score
0,96
0,94
0,95
0,98 0,98
0,98
0,92
0,94
0,96
0,98
1,00
Precision Recall F1-score
Macro Average Weighted Average
0,82
0,88
0,88
0,97
0,98
0,98
0,70
0,80
0,90
1,00
MCC Accuracy F1-micro
TF-IDF TW-IDF
0,00
0,20
0,40
0,60
0,80
1,00
course faculty project student
Percision Recall F1-score
0,75
0,75
0,75
0,79
0,78 0,78
0,72
0,74
0,76
0,78
0,80
Precision Recall F1-score
Macro Average Weighted Average
ICAART 2022 - 14th International Conference on Agents and Artificial Intelligence
934
The graph in Figure 14 shows the macro average,
which measures the metric independently for every
class and then uses the average and weighted average
that reflects the different degrees of the significance
of the numbers in WebKB dataset of the TW-IDF
Model.
Figure 15: Precision, recall, and f1-score for TW-IDF in
WebKB dataset.
The Figure 15 illustrates the comparison between
precision, recall and f1-score in WebKB dataset for
TC using TW-IDF Model. It is measured in
percentages. At all scales, the course class has the
highest precision, recall and f1-score.
Figure 16: Macro and weighted average of TW-IDF model
in WebKB.
The graph in Figure 16 shows the macro average,
which measures the metric independently for every
class and then uses the average and weighted average
that reflects the different degrees of the significance
of the numbers in WebKB dataset of the TW-IDF
Model.
The graph in Figure 17 illustrate the superior
performance of TW-IDF over TF-IDF Model in
various performance metrics in WebKB dataset.
Previous figures present the preliminary findings.
For each case, it is interested in comparing the
performance of the TW-IDF model to the one of TF-
IDF, applying the vertices degree criteria shown
above. As noted, the suggested weighting schemes
Figure 17: Matthews’s correlation coefficient (MCC),
accuracy and f1-micro for TF-IDF and TW-IDF in WebKB
dataset.
generated by the graph-of-words model work well
and, in various cases, beat the TF-IDF model. This is
primarily visible and observed in the R8, R52, and
WebKB dataset that it improves the accuracy and F1-
score results.
Moreover, in the R8, and WebKB datasets, the
most reliable results were obtained using the TW-IDF
scheme by vertex degree centrality. Even though it is
deemed only a handful of parameter space settings,
the best performance in used datasets was obtained by
applying the degree centrality in the undirected graph.
Furthermore, bag-of-words and graph-of-words
weighting schemes' performance was compared for
each category of the datasets. The figures in the
previous sections report the TW-IDF and TF-IDF
results for every dataset. In every case, degree
centrality was used for the graph-of-words weighting
schemes.
As observed, for R8 and R52 datasets, the graph-
of-words model performance is remarkably near one
of the bag-of-words weighting techniques where IDF
normalization was applied; the TW-IDF scheme
works better than TF-IDF, particularly in small size
categories. For the case of the WebKB dataset, in
nearly every category, TW-IDF considerably
outperforms the weighting techniques.
5.3 Evaluation Benchmarks
Benchmarking is the methodology of comparing the
proposed solution with respect to a certain
performance measure. The benchmarking process
abstractly will compare the proposed solution to the
recent available solution.
5.3.1 R8 Dataset Benchmarking
In Figure 18, the red bar represents the proposed
models. The blue bars depict the top eight recent
models. According to the chart, the TW-IDF Model
0,75
0,80
0,85
0,90
0,95
1,00
course faculty project student
Percision Recall F1-score
0,90
0,90
0,90
0,91 0,91 0,91
0,90
0,90
0,91
0,91
0,92
Precision Recall F1-score
Macro Average Weighted Average
0,69
0,78 0,78
0,87
0,91
0,91
0,00
0,20
0,40
0,60
0,80
1,00
MCC Accuracy F1-micro
TF-IDF TW-IDF
Text Classification of English News Articles using Graph Mining Techniques
935
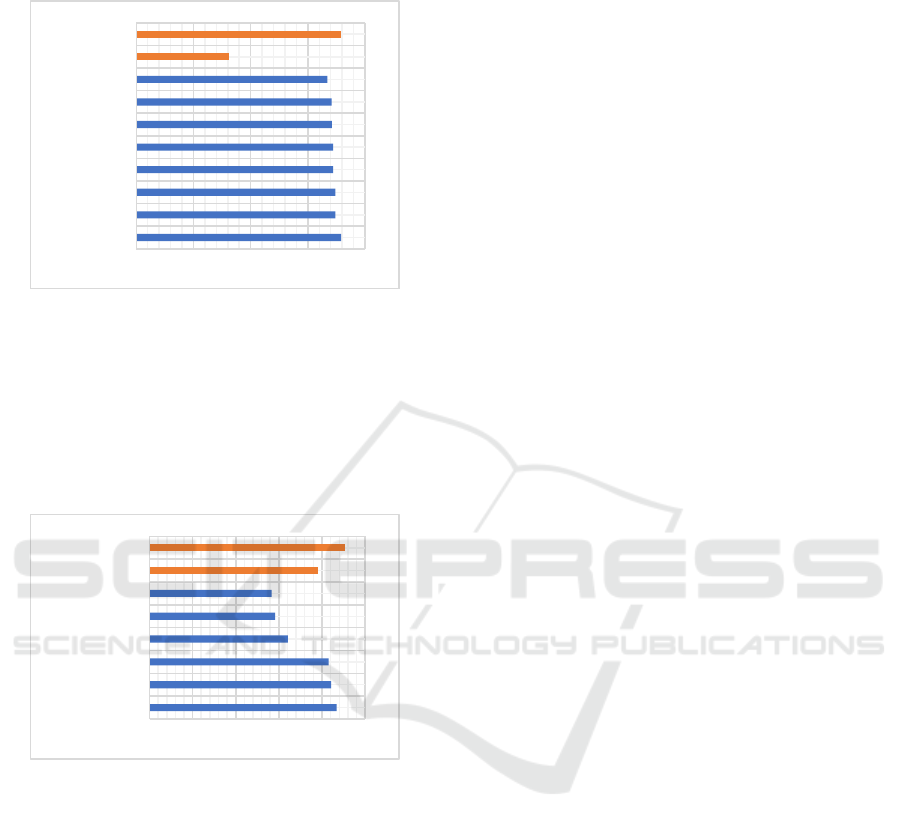
and NABoE-full has the greatest accuracy with
97.9%.
Figure 18: Benchmarking with different available models
on R8 dataset.
5.3.2 WebKB Dataset Benchmarking
In Figure 19, the red bar represents the proposed
models. The blue bars depict the top eight recent
models. According to the chart, the TW-IDF Model
has the greatest accuracy with 90.9%.
Fig
ure 19: Benchmarking with different available models
on WebKB dataset.
6 DISCUSSION
One of this research objectives was to propose a
graph-mining model that improves TC accuracy. The
basic idea is to introduce each text as a graph and
measure the occurrence of words. The significance of
a word to a text could be defined using vertex
centrality criteria, like closeness and degree
centrality. An initial experimental assessment was
carried out. The results have been reassuring
concerning implementing the suggested word
weighting schemes to the English news articles TC.
Because of the graph's rich modeling
characteristics, multiple parameters must be defined
for the text. Although a more evident parameter's
space exploration must have a more detailed picture
of this model's abilities, a tiny portion has been
considered.
6.1 Parameter's Space Exploration
As mentioned previously, there are many techniques
to build a graph from the text, like consider a directed
graph or an undirected graph. Also, several criteria
for vertices centrality could be used to weigh the
words relying upon graph building. A comprehensive
exploration of the parameters space will provide more
particular perspicacity into this method's ability to
overtake the scoring functions within the English
news articles TC context, and the initial findings
support this argument.
6.2 Inverse Collection Weight
The TF factor inside the TF-IDF scheme, which is the
frequency of every word in the text, is punished by
the IDF factor, which is the number of text documents
where it appears. The word weight was simply
penalized according to the bag-of-words model's IDF
factor through the experiments. For instance, a graph
from all text may be created and consider the vertices
degree centrality at the graph collections.
7 CONCLUSION
In this research, a graph-mining technique has been
proposed for the English news article TC. The
proposed approach applies TC on Reuters R8, and
WebKB datasets, well-known datasets used in the
research community. The collected datasets are used
to categorize a collection of texts based on their
classes from an existing set of predefined classes in
an automated process using a supervised machine
learning approach. Several preprocessing steps have
been implemented to the extracted data set to
recognize the essential words in the dataset. These
preprocessing include tokenization, stop-words
removal, lowercasing, noise removal, stemming, and
lemmatization.
In the classification phase, different parameter
space settings were reviewed for the graph mining
technique to obtain the best classification accuracy.
Various parameter settings for graph mining and
extensive testing were conducted to find the best
settings based on initial experiments. Depending on
the model evaluation metrics (precision, recall, f1-
score, and accuracy), suitable parameters were
97,9
97,4
97,4
97,2
97,2
97,1
97,1
96,7
88,1
97,9
80 85 90 95 100
NABoE-full
GraphStar
SSGC
SGC
SGCN
NABoE-full
Text GCN
TextEnt-full
TF-IDF
TW-IDF
86,9
84,3
83,1
64,1
58,2
56,7
77,9
90,9
0 20406080100
GGCN
H2GCN-1
H2GCN-2
Geom-GCN-P
Geom-GCN-I
Geom-GCN-S
TF-IDF
TW-IDF
ICAART 2022 - 14th International Conference on Agents and Artificial Intelligence
936

identified. The obtained accuracy was superior,
which is the best accuracy obtained for R8, and
WebKB datasets.
7.1 Recommendation for Future
Studies
Future research is intended to apply the suggested
technique with many queries and a large text
documents dataset. The research further provides a
basis for a prospective study that will explore the
impact of adjacent words inside a sentence and words
that show up in consecutive sentences to deal with
them separately when the minimum distance is to be
calculated. Also, an exploration in the technique
parameter's space may yield improved TC accuracy.
REFERENCES
Al-Taani, A., & Al-Sayadi, S. (2020). Classification of
Arabic Text Using Singular Value Decomposition and
Fuzzy C-Means Algorithms. Algorithms For Intelligent
Systems, 111-123. doi: 10.1007/978-981-15-3357-0_8
Automated Machine Learning. (2019). The Springer Series
on Challenges in Machine Learning. doi: 10.1007/978-
3-030-05318-5
Baker, S., & Korhonen, A. (2017). Initializing neural
networks for hierarchical multi-label text classification.
Bionlp 2017. doi: 10.18653/v1/w17-2339
Barberá, P., Boydstun, A., Linn, S., McMahon, R., &
Nagler, J. (2020). Automated Text Classification of
News Articles: A Practical Guide. Political Analysis,
29(1), 19-42. doi: 10.1017/pan.2020.8
Eminagaoglu, M. (2020). A new similarity measure for
vector space models in text classification and
information retrieval. Journal Of Information Science,
016555152096805. doi: 10.1177/0165551520968055
HaCohen-Kerner, Y., Miller, D., & Yigal, Y. (2020). The
influence of preprocessing on text classification using a
bag-of-words representation. PLOS ONE, 15(5),
e0232525. doi: 10.1371/journal.pone.0232525
Hartmann, J., Huppertz, J., Schamp, C., & Heitmann, M.
(2019). Comparing automated text classification
methods. International Journal of Research in
Marketing, 36(1), 20-38. doi: 10.1016/j.ijresmar.20
18.09.009
Kandé, D., Marone, R., Ndiaye, S., & Camara, F. (2018). A
Novel Term Weighting Scheme Model. Proceedings Of
The 4Th International Conference on Frontiers of
Educational Technologies - ICFET '18. doi: 10.1145/
3233347.3233374
Kherwa, P., & Bansal, P. (2017). Latent Semantic Analysis:
An Approach to Understand Semantic of Text. 2017
International Conference on Current Trends in
Computer, Electrical, Electronics and Communication
(CTCEEC). doi: 10.1109/ctceec.2017.8455018
Kowsari, Jafari Meimandi, Heidarysafa, Mendu, Barnes, &
Brown. (2019). Text Classification Algorithms: A
Survey. Information, 10(4), 150. doi: 10.3390/info10
040150
Machine Learning and Knowledge Discovery in Databases.
Applied Data Science and Demo Track. (2021). Lecture
Notes in Computer Science. doi: 10.1007/978-3-030-
67670-4
Mukherjee, I., Sahana, S., & K. Mahanti, P. (2017). An
Improved Information Retrieval Approach to Short
Text Classification. International Journal of
Information Engineering and Electronic Business, 9(4),
31-37. doi: 10.5815/ijieeb.2017.04.05
Sarkar, D. (2019). Text Analytics with Python. doi:
10.1007/978-1-4842-4354-1
Sokolova, M. (2017). Big Text advantages and challenges:
classification perspective. International Journal of
Data Science and Analytics, 5(1), 1-10. doi:
10.1007/s41060-017-0087-5
Thangaraj, M., & Sivakami, M. (2018). Text Classification
Techniques: A Literature Review. Interdisciplinary
Journal of Information, Knowledge, And Management,
13, 117-135. doi: 10.28945/4066
Torres-Carrion, P., Gonzalez-Gonzalez, C., Aciar, S., &
Rodriguez-Morales, G. (2018). Methodology for
systematic literature review applied to engineering and
education. 2018 IEEE Global Engineering Education
Conference (EDUCON). doi: 10.1109/educon.2018.83
63388
Verma, P., Goyal, A., & Gigras, Y. (2020). Email phishing:
text classification using natural language processing.
Computer Science and Information Technologies, 1(1),
1-12. doi: 10.11591/csit.v1i1.p1-12
Zhao, R., & Mao, K. (2018). Fuzzy Bag-of-Words Model
for Document Representation. IEEE Transactions on
Fuzzy Systems, 26(2), 794-804. doi: 10.1109/tfuzz.20
17.2690222
Text Classification of English News Articles using Graph Mining Techniques
937
