
A New Way to Characterize Learning Datasets
C
´
elina Treuillier
1,2
and Anne Boyer
1,2
1
Lorraine University, 34 Cours L
´
eopold, 54000 Nancy, France
2
LORIA, 615 Rue du Jardin Botanique, 54506 Vandoeuvre-l
`
es-Nancy, France
Keywords:
Learning Analytics, Corpus Representativeness, Learning Indicators, Learner Personas.
Abstract:
The student’s interaction with Virtual Learning Environments (VLE) produces a large amount of data, known
as learning traces, which is commonly used by the Learning Analytics (LA) domain to enhance the learning
experience. Digital learning systems are generally based on the processing of these traces and must be able
to adapt to different student profiles. However, the information provided in raw traces is diversified and
can’t be directly used for the profile identification task: it requires defining learning indicators pedagogically
relevant, and measurable directly from learning traces, and then classify learners profiles according to these
indicators. The paper’s main contribution remains on the characterization of LA datasets both in terms of
groups sizes and observed digital behaviors. It answers the lack of clearly stated information for LA systems
developers, who need to ensure that their algorithms do not introduce bias, especially by disfavoring specific
categories of students, which would only worsen existing inequalities in the student population. To go further,
the embodiment of these identified profiles by translating them into learner personas also participates in the
improvement of the explicability of LA outcomes by providing easy-to-interpret descriptions of students.
These personas consist of fictitious representative student profiles, expressing different needs and learning
objectives to which the LA systems must respond.
1 INTRODUCTION
The intensified use of Learning Analytics (LA) has
led to a significant shift in learning: learners can par-
ticipate in a specific course from anywhere and at any
time. While attending different courses online, learn-
ers produce a large amount of data, known as learn-
ing traces, which are commonly processed by several
algorithms to understand learning and potentially im-
prove it (Siemens and Long, 2011). These traces can
be very diverse, and reflect the student’s behaviors on
the learning platform.
Obviously, not all students engage in similar be-
haviors, both in distance and face-to-face courses and
thus need to receive adapted and quality support (Xu
and Jaggars, 2014). All students must be accompa-
nied and supported in their learning tasks, and none
should be privileged or, on the contrary, disadvan-
taged.
These notions of adaptability and equity are es-
sential and need to be insured when dealing with LA
systems (Slade and Prinsloo, 2013). These last learn
from learning traces to provide results that will help
actors in their decision-making to improve learning.
However, the heterogeneous nature of the data, cou-
pled with the diversity of behavior of each student,
makes the task tricky: it requires identifying distinct
learning behaviors, allowing the description of learn-
ing profiles, and this directly from the learning traces.
Hence, we ask ourselves how to characterize learn-
ing dataset in terms of representativity of learn-
ing profiles? (RQ1) We hypothesized that a new and
complete description of the dataset could participate
in the reduction of inequalities that persist in distance
learning by giving important clues to LA actors, and
in particular to systems’ developers who implement
algorithms processing the diverse data. Finally, this
complete characterization of the datasets can pretend
to participate in the generalization of fair learning,
which is adapted and accessible to all students. In-
deed, this could ensure that LA solutions are adapted
to the different student profiles identified and that they
do not introduce any bias.
However, before we can imagine improving on-
line learning, we must ensure that the results provided
are understandable and accepted by LA actors. In this
regard, we wondered how to improve the explicabil-
ity of the identified learning profiles? (RQ2) We
Treuillier, C. and Boyer, A.
A New Way to Characterize Learning Datasets.
DOI: 10.5220/0010982500003182
In Proceedings of the 14th International Conference on Computer Suppor ted Education (CSEDU 2022) - Volume 2, pages 35-44
ISBN: 978-989-758-562-3; ISSN: 2184-5026
Copyright
c
2022 by SCITEPRESS – Science and Technology Publications, Lda. All rights reserved
35

thought that the translation of the identified learning
profiles in a narrative and comprehensible form is es-
sential to make sure that all the potential users can
understand the results, measure the importance of the
computed indicators, and act accordingly.
This work is part of the LOLA (Laboratoire Ou-
vert de Learning Analytics) project, which aims at set-
ting up a collaborative platform on which the differ-
ent LA actors will be able to share datasets, models,
and results. To complete its offer, the platform pro-
poses a complete evaluation environment that relies
on the use of indicators, both technical, algorithmic,
and pedagogical. The work presented then partici-
pates in the elaboration of this environment.
The paper is organized as follows. Section 2
presents key concepts on which the presented work is
based. The methodology applied to identify the learn-
ing profiles as well as the associated results are pre-
sented in Section 3. The translation of these results in
a narrative and understandable form is then presented
in Section 4. Finally, Section 5 presents conclusions
and some interesting perspectives.
2 RELATED WORKS
2.1 Learning Styles
The learning process relies on cognitive foundations,
which are essential to the acquisition of complete
knowledge, allowing learners to interact with their
environment. The french neuroscientist (Dehaene,
2013) described four pillars of learning :
• Attention: brain’s mechanisms allowing the se-
lection of information on which the student needs
to focus.
• Active Engagement: active pedagogy avoiding
wandering of the mind and thus supporting the
adoption of an active behavior toward the learn-
ing task.
• Information Feedback: feedback in the form of
error signals, essential for efficient learning.
• Daily Consolidation: storage of received infor-
mation, on a regular basis.
These various concepts result in the adoption of
diverse learning behaviors allowing to receive and
to process the information. Students present differ-
ent strategies to deal with a large amount of infor-
mation they receive every day, and some are more
adapted and beneficial than others. In this context,
many frameworks, based on different observations
(student’s personality, information processing, peda-
gogical preferences...) have been defined to describe
learning behaviors (Sadler-Smith, 1997). One of the
most popular is the framework described by (Felder
et al., 1988), which is still used to describe the style
of thousands of learners each year. This well-known
framework classifies students into different categories
based on the way they perceive the world, reason, re-
ceive the information, process the information, and
finally, understand this information. In total it allows
describing 32 learning styles, to which the students
belong. It is important to note that learners’ behaviors
can change over time: one student can be associated
with several categories during an extended period of
learning.
Interestingly, the framework’s authors showed that
there are also some teaching styles, which can be in
line with the learning styles or not. In the latter case,
students may become discouraged and experience de-
clines in performance or may even drop out. For that
reason, it is essential for teachers to understand how
their students learn, even if it’s very difficult when
dealing with large groups of students, to adapt their
pedagogy accordingly and pretend to enhance learn-
ing. In that sense, (El-Bishouty et al., 2019) showed
that Felder and Silverman’s framework is applicable
in an online learning context and that a course that
took into account different learning styles could im-
prove learning. Thus, LA systems processing the data
about thousand of students simultaneously represent
an important tool to support teachers: they participate
in the development of an Adaptive Learning (Nijha-
van and Brusilovsky, 2002), which adapt according to
student’s needs and offer an adapted and personalized
support helping to improve learning performances.
Many researchers have been interested in identi-
fying learner profiles from learning data (Paiva et al.,
2015; Mojarad et al., 2018; Mupinga et al., 2006; Lot-
sari et al., 2014): all of them have relied on different
methods, using different data and therefore provid-
ing different results. The next subsection details some
useful learning indicators that were used in previous
studies, and which are particularly interesting in the
context of our work.
2.2 Learning Indicators
The identification of learning styles must be based
on some indicators that provide useful insights into
the students’ behaviors. In our context of the study,
what sets these indicators apart from those existing
(e.g. in the educational sciences field) is the fact
that they must be directly evaluable from the learn-
ing data collected about students. They remain, how-
CSEDU 2022 - 14th International Conference on Computer Supported Education
36

ever, based on strong theoretical concepts from the
educational sciences, and must reflect relevant learn-
ing behaviors, providing useful information about the
learning process. Then, these indicators need to be
refined according to the available data, and will there-
fore allow characterizing different behaviors accord-
ing to the specific parameters selected from the learn-
ing traces. Hence, in this study, we rely on the follow-
ing definition of learning indicators: ”An indicator is
an observable that is pedagogically significant, com-
puted or established with the help of observations,
and testifying to the quality of interaction, activity,
and learning. It is defined according to an observation
objective and motivated by an educational objective”
(Iksal, 2012).
Many learning indicators may be of interest to us.
However, for this work, only the most significant in an
online learning context has been computed. The first
selected indicator refers to student engagement which
is, as detailed earlier, essential to ensure a quality
learning process (Dehaene, 2013). Student engage-
ment was discussed in many studies: in 2014, (Chi
and Wylie, 2014) defined the ICAP model, describing
four modes of engagement: Interactive, Constructive,
Active, and Passive. Each mode is associated with
different learning behaviors, allowing a more or less
in-depth learning process, and therefore have different
consequences on the learning outcomes. In another
way, some researchers tried to quantify this engage-
ment directly from learning traces, as (Hussain et al.,
2018) who used predictive models to identify low-
engagement students. Other interesting studies focus
on some different learning indicators, particularly in-
teresting in the context of the study: (Boroujeni et al.,
2016), for example, quantified the students’ regular-
ity to study its impact on learning outcomes. Others
authors, as (Arnold and Pistilli, 2012), detailed an in-
teresting method based on learning traces and demo-
graphic data to predict learning performances.
In our case, we want to characterize student pro-
files according to a broad spectrum of indicators. We
have therefore not focused on the characterization of
one indicator but computed several based on those
mentioned in this section. This set of indicators serves
as a basis for a clearer and fuller definition of the be-
haviors adopted by the students described by a spe-
cific dataset (Ben Soussia et al., 2021). We hypoth-
esized that this description will allow characterizing
the datasets and will be used to study their represen-
tativeness. The choice of these indicators is based on
the available data, which can vary significantly de-
pending on the learning traces. The complete method-
ology is described in section 3.
3 DESCRIPTION OF LEARNING
BEHAVIORS
3.1 Methodology
The methodology allowing the identification of
learner profiles according to selected indicators can
be divided into five steps (See Figure1):
• Selection of a LA dataset of interest.
• Selection of learning indicators depending on the
available data in the selected dataset. Learning
traces that are recorded when students interact
with VLE can be diverse and do not always reflect
the same behaviors. Hence, it is essential to sys-
tematically select indicators adapted to the studied
corpus. A unique indicator can be evaluated from
different parameters.
• Data selection and pre-processing once the indi-
cators are selected. Only the data used to com-
pute indicators are selected and pre-processed to
improve the performance of the model.
• Identification of homogeneous groups of students
(i.e. students adopting similar behaviors). To
do that, a classification method regrouping data
with similar properties in an unsupervised manner
seems to be the best solution.
• Description of the learning profiles according to
the identified groups and learning indicators se-
lected.
The data selection was performed using R (Ripley
et al., 2001). Other steps were all performed thanks
to the ScikitLearn library for Python (Pedregosa et al.,
2011). Results are detailed in the following section.
3.2 Results
3.2.1 Selection of a Dataset
The methodology was applied on the well-known
Open University Learning Analytics Dataset
(OULAD) (Kuzilek et al., 2017), which gathers data
about 32,593 students involved in distance learning at
Open University, one of the largest distance learning
universities worldwide. It is fully anonymized and
contains both demographic data, interaction data,
as well as the results of the various evaluations.
The dataset gathered information about 22 courses,
called modules, which can be dispensed multiple
times during the year, and are thus differentiated
by the year (2013 or 2014) and the month of the
beginning (B=February, J=October) of the considered
presentation.
A New Way to Characterize Learning Datasets
37
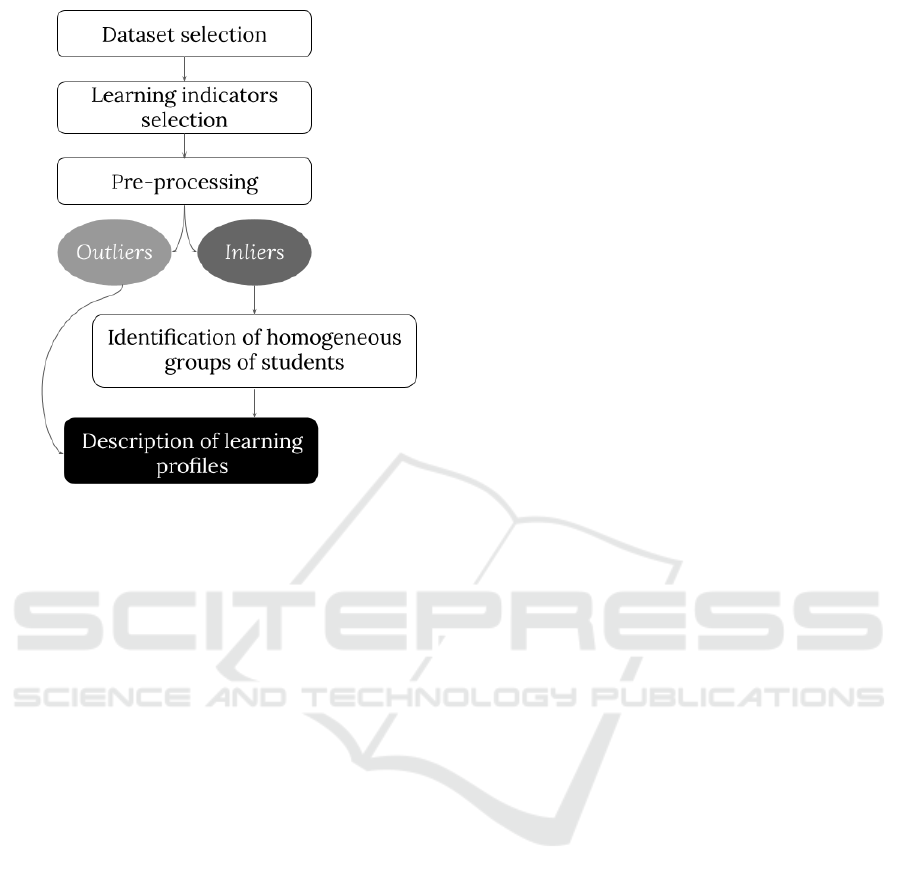
Figure 1: Different steps of the applied methodology.
To analyze a homogeneous set of students, we
chose to select a single presentation among those
available in OULAD. We have thus selected the
February 2013 (2013B) presentation of the module
DDD, which is a STEM (Science, Technology, Engi-
neering, and Mathematics) course that involved 1303
students and lasted 240 days during which 14 evalua-
tions were spread.
3.2.2 Selection of Indicators According to the
Selected Dataset
The information contained in OULAD is multiple and
detailed: we focus mainly on learners’ activity on the
VLE and rendering modalities and performances in
the exams. Furthermore, it is important to note that
the data concentrates information about 20 types of
material, with which users can interact. However,
some types of activities have more influence on learn-
ing outcomes: forumng, oucontent, homepage and
subpage activities (as entitled in the dataset) are, for
example, the most important predictors of engage-
ment according to (Hussain et al., 2018). We have
therefore only selected these four activity types.
Together, the data allowed us to work on 5 learn-
ing indicators: engagement (Hussain et al., 2018),
performance (Arnold and Pistilli, 2012), regularity
(Boroujeni et al., 2016), reactivity (Boroujeni et al.,
2016) and curiosity (Pluck and Johnson, 2011). The
definition of the indicators and the associated features
selected in the dataset are detailed in Table 1.
3.2.3 Data Pre-processing
Once the data is selected, it undergoes a pre-
processing phase which is necessary to improve the
performance of the model. We first handled miss-
ing values (NAs) by replacing them: if no activity is
recorded or the student does not get a grade (assign-
ment not handed in), the value is replaced by 0. In that
latter case, the delay is equal to 240, corresponding to
the total duration of the considered course.
At this stage, the 1303 students were divided
into 4 sub-datasets corresponding to their final re-
sult, which can be: withdrawn, fail, pass, or dis-
tinction (the information is available in the initial
dataset). The common data standardization phase is
then applied to rescale the numerical data to better
analyze it. The several standardization methods avail-
able in ScikitLearn were first compared and the Ro-
bustScaler, which is described as particularly suit-
able for data containing outliers, was selected. Fi-
nally, we applied the IsolationForest algorithm (Liu
et al., 2008) to detect outliers. In our context, outliers
represent learners adopting atypical behaviors, who
can’t be associated with any other students. However,
we emphasize that the identification of these non-
standard students is essential because their atypical
behaviors do not allow them to benefit from the same
support as the other students, so they need to be ana-
lyzed differently. From an algorithmic point of view,
their parallel treatment allows enhancing the perfor-
mances of the model. Therefore, inliers and outliers
are divided into different sub-datasets. Only inliers
are studied for the next phase, but outliers are not set
aside. They are simply treated differently and will be
described independently to provide a complete char-
acterization of the dataset.
3.2.4 Identification of Homogeneous Groups of
Students
Once inliers and outliers are identified and separated
in distinct sub-datasets, the goal is to identify homo-
geneous groups of students among the inliers and ac-
cording to the selected learning indicators. In con-
crete terms, the goal of this stage is to identify some
subsets S
k
composed by profiles P
i
described by a se-
quence of learning traces T
i, j
. Outliers are then noted
O
p
. (See Figure 2).
To classify students of the 4 sub-datasets (with-
drawn, fail, pass, distinction) into homogeneous
groups, we used the k-means algorithm (Likas et al.,
2003), which is well described and adapted to learn-
ing dataset (Navarro and Ger, 2018). The perfor-
mances were evaluated with two metrics:
CSEDU 2022 - 14th International Conference on Computer Supported Education
38
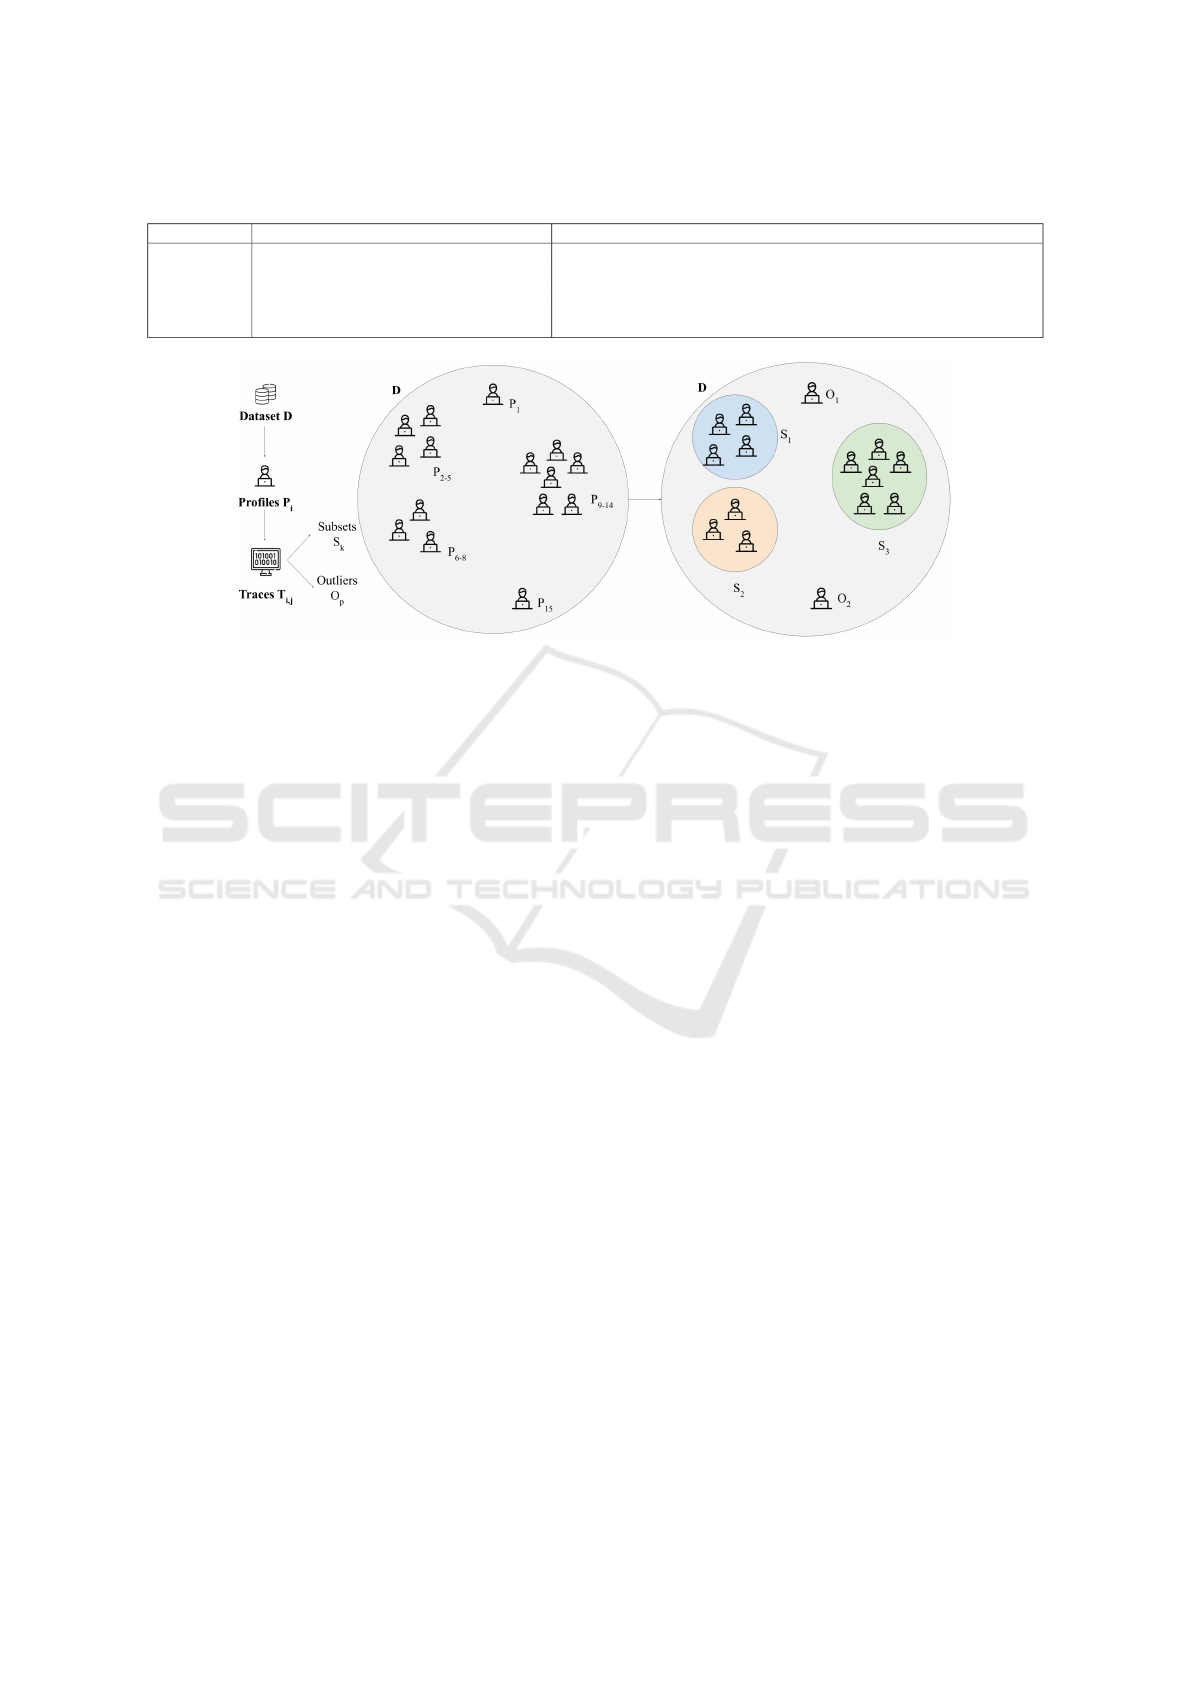
Table 1: Definition of each learning indicator and associated features selected in OULAD.
Indicator Definition Associated features in OULAD (DDD - 2013B)
Performance Students’ learning outcomes in the module Scores obtained in the 14 assessments of the module [0-100]
Reactivity Responsiveness to course-related events Delay between submission data and deadline, for each assessment
Engagement Students’ activity on the VLE Number of clicks (in total and for each activity)
Regularity Behavioral patterns Number of active days and daily behavior (in total and for each activity)
Curiosity Students’ intrinsic motivation Number of different types of resources consulted
Figure 2: Identification of subsets S
k
and outliers O
p
.
• Silhouette Analysis (Rousseeuw, 1987): mea-
sures the distance between each point of a cluster
with the points of other clusters. It has a range of
[−1;1], with values closer to 1 indicating a better
classification.
• Davies-Bouldin Criterion (Davies and Bouldin,
1979): computes the ratio of within-cluster dis-
tances to between-cluster distances of each clus-
ter with its most similar cluster. It has a range of
[0;+∞], with values closer to 0 indicating a better
classification.
3.2.5 Learner Profiles Description
Firstly, the k-means algorithm has been launched with
various values of k (from 2 to 15) and the quality of
the partition was evaluated with the Davies-Bouldin
Index and Silhouette Analysis, which made it possible
to determine the optimal value of k. Silhouette plots
(Rousseeuw, 1987) were displayed to visually iden-
tify what partitions perform better (See an example
in Figure 3). With the optimal value of k, the index
values obtained are relatively good (Davies-Bouldin
Index close to 0 and Average Silhouette Index close
to 1). This indicates a quality partition: it means that
the different learners are clustered in the right groups,
which are sufficiently separated from each other.
The described methodology allowed the identifi-
cation of a varying number of homogeneous groups
depending on the sub-dataset considered. However,
for each of them, there is always a group represent-
ing a larger proportion of the dataset, some groups
representing a smaller number of students but whose
size are still quite representative, and, finally, some
groups representing only a very small number of stu-
dents. Thus, we fixed a threshold ε = 10, under which
identified subsets are considered as outliers and then
treated as the outliers identified in the pre-processing
phase (with IsolationForest algorithm).
The larger subset corresponds to the prime per-
sona: it represents the larger proportion of the stu-
dents described in the considered dataset. The as-
sociated indicators describe then the online behavior
adopted by the majority of learners. Smaller groups
(size > ε ) were defined as under-represented per-
sonas: they are associated with a considerable num-
ber of students, who exhibit a particular behavior, dif-
ferent from the one commonly shared in the studied
dataset, and therefore required adapted support. In
addition, algorithms processing the dataset containing
information about these atypical learners and outliers
must be able to recognize them and treat them with
the same quality as students in the prime group. The
global information about the results is resumed in Ta-
ble 2.
4 CONCEPTION OF LEARNER
PERSONAS
The homogeneous groups of students identified in the
previous section give useful information about the
various online learning behaviors, to which the LA
systems must adapt. However, LA actors (develop-
ers, researchers, users...) need to understand these
A New Way to Characterize Learning Datasets
39
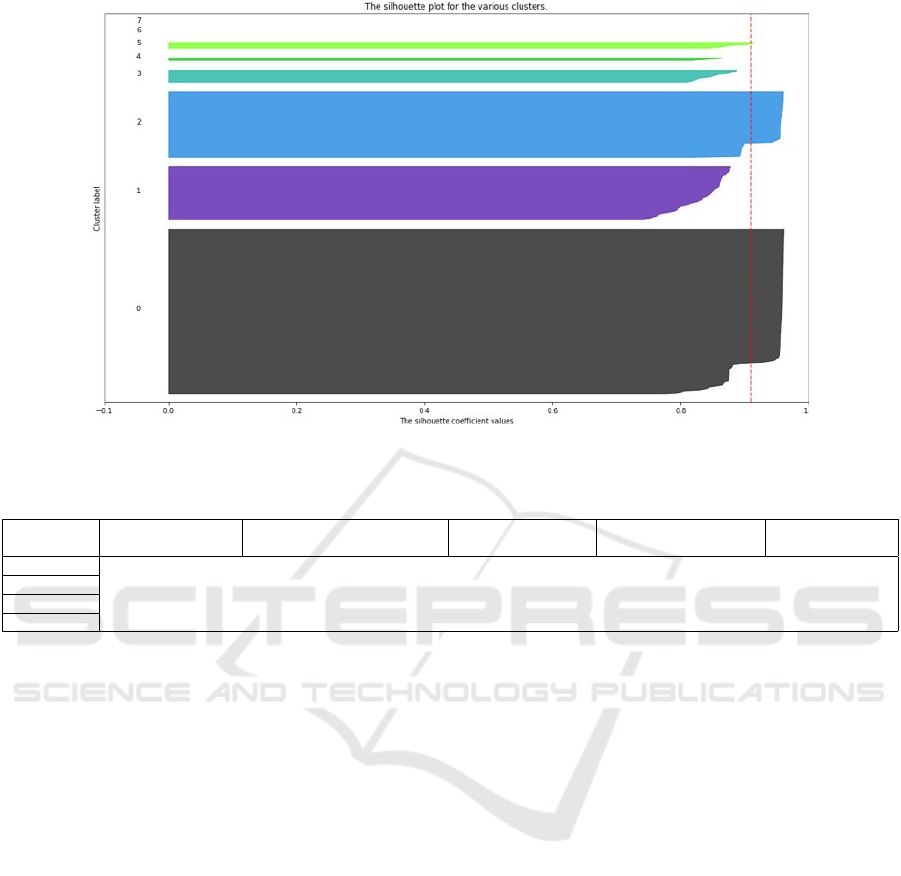
Figure 3: Silhouette analysis for k-means clustering on pass subdataset with k=8.
Table 2: Summary of number of inliers and outliers, optimal value of k and values of Davies-Bouldin and Silhouette indexes
for each subdatasets.
Subdataset Number of Inliers
Number of Outliers
(IsolationForest algorithm)
Optimal value of k Davies-Bouldin Index Silhouette Index
Withdrawn 427 5 4 0,82 0,83
Fail 357 4 8 0,16 0,91
Pass 451 5 10 0,70 0,78
Distinction 53 1 6 0,05 0,88
behaviors, and especially what they mean according
to the different learning indicators. To help them in
this task, the identified groups were, in a second step,
translated into learner personas. These latter were de-
fined as ”narrative descriptions of typical learners that
can be identified through centroids of machine learn-
ing classification processes” by (Brooks and Greer,
2014).
Personas are commonly used during the develop-
ment phase of numerical services, especially in UX
design (Lallemand and Gronier, 2016): they represent
typical users, to which the service must respond. In
our case, the goal of the learner personas is different:
they help to enhance the explicability of LA outputs to
potential users (teachers, learners), and also to study
the representativeness of a corpus.
Thus, each group identified through the presented
methodology has been translated into the form of a
persona representing a narrative description of a ficti-
tious student: it contains some demographic informa-
tion (name, gender, and age), associated with a textual
description giving essential clues about the learning
behavior, according to the learning indicators. This
description allows embodying the results returned by
the classification process: anyone who might read it
can understand it.
In the rest of the paper, prime persona, an example
of an under-represented persona, and an outlier are
detailed for each sub-dataset.
4.1 Withdrawn Dataset
To begin, we observe that the majority of students
who dropped out (76% of the dataset, 326 students)
have very low activity (351 clicks), are very irregular
(22 active days), and access very few resources (45).
This behavior causes poor results from the beginning
of the course. These students dropped out quickly,
and do not turn in any more assignments. Other un-
derrepresented subgroups are more active (number of
clicks > 1000), more regular (between 66 and 86 ac-
tive days) , and more curious (> 100 resources con-
sulted), but give up progressively, with some groups
withdrawing more quickly than others. Finally, a sur-
prising outlier of this dataset shows a very active and
regular behavior at the beginning of the course (4267
clicks, 178 active days), and he seems to be curious
(188 consulted resources). Unfortunately, he gives up
on the last assignment, which is not handed in, and
therefore does not pass the course despite his seem-
ingly ideal behavior (See Figure 4).
CSEDU 2022 - 14th International Conference on Computer Supported Education
40
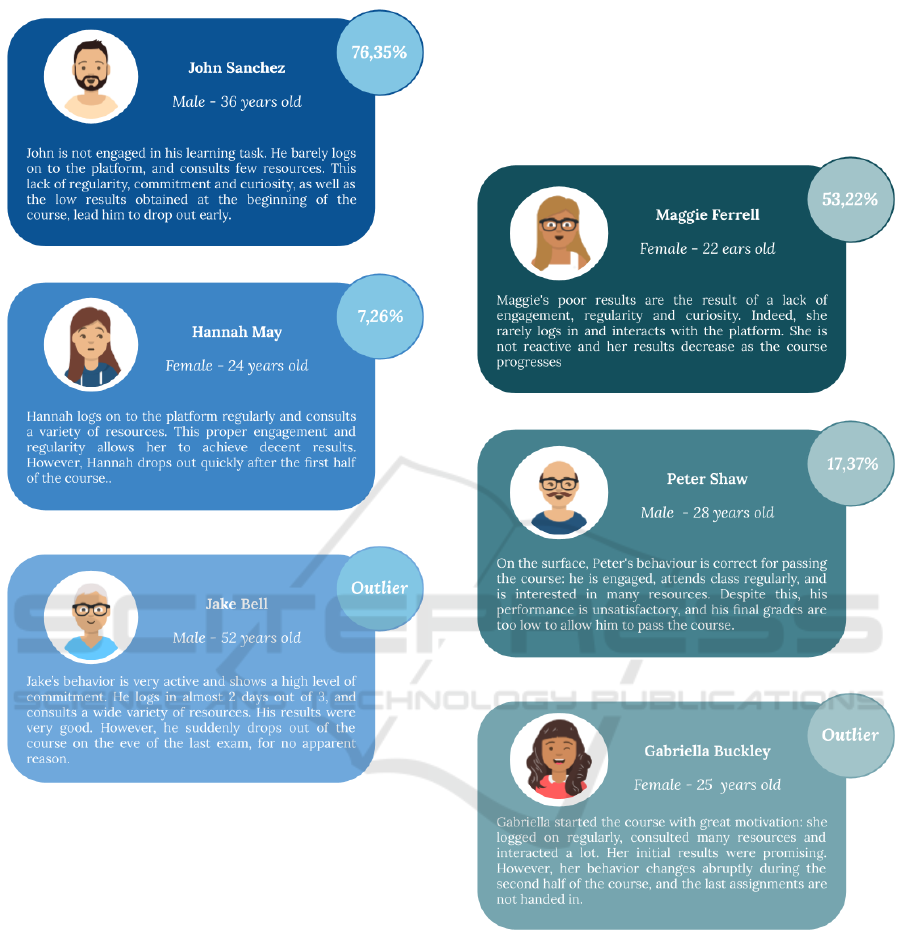
Figure 4: Personas of withdrawn dataset.
4.2 Fail Dataset
The majority of students who failed (53% of the
dataset, 190 students) are not very active (620 clicks),
whatever the type of activity considered. This low
activity is associated with a reduced number of re-
sources consulted (73) and less active days (43).
These students who are inactive, irregular, and not
very curious about the course, obtain low results that
do not allow them to succeed, especially since they
are not very reactive and do not return all the assign-
ments. Interestingly, some under-represented students
were much more active and regular (1871 clicks, 110
active days), and thus consulted a greater number of
resources (145 resources). These students turned in
all the assignments on time but obtained low scores
(grades < 40) and therefore did not pass the module.
Their learning behavior does not seem to be efficient
to allow them to succeed. Interestingly, we observe
that a specific outlier have an intense activity, with
an impressive number of clicks (7155), many days of
activity (201), and a wide variety of resources con-
sulted (240), but obtained scores are too low to pass
the module (See Figure 5).
Figure 5: Personas of fail dataset.
4.3 Pass Dataset
For successful students, the primary persona repre-
sents 69% of the dataset (312 learners). The asso-
ciated students adopt a very active behavior (2240
clicks), especially on the forums (522 clicks). They
also connect on the platform regularly (130 active
days), and consult numerous resources (167). This
active, regular, and curious learning behavior allows
them to succeed at the module, by obtaining good re-
sults (grades > 60). Other students, less represented,
A New Way to Characterize Learning Datasets
41
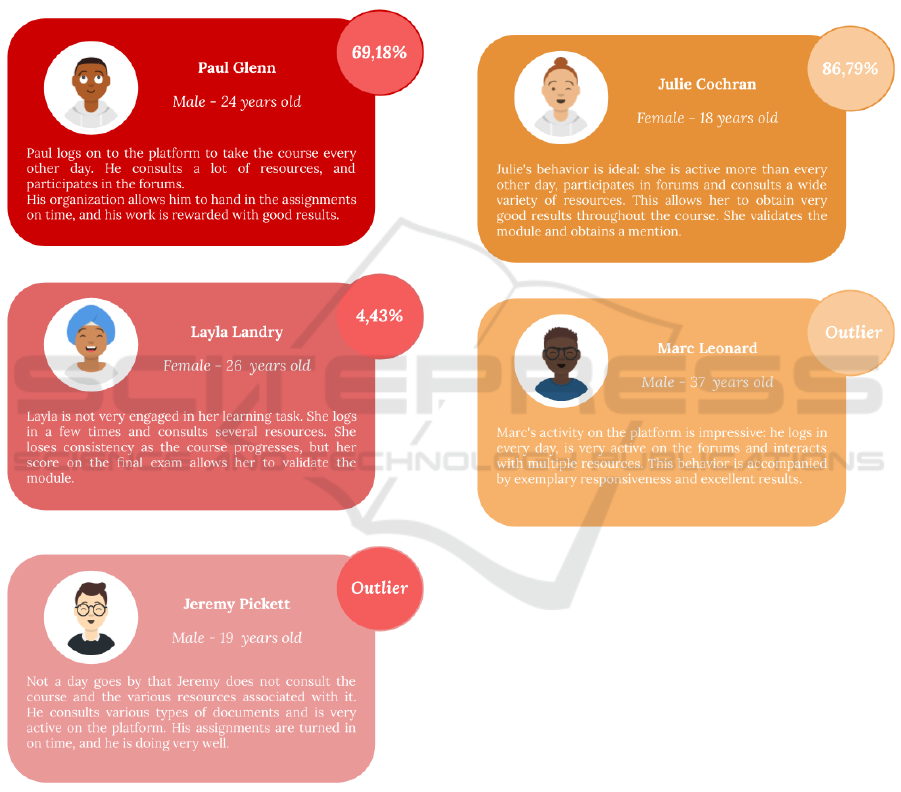
are less active with half the number of clicks (1113)
and far fewer active days (77). These students, less
active and less regular, do not turn in all the assign-
ments but their correct results nevertheless allow them
to validate the module. Finally, the outliers include
students with frenetic activity (19196 clicks) spread
over 259 active days during which 439 different re-
sources are consulted. We can easily understand why
this type of student is considered as an outlier given
the adopted behavior (See Figure 6).
Figure 6: Personas of pass dataset.
4.4 Distinction Dataset
Finally, the majority of students earning a distinction
(87%, 46 students) are very active (2577 clicks) and
regular (146 active days) in the course. In particular,
they show high activity on the forums (627 clicks).
This behavior allows them to obtain excellent grades
(> 80). For this dataset, we do not observe any under-
represented personas: the 5 identified clusters corre-
spond to only one or two students, which are there-
fore considered as outliers. The most striking one is
an outlier showing a very increased activity (17957
clicks) throughout the entire course (260 days of ac-
tivity) and a high curiosity (361 resources consulted).
This student also seems to be very active on the fo-
rums since he makes almost 7050 clicks on it. All of
his assignments are handed in on time and his results
are brilliant (See Fig 7).
Figure 7: Personas of distinction dataset.
The presented personas are particularly interest-
ing since they allow to describe the different learner
profiles described in the selected dataset, and that in
a narrative way, understandable to all. The diverse
identified profiles are based on the selected indica-
tors, which thus seem to be relevant from the point
of view of learning. They allow identifying homo-
geneous groups of students, different enough from
each other, who express interesting behaviors in ac-
cordance with their final result. Furthermore, the high
diversity of the profiles is interesting and translates,
once again, the necessity to adapt LA systems to all
users, who express specific needs. The defined per-
sonas contain information about online adopted be-
haviors, but the associated methodology also allows
us to describe the corpus in terms of group sizes, i.e.
frequency of the described behaviors. In that sense,
personas pretend to help developers ensure that their
algorithms are adapted to all students and do not in-
CSEDU 2022 - 14th International Conference on Computer Supported Education
42

troduce bias, by privileging students who adopt the
most common behavior, for example.
5 CONCLUSIONS AND
PERSPECTIVES
Broadly, the selected classification method (k-means
algorithm) was appropriate to identify groups in
which students share similar behaviors according to
the selected indicators. The different steps described,
from the selection of the dataset to the conception
of personas, allow us to answer the RQ1. In paral-
lel, the unprecedented conception of personas based
on these identified groups is then effective to de-
scribe these learning behaviors semantically and thus
completes the numerical results returned by the algo-
rithm. These personas can then be shared with all
the LA actors who will be able to understand them,
whether they are technophiles or not, and then re-
spond to the RQ2. Altogether, these elements intro-
duce some interesting insights about how to character-
ize LA datasets more completely and understandably.
This new description of corpus, based on learner per-
sonas, seems to be able to become a powerful tool in
the LA field, participating in learning improvement
for the entire student population.
Nevertheless, some aspects were pointed out and
deserve to be studied and evaluated. First of all, we
wonder if the embodiment of the personas, by giving
a name, a gender, and an age to the fictive student, is
relevant in some contexts and does not introduce other
bias in the people who have to use them. Cognitive
bias can appear and affect the way LA actors interpret
the personas and use them. A study focusing on this
aspect seems to be needed to answer this question.
The automation of personas conception can also
be discussed: we ask ourselves if the redaction of the
learning behaviors could be automated with specific
models. It seems to be essential when dealing with
very large datasets, in which the description of hun-
dred of personas implies a large workload. In another
way, having a human intervention can reassure users
and participate in the enhancement of systems’ expli-
cability. These aspects thus deserve an in-depth anal-
ysis to determine the ideal comprise between com-
plete automation and human contribution.
Finally, the presented methodology looks promis-
ing and offers interesting results but was only applied
to a unique dataset in the paper. Now, we must study
how the methodology applies to multiple datasets,
like those shared on the LOLA platform, and from
which different learning indicators can be computed.
Application to a private dataset has started and is ex-
pected to be completed in the near future. This work
contributes to the affirmation of the robustness of our
method and could allow us to impose learner personas
as a privileged tool for LA dataset characterization.
ACKNOWLEDGEMENTS
This work has been done in the framework of the
LOLA project, with the support of the French Min-
istry of Higher Education, Research, and Innovation.
REFERENCES
Arnold, K. E. and Pistilli, M. D. (2012). Course signals at
purdue: Using learning analytics to increase student
success. In Proceedings of the 2nd international con-
ference on learning analytics and knowledge, pages
267–270.
Ben Soussia, A., Roussanaly, A., and Boyer, A. (2021).
An in-depth methodology to predict at-risk learners.
In European Conference on Technology Enhanced
Learning, pages 193–206. Springer.
Boroujeni, M. S., Sharma, K., Kidzi
´
nski, Ł., Lucignano, L.,
and Dillenbourg, P. (2016). How to quantify student’s
regularity? In European conference on technology
enhanced learning, pages 277–291. Springer.
Brooks, C. and Greer, J. (2014). Explaining predictive mod-
els to learning specialists using personas. In Proceed-
ings of the fourth international conference on learning
analytics and knowledge, pages 26–30.
Chi, M. T. and Wylie, R. (2014). The icap framework: Link-
ing cognitive engagement to active learning outcomes.
Educational psychologist, 49(4):219–243.
Davies, D. L. and Bouldin, D. W. (1979). A cluster separa-
tion measure. IEEE transactions on pattern analysis
and machine intelligence, (2):224–227.
Dehaene, S. (2013). Les quatres piliers de l’apprentissage,
ou ce que nous disent les neurosciences.
El-Bishouty, M. M., Aldraiweesh, A., Alturki, U., Tor-
torella, R., Yang, J., Chang, T.-W., Graf, S., et al.
(2019). Use of felder and silverman learning style
model for online course design. Educational Tech-
nology Research and Development, 67(1):161–177.
Felder, R. M., Silverman, L. K., et al. (1988). Learning and
teaching styles in engineering education. Engineering
education, 78(7):674–681.
Hussain, M., Zhu, W., Zhang, W., and Abidi, S. M. R.
(2018). Student engagement predictions in an e-
learning system and their impact on student course as-
sessment scores. Computational intelligence and neu-
roscience, 2018.
Iksal, S. (2012). Ing
´
enierie de l’observation bas
´
ee sur
la prescription en EIAH. PhD thesis, Universit
´
e du
Maine.
A New Way to Characterize Learning Datasets
43

Kuzilek, J., Hlosta, M., and Zdrahal, Z. (2017). Open
university learning analytics dataset. Scientific data,
4(1):1–8.
Lallemand, C. and Gronier, G. (2016). M
´
ethodes de de-
sign UX: 30 m
´
ethodes fondamentales pour concevoir
et
´
evaluer les syst
`
emes interactifs. Eyrolles.
Likas, A., Vlassis, N., and Verbeek, J. J. (2003). The global
k-means clustering algorithm. Pattern recognition,
36(2):451–461.
Liu, F. T., Ting, K. M., and Zhou, Z.-H. (2008). Isolation
forest. In 2008 eighth ieee international conference
on data mining, pages 413–422. IEEE.
Lotsari, E., Verykios, V. S., Panagiotakopoulos, C., and
Kalles, D. (2014). A learning analytics methodology
for student profiling. In Hellenic Conference on Arti-
ficial Intelligence, pages 300–312. Springer.
Mojarad, S., Essa, A., Mojarad, S., and Baker, R. S. (2018).
Data-driven learner profiling based on clustering stu-
dent behaviors: learning consistency, pace and effort.
In International conference on intelligent tutoring sys-
tems, pages 130–139. Springer.
Mupinga, D. M., Nora, R. T., and Yaw, D. C. (2006). The
learning styles, expectations, and needs of online stu-
dents. College teaching, 54(1):185–189.
Navarro,
´
A. A. M. and Ger, P. M. (2018). Comparison of
clustering algorithms for learning analytics with edu-
cational datasets. IJIMAI, 5(2):9–16.
Nijhavan, H. and Brusilovsky, P. (2002). A framework
for adaptive e-learning based on distributed re-usable
learning activities. In E-learn: World conference on
e-learning in corporate, government, healthcare, and
higher education, pages 154–161. Association for the
Advancement of Computing in Education (AACE).
Paiva, R. O. A., Bittencourt, I. I., da Silva, A. P., Isotani, S.,
and Jaques, P. (2015). Improving pedagogical recom-
mendations by classifying students according to their
interactional behavior in a gamified learning environ-
ment. In Proceedings of the 30th Annual ACM Sym-
posium on Applied Computing, pages 233–238.
Pedregosa, F., Varoquaux, G., Gramfort, A., Michel, V.,
Thirion, B., Grisel, O., Blondel, M., Prettenhofer, P.,
Weiss, R., Dubourg, V., et al. (2011). Scikit-learn:
Machine learning in python. the Journal of machine
Learning research, 12:2825–2830.
Pluck, G. and Johnson, H. (2011). Stimulating curiosity
to enhance learning. GESJ: Education Sciences and
Psychology, 2.
Ripley, B. D. et al. (2001). The r project in statistical com-
puting. MSOR Connections. The newsletter of the
LTSN Maths, Stats & OR Network, 1(1):23–25.
Rousseeuw, P. J. (1987). Silhouettes: a graphical aid to
the interpretation and validation of cluster analysis.
Journal of computational and applied mathematics,
20:53–65.
Sadler-Smith, E. (1997). ‘learning style’: frameworks and
instruments. Educational psychology, 17(1-2):51–63.
Siemens, G. and Long, P. (2011). Penetrating the fog: Ana-
lytics in learning and education. EDUCAUSE review,
46(5):30.
Slade, S. and Prinsloo, P. (2013). Learning analytics: Ethi-
cal issues and dilemmas. American Behavioral Scien-
tist, 57(10):1510–1529.
Xu, D. and Jaggars, S. S. (2014). Performance gaps be-
tween online and face-to-face courses: Differences
across types of students and academic subject areas.
The Journal of Higher Education, 85(5):633–659.
CSEDU 2022 - 14th International Conference on Computer Supported Education
44
