
MARE: Semantic Supply Chain Disruption Management and Resilience
Evaluation Framework
Nour Ramzy
1 a
, S
¨
oren Auer
2 b
, Hans Ehm
1 c
and Javad Chamanara
2 d
1
Infineon Technologies AG, Am Campeon 1-15, 85579 Munich, Germany
2
TIB: Technische Informationsbibliothek Welfengarten 1B, 30167 Hannover, Germany
Keywords:
Supply Chain Resilience, Disruption Management Process, Knowledge Graphs, Semantic Data Integration,
Ontologies.
Abstract:
Supply Chains (SCs) are subject to disruptive events that potentially hinder the operational performance. Dis-
ruption Management Process (DMP) relies on the analysis of integrated heterogeneous data sources such as
production scheduling, order management and logistics to evaluate the impact of disruptions on the SC. Ex-
isting approaches are limited as they address DMP process steps and corresponding data sources in a rather
isolated manner which hurdles the systematic handling of a disruption originating anywhere in the SC. Thus,
we propose MARE a semantic disruption management and resilience evaluation framework for integration of
data sources included in all DMP steps, i.e. Monitor/Model, Assess, Recover and Evaluate. MARE, leverages
semantic technologies i.e. ontologies, knowledge graphs and SPARQL queries to model and reproduce SC be-
havior under disruptive scenarios. Also, MARE includes an evaluation framework to examine the restoration
performance of a SC applying various recovery strategies. Semantic SC DMP, put forward by MARE, allows
stakeholders to potentially identify the measures to enhance SC integration, increase the resilience of supply
networks and ultimately facilitate digitalization.
1 INTRODUCTION
In highly globalized and complex SCs, performance
analysis is essential as the change in behavior due
to disruptive events does not only affect one or-
ganization but a highly connected network (Singh
et al., 2019). The importance of systematic Disrup-
tion Management for Supply Chains was just recently
again stressed in the course of the COVID-19 pan-
demic, but also already earlier in the light of events
such as natural disasters, transportation blockages,
sanctions etc. Therefore, a vast share of enterprises
rely on a Disruption Management Process (DMP) to
monitor, model, assess and recover from disruptions.
The management and the evaluation of disruptions
and their consequences on the SC require the inte-
gration of various distributed data sources, e.g. from
manufacturing, order and inventory management. SC
semantic models, i.e. ontologies, enable SC data in-
tegration by providing a common and explicit under-
a
https://orcid.org/0000-0002-7109-8784
b
https://orcid.org/0000-0002-0698-2864
c
https://orcid.org/0000-0001-6392-8269
d
https://orcid.org/0000-0001-6390-1584
standing for business-related concepts (Pal, 2019).
Existing approaches address core DMP aspects but
still in an isolated form, hence, limiting integrated
SC behavioral analysis. Compared to previous work,
our main contribution in this paper is MARE, MARE
is a semantic disruption management and resilience
evaluation framework, to integrate data covered by
all DMP steps Monitor/Model, Assess, Recover and
Evaluate.
MARE leverages a disruption ontology to model
disruptive events and a knowledge-graph to repre-
sent specific disaster scenarios and the entailed ef-
fect on the SC. MARE includes production schedul-
ing data and disruption knowledge-graphs to detect
the implication of the disruption on the SC operations,
during the assessment phase. Thus, MARE imple-
ments SPARQL-based recovery strategies to resolve
the impairment caused by the disruption. Moreover,
MARE incorporates a semantic evaluation framework
to quantify the effect of recovery in terms of cost and
delay on the SC. Based on the evaluation results, and
the recovery behavior analysis, SC stakeholders po-
tentially make decisions to redesign the SC or estab-
lish new operational strategies ensuring a more re-
484
Ramzy, N., Auer, S., Ehm, H. and Chamanara, J.
MARE: Semantic Supply Chain Disruption Management and Resilience Evaluation Framework.
DOI: 10.5220/0010983500003179
In Proceedings of the 24th International Conference on Enterprise Information Systems (ICEIS 2022) - Volume 2, pages 484-493
ISBN: 978-989-758-569-2; ISSN: 2184-4992
Copyright
c
2022 by SCITEPRESS – Science and Technology Publications, Lda. All rights reserved

silient SC.
As a result, companies can rely on MARE to inte-
grate SC data sources to model and map the SC be-
havior, to examine the effect of disruption and the
consequences of applying various mitigation strate-
gies. Ultimately, we deem that better simulation and
analysis, as put forward by MARE, will contribute to
mastering more complex SC scenarios, control dis-
ruption accelerators e.g. the bullwhip effect and in-
crease the resilience of supply networks.
The remainder of the paper is divided as follows:
first we introduce the background of the DMP and
existing semantic implementation for SC disruption
handling in Section 2 and the motivation behind our
proposed work. Second, we present MARE in Sec-
tion 3, a framework to semantically model and man-
age disruptions and evaluate SC resilience. In Sec-
tion 4, we elaborate on MARE’s semantic artifacts
to model and assess disruptions, i.e, the first two
stages of DMP. In Section 5, we introduce SPARQL-
based recovery strategies to restore the SC to the pre-
disruption behavior. Also, we propose an evaluation
framework to analyze recovery performance. In Sec-
tion 6, we evaluate MARE to simulate the behavior
of a synthetic SC under various exemplary disrupted
events. Finally, we conclude and present an outlook
for further steps to extend MARE in Section 7.
2 BACKGROUND AND RELATED
WORK
2.1 Supply Chain Disruption
Management Process
SC disruptions as described by (Craighead et al.,
2007) are events that modify the flow of goods and
materials, hindering the SC’s overall objective to pro-
duce and deliver services and goods to end-customers.
In fact, (Blackhurst et al., 2005) define SC DMP as the
process to discover the disruptive event, recover from
the effect and potentially redesign the system trig-
gered by recovery learning outcomes. Namely, dis-
covery refers to the point in time when SC stakehold-
ers become aware of the disruption (Macdonald and
Corsi, 2013). Then, disruption modeling of the sys-
tem dynamics, e.g. via Petri nets, in simulation tools,
is essential in order to analyze expected consequences
and effects of the discovered event (Bugert and Lasch,
2018). For instance, (Jaenichen et al., 2021) rely on
the system dynamics simulation model implemented
in AnyLogic 8 tool (Ismail and Ehm, 2021) to demon-
strate the behavior of a multi-echelon SC responding
to different end market scenarios.
Further, SC stakeholders choose the most effective
recovery strategy to minimize the impacts of the dis-
ruption (Macdonald and Corsi, 2013). Thus, the re-
covery performance analysis evaluates the SC ability
to repair and return to the pre-disruption phase. Based
on the evaluation’s learning effects, SC stakeholders
can rethink the SC design and operation processes
and potentially decide on changes allowing more re-
silience e.g. increasing production capacity or apply-
ing a multiple sourcing strategy. The ability to both
resist disruptions and recover the operational capa-
bility after disruptions occur, is defined as SC Re-
silience (Simbizi et al., 2021).
DMP entails the integration of highly heteroge-
neous data sources. (Samaranayake, 2005) elaborate
that the integration provides visibility, flexibility and
maintainability of SC components. Consequently,
stakeholders can make more informative decisions to-
wards enhancing SC performance and increasing re-
silience. For instance, (Simchi-Levi et al., 2015) inte-
grate data from bill of material, part routing, inven-
tory levels, and plant volumes to map the SC and
accordingly assess the impact of a disruption origi-
nating anywhere on product manufacturing and de-
livery. Also, (Sabouhi et al., 2018) examine data from
raw materials procurement along with inventory man-
agement systems to test the effect of various strate-
gies in establishing resilience. (Ivanov and Dolgui,
2020) add that SC digital twins enable integration to
discover the link between SC disruption and perfor-
mance deterioration. Namely, semantic models, one
sort of digital twins, facilitate information exchange
and allow SCs to reach full and agile information in-
tegration.
2.2 Semantic SC Disruption
Management
In (ASCM, 2021) the authors explain that the view of
SCs is based on internal data and seemingly relies on
siloed or outdated data-sets. Consequently, detecting
emerging threats or calculating how disruption will
unfold across the whole SCs and business units is gen-
erally possible but to a rather limited extent. How-
ever, semantic modeling of SCs allows to overcome
the siloed paradigm and to blend and consolidate data
from dispersed data sources (Ye et al., 2008).
There exist several articles in the literature that
devise semantic implementations to analyze SC per-
formance during disruptions. (Emmenegger et al.,
2012) create an ontology model to monitor and model
risks, give early warning and propose a procedure
for assessing impacts on SC. Also, (Palmer et al.,
MARE: Semantic Supply Chain Disruption Management and Resilience Evaluation Framework
485

2018) present an ontology-supported risk assessment
approach for a resilient configuration of supply net-
works. Moreover, (Singh et al., 2019) provides an
ontology-based decision support system to intensify
the SC resilience during a disruption. Despite these
developments, we note that existing approaches ad-
dress DMP process steps in a rather isolated way, i.e.,
only one step of the process is incorporated e.g. to
model the disruption risk or to assess its impact. Thus,
we introduce MARE that, to the best of our knowl-
edge, is the first work to integrate various data sources
incorporated by all the DMP steps to Monitor/Model,
Assess, Recover and Evaluate.
3 METHODOLOGY
In this section, we describe our semantic disruption
management and resilience evaluation framework,
MARE. Moreover, we elaborate on MARE’s seman-
tic artifacts i.e., ontologies, knowledge graphs and
SPARQL to implement the DMP. As shown in Fig-
ure 1, the DMP starts with Monitoring and Modeling
SC disruptions. This phase is to discover the event
that disrupts the SC and to create a semantic model
incorporating the disruption’s attributes e.g. severity,
cause and duration. We rely on the Disruption On-
tology model, where the information is represented
in the form of RDF triples
1
, to establish a common
understanding of a disruption event. Consequently,
we create a specific instance of a disruption event i.e.
Disruption Knowledge Graph (KG). The output of the
Monitor/Model process step, the Disruption KG, is
used in the following step to assess the effect of the
disruption on the SC.
The target of a SC is to fulfill end-customers’ de-
mand. Namely, SC planning defines a scheduled ca-
pacity allocation for products among production facil-
ities as well as the needed parts among suppliers i.e.,
Supply Plan. In previous work (Ramzy et al., 2021),
we devised a semantic model for demand, production
scheduling data and corresponding supply plan as fol-
lows:
• Demand: SC demand is represented by the triples
of the following form Customer makes Order. An
order includes details about the product, deliv-
ery time and quantity: Order hasProduct Prod-
uct, Order hasDeliveryTime xsd:dateTime and
Order hasQuantity xsd:integer. Based on the
customer segmentation paradigm, customers are
given a priority, entailing a certain sequence in
demand fulfillment, i.e., Customer hasPriority
1
https://www.w3.org/TR/rdf-concepts/
xsd:integer.
• Supply Plan: A supply plan is defined as the al-
location of demand for parts among suppliers or
the allocation of demand for products among pro-
duction facilities (Sawik, 2019). Order hasSup-
plyPlan Plan and Plan needsPartner Partner de-
scribe the needed SC partners to fulfill this order.
Each partner is responsible for providing a prod-
uct, i.e. << Plan needsPartner Partner >> get-
sProduct Product at a certain time hasTimeStamp
xsd:date. The mentioned product can either be the
final product or intermediary parts used to man-
ufacture the final product. The quantity and the
price are modeled using hasQuantity xsd:double
and hasUnitPrice xsd:double
Disrupted SC partners potentially cannot fulfill
their role in the plan, which affects the whole SC per-
formance. Therefore, during the disruption Assess-
ment phase, we leverage queries adhering to the W3C
SPARQL standard to identify affected SC partners
that are located in the same regions as the disruptions
and who participate in the supply plan at the same
time of the disruption (as described in detail in Sec-
tion 4). In this process step, we integrate data sources
from production scheduling (Supply Plan) and disrup-
tion models (Disruption KG) to output the Disrupted
Supply Plan.
The following step in the DMP is to apply Recov-
ery strategies to attempt a return to the pre-disruption
performance of the SC. In this phase, we rely on
SPARQL endpoints to integrate data from production
scheduling, order processing, inventory management,
and suppliers assignment in order to find alternative
allocations for the disrupted plans.The output of this
step is one or more proposed Recovered Supply Plans
that include the updated scheduled allocations.
The last step of the DMP is to Evaluate the SC
recovery performance. We propose a resilience Eval-
uation framework based on SPARQL queries to ex-
amine the time and the cost entailed by the Recov-
ered Supply Plan and required for the SC to return
to the pre-disruption state. In fact, SC stakeholders
rely on this evaluation to potentially identify needs to
redesign SC or apply new operational strategies e.g.
supplier diversification.
4 SUPPLY CHAIN DISRUPTION
MODELING AND ASSESSMENT
In this section, we present the first two steps of MARE
to model and assess the effect of monitored disrup-
tions on the SC.
ICEIS 2022 - 24th International Conference on Enterprise Information Systems
486
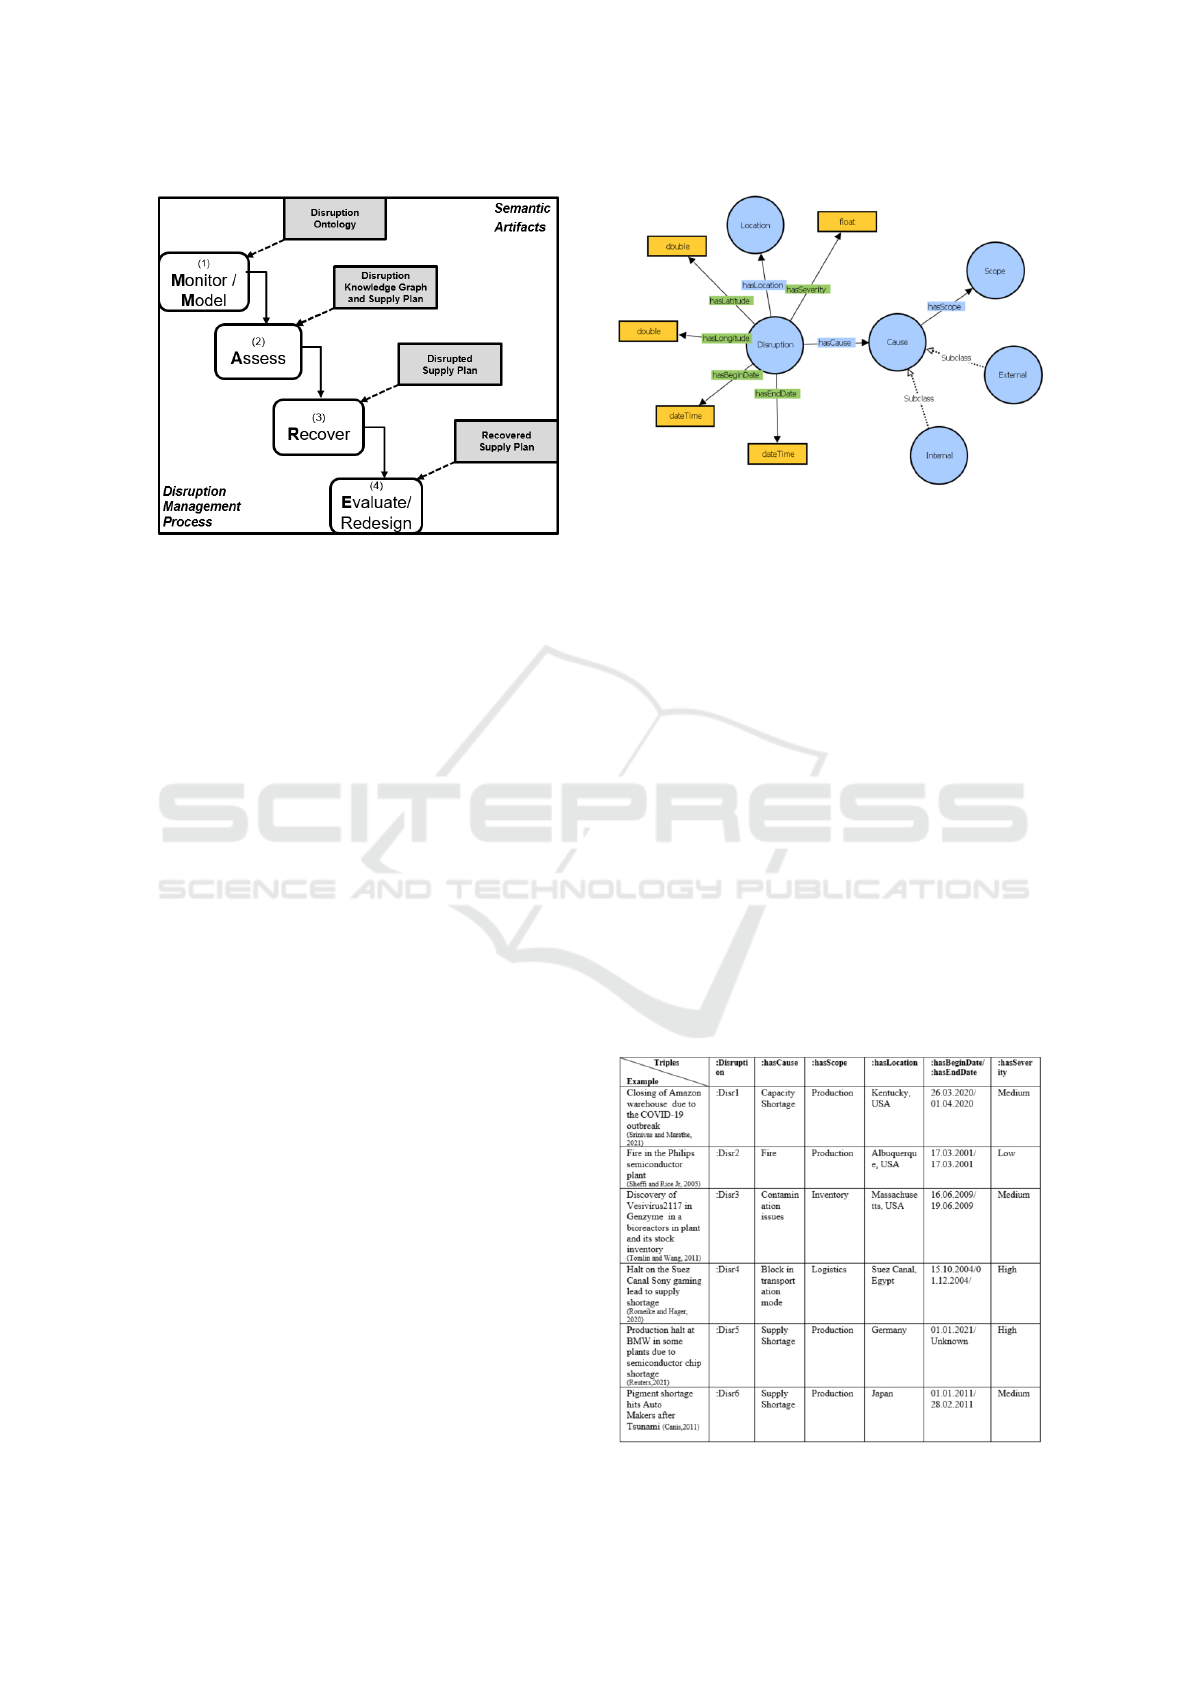
Figure 1: Overview in the MARE semantic disruption man-
agement and resilience evaluation framework.
4.1 Modeling Disruption
4.1.1 Disruption Ontology
We propose the Disruption Ontology shown in Fig-
ure 2 to establish a model for disruptive events. The
ontology is based on RDF where the information is
represented in triples. First, a triple of the following
form Disruption hasCause Cause, describes the main
cause that led to the disruption. In fact, (Messina
et al., 2020) classifies disruption causes as internal
and external. The first is caused by events happening
within internal boundaries and the business control of
the organizations e.g. malfunctioning of a machine
or inventory corruption. While the latter is driven
by events either upstream or downstream in the SC
e.g. supplier insufficient capacity, interruptions to the
flow of product, or significant increase/decrease in de-
mand.
Moreover, disruptions impact various SC scopes
e.g. production, logistics, inventory (Macdonald and
Corsi, 2013). This, is reflected by triples of the form:
Cause hasScope xsd:string. Additionally, the struc-
ture Disruption hasSeverity xsd:string incorporates fi-
nancial losses caused by the disruption and their ef-
fect on the reduction or elimination of the produc-
tion quantities. Further, disruption events can be of
short or long duration. We use the following triple
representation to model the disruption beginning and
end Disruption hasBeginDate xsd:date and Disrup-
tion hasEndDate xsd:date. Also, we use Disruption
hasLocation Location to represent the geographical
location where the disruption occurs. We rely on
geo-coordinates system to resolve locations using the
properties hasLongitude, hasLatitude.
Figure 2: Overview on the core concepts of the Disruption
Ontology for modeling disruptive event characteristics.
In fact, classifying the modeled characteristics of
the disruption enables SC stakeholders to determine
suitable recovery strategies for this event. For exam-
ple, in case of an external disruption due to the lack
of a supplier’s capacity, the recovery means can be to
find an alternative supplier. Whereas, to recover from
an internal malfunctioning machinery within an own
facility, one needs to fix it by retrieving spare parts
from a machine of the same brand.
4.1.2 Instantiated Examples
The proposed disruption ontology incorporates dis-
ruption attributes to create a specific instantiation of
a disruption event, represented by the Disruption KG.
We present in Table 1 various examples from past
events to highlight possible variations in disruptions
in terms of cause, scope, location, duration and sever-
ity.
Table 1: Disruption examples and corresponding triple rep-
resentation.
MARE: Semantic Supply Chain Disruption Management and Resilience Evaluation Framework
487

:Disr1 is an example of capacity scarcity caused
by labor shortage after a COVID-19 outbreak that led
to a complete shutdown of production lasting four
days. :Disr2 shows a very short disruption, as the fire
lasted for 10 minutes and the physical damages were
minimal i.e., the severity is low. Further, the medium
contamination described by :Disr3 affected not only
the production plant but also the stockpile inventory.
Moreover, due to a halt in maritime transporta-
tion mode caused by a blockage in the Suez Canal,
Sony sales dropped from 70,000 a week to around
6,000, i.e. :Disr4. In fact, supply shortage includes
scarcity in raw material or any event (bankruptcy,
over-demand) that leads to a reduction or discontin-
uation in supply. In 2020, due to the COVID-19 pan-
demic, automotive industry suffered from substantial
drop in demand that led to slowing their semiconduc-
tor orders. Meanwhile, the semiconductor manufac-
turers faced a significant increase in demand due to
the rising need for personal computers, servers, and
equipment while their own facilities were shutting
down because of COVID-19 outbreaks (Burkacky
et al., 2021). For instance, :Disr5 representing over-
demand, halted production and unstable orders, leads
BMW to recognize a loss of 30,000 units in produc-
tion so far in 2021. This disruption has an undefined
end date. Similarly, :Disr6 models the missing color
pigments produced by factories in Japan affected by
the Tsunami in 2011. :Disr6 has medium severity
since car manufacturers limit ordering vehicles only
in specific shades.
4.2 Disruption Assessment and Effect
After identifying and modeling the disruption, the fol-
lowing step is to assess the impact. SC disruptions
potentially hurdle SC entities from achieving opera-
tional goals i.e. fulfilling end customers orders. We
leverage data from production scheduling and order
processing i.e. Supply Plan along with the modeled
disruption from the previous step i.e. the Disruption
Knowledge Graph.
The first step to assess the disruption effect
is to identify the SC partners that are part of a
supply plan, yet fall within the disruption loca-
tion and time frame. Listing 1
2
retrieves and la-
bels SC partners and corresponding Disrupted Sup-
ply Plan. Also, the effect of the disruption is de-
fined by how many supply plans are affected. We
insert Disruption affectsPlan xsd:integer i.e. the
2
For simplicity, the query is just using a standard lon-
gitude/latitude matching, but in our implementation we ac-
tually implemented a geo-spacial rectangular containment
matching between supplier and disruption locations.
count of disrupted plans identified in Listing 1.
Listing 1: Identify Disrupted Partners.
INSERT {
? plan : is D i s r upt e d ’ True ’ .
< <? p l an : n eeds P a r tner ? p artner >>
: i s D i srup t e d ’ T rue ’.
? d i s r uptio n : aff e c t sPa r t n er ? p a r t ner .}
WHERE {
< <? p l an : n e e dsPa r t n er ? partn e r >>
: h a s Time S t a mp ? t .
? pa r t n e r : h a s Long i t u de ? long .
? pa r t n e r : h a s L atit u d e ? lat .
? d i s r uptio n : hasL a t i t ude ? la t i t u d e .
? d i s r uptio n : hasL o n g itud e ? lon g i t u d e .
? d i s r uptio n : hasS t a r tTim e ? star t .
? d i s r uptio n : hasEn d T i m e ? en d .
FILTER (? t >=? st a r t && ?t <? end &&
? longit =? l o ng & & ? lat =? la t itude )
}
The second step is to size the effect of the dis-
ruption on the disrupted SC partners. The sever-
ity of the disruption determines the impact of the
event on the partner’s capacity to fulfill the sup-
ply plan. For simplicity, we model the sever-
ity as a numerical factor that shows the reduc-
tion in production capacities caused by the disrup-
tion. As shown in Listing 2, the pre-disruption
allocated quantity is reduced by the severity fac-
tor. The difference between the original and the re-
duced quantities represents the quantity to be sup-
plied or produced by alternative partners and means.
Listing 2: Determine Disruption Impact.
SELECT * W H E RE {
< <? p l an : n eeds P a r tner ? p artner >>
: i s D i srup t e d ’ True ’ ;
: g e t s Prod u c t ? product ;
: h a s Time S t a mp ?t ;
: h a s Q uant i t y ?q .
? d i s r uptio n : aff e c t sPa r t n er ? p a r t ner .
? d i s r uptio n : hasS e v e r ity ? factor .
BIND (? q *? factor AS ? redu c e d ) .
BIND (?q -? reduce d AS ? t o R ecove r )
}
After modeling and assessing the disruption effect on
the supply plans, the next steps in the DMP are to
implement recovery strategies and evaluate the SC re-
silience and recovery performance.
ICEIS 2022 - 24th International Conference on Enterprise Information Systems
488

5 RECOVERY AND RESILIENCE
EVALUATION
5.1 Supply Chain Recovery
In this section, we describe the implementation of the
third step of MARE i.e., Recovery. Recovery strate-
gies are actions applied to regain the pre-disruption
state of the SC, capable of delivering products to cus-
tomers on time while minimizing the cost. Via in-
tegrating data sources about inventory management,
resources procurement, supply management and lo-
gistics, we aim to recover disrupted supply plans.
We present recovery strategies that rely only on the
change in the SC planning and do not require any
physical modification in the industrial process as the
latter are highly dependent on the industry. For in-
stance, increasing production capacity or allowing
faster production are not realistic in capital intense
or complex industries like semiconductor production.
We propose the following SPARQL-based recovery
strategies
3
capable of adapting the supply plan de-
pending on the disruption cause and scope. For all
the following queries we assume the recovery is for
Product P, at time T in quantity Q.
S1: Strategic Stock is defined as a stockpile of
inventory that can be used to fulfill demand dur-
ing a disruption (Tomlin and Wang, 2011). List-
ing 3 verifies if the partner has strategic stock
and returns the required price. We use inven-
tory management data sources to implement this
strategy. In fact, storing the strategic stock en-
tails costs for warehousing, labor and insurance.
Listing 3: Strategic Stock Strategy.
SELECT * W H E RE {
: Pa r t n e r : has S t art e g icS t o ck ? s t o c k
? stock : h a s Tim e S t a mp : T .
? stock : h a s Quan t i t y ? q .
? stock : h a s P r i c e ? price .
? stock : h a s P rodu c t :P .
FILTER (? q >= Q )
}
S2: Alternative Shipment in case of a disruption
affecting the transport mode e.g. flights, trains, a
company can switch to another shipment mode to de-
liver products. The query in Listing 4 retrieves the
shipment modes employed by a partner and the en-
tailed costs caused by the change of transportation
3
We show only exemplary SPARQL queries for the re-
covery strategies and refer to the accompanying GitHub
repository (MARE, 2022) for the complete set.
modes, usually incorporated in logistics data sources
(Messina et al., 2020).
Listing 4: Alternative Shipment Recovery Strategy.
SELECT * W H E RE {
: Pa r t n e r : has T r ans p o r tM o d e ? mode .
? mode : hasCost ? c ost .
}
S3: Delayed Recovery this recovery strategy con-
sists of verifying the status of the disrupted partner in
case it can deliver slightly later than planned. List-
ing 5 checks for five days after the planned delivery
time, if a SC partner has enough capacity, lower than
saturation, to fulfill the plan. In fact, small delays
in deliveries can mitigate financial losses due to dis-
ruption (Paul et al., 2019). Whereas, delays greater
than five days (a week) potentially lead to fines of
great amounts. Production management and schedul-
ing data sources incorporate data about the continuous
state of capacity production.
Listing 5: Delayed Recovery Strategy.
SELECT * W H E RE {
: Pa r t n e r : hasC a p a c ity ? cap .
: Pa r t n e r : ha s C a pa c i ty S a t ur a t io n ? s at .
? ca p : h asPr o d u c t : P .
? ca p : h asPrice ? p r i c e .
? ca p : ha sTi m e S tamp t _ f u t ure .
? ca p : h asQ u a n t ity ? q.
FILTER (? sat >= ?q + Q && t_ f u ture < T +5 )
}
S4: Alternative Supplier this strategy applies in
case of an external disruption that hinders the supplier
from providing the required products at the time in-
cluded in the supply plan. In fact, (Sawik, 2019) elab-
orates that suppliers have production flexibility that
allows them to deliver a contingency quantity in case
other suppliers fail. However, the alternate source
of supply can be more expensive than the firms’ pri-
mary suppliers, but it is deemed necessary, in or-
der to recover the disrupted supply plan (MacKen-
zie et al., 2014). To reduce purchasing prices and
benefit from the high performance, suppliers that
are capable of supplying the same products, are ex-
changeable (Hofstetter and Grimm, 2019). We model
this via the property hasGroup. Listing 6 shows
the query to find alternative, exchangeable suppli-
ers that have the capacity (lower than saturation)
to provide the same intermediate products or mate-
rials, for the same time as the disrupted supplier.
We rely on data from supply management and re-
sources procurement to make decisions about suppli-
MARE: Semantic Supply Chain Disruption Management and Resilience Evaluation Framework
489

ers belonging to the same group and their capacities.
Listing 6: Alternative Supplier Recovery Strategy.
SELECT * W H E RE {
: Pa r t n e r : hasGroup ? g r o u p .
? s u p p l i e r : h a s G r o u p ? group .
? s u p p l i e r : h a s C apa c i t y ? ca p .
? ca p : h asPr o d u c t ? p .
? ca p : ha sQua n t i ty ? q .
? ca p : h asPrice ? p r i c e .
? ca p : ha sTi m e S tamp : T.
? s u p p l i e r : h a sC a p a ci t y Sa t u rat i o n ? sat .
FILTER ( ? sat >= ?q + Q )
}
The output of this phase is a proposed Recovered
Supply Plan that minimizes recovery delays and costs.
We identify a successful recovery as the case where
all missing/reduced quantities from disrupted plans
are provided alternatively. In this case, we insert
the triple in the form Plan isRecoveredBy xsd:string,
where we explicit which recovery strategy applied.
5.2 Resilience Evaluation Framework
In this section, we introduce step 4 in MARE i.e., the
evaluation framework for SC resilience and recovery.
Thus, we compare the pre-disruption supply plans to
the recovered supply generated in the recovery phase.
We rely on the recovery performance evaluation met-
rics proposed by (Macdonald and Corsi, 2013).
Recovery Cost Increase: is the extra expense
caused by the disruption and the recovery as com-
pared to the original price of the pre-disruption sup-
ply plans. First we calculate the price of the recovered
plan for each order and we retrieve the order original
price. By summing the difference, we get the total
cost increase for all orders in Listing 7. We do not
consider the cost to rebuild anything lost physically
as this is included in the severity factor.
Listing 7: Evaluate Recovery Cost Increase.
SELECT ( SUM (? curr e n t pri c e -
? o r i gin a l P ric e ) as ? co s t I ncre a s e ) {
SELECT ? o r igi n a l Pri c e ( SU M (? p r i c e )
as ? c urr e n t pric e
WHERE {
? order : hasPlan ? plan ;
: h a sOr i g i na l P r ice ? orig i n a lPr i c e .
< <? p l an : n eeds P a r tner ? p artner >>
: h a s Q uant i t y ?q ;
: h a s Unit P r i ce ?p ;
: h a s Time S t a mp ?t .
BIND (? p *q AS ? p rice )
} GROUP BY (? plan )
}
Recovery Speed: is the time taken till recovery is
complete i.e., for S3, it is the next available day where
there is enough production capacity, entailing a new
delivery time. In Listing 8, we calculate the number
of orders where the delivery time in the supply plan
is later than the original delivery time, pre-disruption.
These orders are considered late orders, delayed by
the difference between the original and the late deliv-
ery times.
Listing 8: Evaluate Recovery Speed.
SELECT
SUM ( IF (? t > dt ) ,1 ,0 )) AS ? lateorders ,
SUM ( IF (? t <= dt ) ,1 ,0) ) AS ? ontimeorders ,
SUM (? t -? dt ) AS ? del a y
WHERE {
? order : hasPlan ? plan .
? order : has D e liv e r D ate ? dt .
< <? p l an : n eeds P a r tner ? p artne r >>
: h a s Time S t a mp ?t
}
Unsuccessful Recovery: The ultimate goal of the
SC is to deliver finished products to end customers,
yet the result of disruption caused by unplanned
events can be unfulfilled orders as described by (Car-
valho et al., 2012). This metric is the count of the sup-
ply plans where all missing/reduced quantities from
disrupted plans are not provided alternatively i.e.,
Plan isRecoveredBy xsd:string does not exist. This
situation occurs in case there is no alternative ship-
ment mode or there was no strategic stock available
or if there were no substitute suppliers to supply al-
ternatively. Moreover, when we apply S3: Delayed
Recovery if there was no free capacity within the next
five days, we consider this recovery unsuccessful.
Customer Impact: The previous metrics can be
calculated by SC stakeholders to analyze the im-
pact of the disruption on specific customers. Within
customer relationship management paradigm, SC
decision-makers apply recovery strategies in a way to
attempt and reduce the impact of the disruption on
high-priority customers.
6 EVALUATION AND
DISCUSSION
In this section, we simulate the behavior of an ex-
emplary SC under various disruptions scenarios and
evaluate the SC recovery performance.
ICEIS 2022 - 24th International Conference on Enterprise Information Systems
490

Table 2: Resilience evaluation framework.
6.1 Experimental Setup
The following details the experimental setup for the
proposed evaluation.
Supply Chain Structure: We consider a three-tier
SC network consisting of one central node, i.e, an
OEM (Original Equipment Manufacturer) directly
linked to four suppliers in supplier tier 1 and four cus-
tomers in customer tier 1, where C1 is the customer
with the highest priority.
Supply Chain Data: We rely on the data generated
and provided by the synthetic generator described in
the technical report (SC Generator, 2021). We simu-
late 400 orders and their corresponding supply plans,
generated for a time-frame of 178 days, i.e., half a
year.
Disruptions: We simulate the disruptions listed in
Table 1. :Disr1-4 have internal causes, accordingly,
we apply S1: Strategic Stock, S2: Alternative Ship-
ment, S3: Delayed Recovery consecutively. While
:Disr5 and :Disr6 are external, i.e., affecting suppli-
ers, thus we apply S4: Alternative Supplier. Addi-
tionally, we create :Disr7,8 that occur internally and
externally, thus we rely on a combination of the men-
tioned recovery strategies. Moreover, for conciseness,
we show hasDuration which represents the length of
the disruption in days, i.e, hasEndDate minus has-
BeginDate. The OEM in question relies on one trans-
portation mode thus we cannot apply S3: Alternative
Shipment.
6.2 Results
We propose a resilience evaluation framework as
shown in Table 2 that incorporates the disruption char-
acteristics i.e. duration, severity and the number of af-
fected plans. Also, the framework includes the recov-
ery metrics to evaluate the number of non-recovered
plans i.e., unsuccessful recovery, the percentage of
total cost increase and the delay. From the results
in Table 2, we note that applying the strategic stock
Table 3: Customer impact evaluation with C1: customer
with highest priority.
strategy leads to an increase in cost, whereas apply-
ing late recovery leads to delays in delivery. This im-
pact varies based on the duration and the severity of
the disruption as well as the number of affected plans.
For instance, :Disr2 has a duration of one day and a
low severity affecting only two plans, thus the cost
increase and the delays entailed are minimal. How-
ever, :Dis1 and :Disr3 have medium severity and a
duration of three and five days respectively, therefore,
the cost and delay are more significant than in :Disr2.
Likewise, :Disr4 has a high severity and lasts for 45
days affecting 27 plans. Consequently the entailed
cost and delay are higher than the previously men-
tioned disruptions. Also, we note that for :Disr5 and
:Disr6, there is a significant cost increase, since alter-
native suppliers can be more expensive than the firms’
primary suppliers.
In case a disruption affects internally and exter-
nally :Disr7 and :Disr8, there is a cost increase due
to finding alternative suppliers and a delay in case
of later recovery application. (Macdonald and Corsi,
2013) explain that the longer it takes to fully re-
cover, the more expensive the entire recovery process
is likely to be. The delays caused by :Disr8 are bigger
than :Disr7. Thus, the cost increase is greater as with
high severity disruptions, the consequences are more
severe.
In order for stakeholders to make more informed
decisions, they can rely on the customer impact anal-
ysis as shown in Table 3 to examine the correspond-
ing impact on specific customers. Consequently, they
can decide which recovery strategy or combination of
several to apply.
It is important that while applying recovery strate-
gies, orders made by customers with high priorities
whose plans are disrupted, are recovered first. There-
fore, we note that high-priority customers (C1) have
fewer non-recovered plans. Therefore, their corre-
sponding cost increase is higher than low-priority cus-
tomers. Moreover, customers with low priority have
longer delays because more important customers are
recovered before, it might take more time periods to
find the needed quantity to recover.
MARE: Semantic Supply Chain Disruption Management and Resilience Evaluation Framework
491

6.3 Impact and Discussion
MARE is used to simulate the SC behavior under var-
ious disruption scenarios. SC stakeholders can make
informed decisions based on the performance analysis
to redesign into a more resilient SC coping with unex-
pected events. We provide the following managerial
insights:
• Behavior analysis, put forward by MARE, en-
ables SC stakeholders to decide on creating or
modifying existing strategies. In fact, some re-
covery strategies are only applicable in case pre-
implementation approaches are established. For
instance, the OEM in the shown simulation did
not support any alternative shipment mode, and
consequently S3 was not viable. Similarly, a com-
pany can only apply S4: Alternative Supplier
if the company has established a multiple sourc-
ing strategy. Also, the strategic stock recovery
strategy requires the implementation of inventory
management systems as well as replenishment.
Likewise, decision-makers can decide to invest in
extending the maximum capacity saturation to al-
low spare production capacity usable during dis-
ruption (Chen et al., 2021).
• MARE supports supplier exchangeability, thus
the cost increase caused by alternative suppliers
can be reduced by establishing a wide SC where
suppliers are exchangeable. Consequently, the
choice of an alternate source of supply is made
easier in case of a disruption.
• MARE provides SC partners with knowledge
about the impact of changes occurring in the pro-
duction plan. Thus, MARE allows to reach full
information integration to improve the selection
of recovery strategies in future disruption occur-
rences. Also, MARE enhances SC visibility to
mitigate the bullwhip effect.
Nevertheless, MARE is limited as it only consid-
ers external disruptions that affect the supply. While
sudden demand drops or surges can impact the SC
badly if the SC is not equipped with suitable recov-
ery strategies. Moreover, we focus only on recovery
performance, whereas recovery structure and defining
who from the SC stakeholders is responsible and in-
cluded in recovery, can potentially also be considered
as explained by (Macdonald and Corsi, 2013).
7 CONCLUSION AND OUTLOOK
Recent events such as the COVID-19 pandemic, nat-
ural disasters, transportation blockages and politi-
cal tensions resulting in sanctions have revealed the
fragility of our highly globalized and complex SC net-
works. Performance assessment for pre-disruption,
during and post-disruption phases is needed to de-
velop a resilient SC network. Namely, SC integra-
tion, visibility and interoperability are essential for
enriched SC analysis to evaluate the behavior and fa-
cilitate decision making especially during irregular
circumstances. Semantic models enable SC data in-
tegration and thus allow deep analysis while provid-
ing an overall perspective of the SC. Existing seman-
tic DMP approaches address process steps in a rather
isolated manner, i.e., only one step of the process is
incorporated e.g. to model the disruption risk or to
assess its impact.
With MARE we proposed a semantic disrup-
tion management and resilience evaluation frame-
work, aligned with existing DMP approaches, to in-
tegrate heterogeneous data sources (e.g. production
scheduling, order processing), covered by all DMP
steps. MARE relies on an ontology and KG to
M
onitor/Model a disruption. Then, MARE integrates
data from production scheduling and order manage-
ment to Assess, the effect of the disruption on the
SC. Next, MARE examines inventory management,
procurement and suppliers assignment data sources to
uncover various strategies to Recover.
The resilience framework is to Evaluate the effect
of the disruption on the SC in terms of cost, delay
and demand fulfillment. Also, customer-specific met-
rics calculation allows to size the respective impact on
customers.
To ensure and enhance SC resilience, SC stake-
holders can rely on the DMP and resilience evaluation
framework in MARE to extract decisions regarding
SC structure and operational strategies. MARE facil-
itates to grasp, control and ultimately enhance SC be-
havior in complex SC scenarios, tame disruption ac-
celerators e.g. the bullwhip effect and increase the
resilience of the supply network.
The solid MARE framework being openly avail-
able on GitHub (MARE, 2022) can be further ex-
tended to consider disruptions related to demand in-
crease or drops and to examine combinations of re-
covery strategies in the comparison framework. Also,
MARE can be extended to include more recovery
strategies e.g. spare capacity to check if the current
utilization rate of the partner is below the saturation
(Zsidisin and Wagner, 2010).
ICEIS 2022 - 24th International Conference on Enterprise Information Systems
492

REFERENCES
ASCM (2021). Ready for anything? turbulence and the
resilience imperative. The Economist.
Blackhurst, J., Craighead, C. W., Elkins, D., and Handfield,
R. B. (2005). An empirically derived agenda of criti-
cal research issues for managing supply-chain disrup-
tions. International journal of production research,
43(19):4067–4081.
Bugert, N. and Lasch, R. (2018). Supply chain disrup-
tion models: A critical review. Logistics Research,
11(5):1–35.
Burkacky, O., Lingemann, S., and Pototzky, K. (2021).
Coping with the auto-semiconductor shortage: Strate-
gies for success. Technical report, McKinsey & Com-
pany.
Carvalho, H., Cruz-Machado, V., and Tavares, J. G. (2012).
A mapping framework for assessing supply chain re-
silience. International Journal of Logistics Systems
and Management, 12(3):354–373.
Chen, J., Wang, H., and Zhong, R. Y. (2021). A supply
chain disruption recovery strategy considering prod-
uct change under covid-19. Journal of Manufacturing
Systems.
Craighead, C. W., Blackhurst, J., Rungtusanatham, M. J.,
and Handfield, R. B. (2007). The severity of supply
chain disruptions: design characteristics and mitiga-
tion capabilities. Decision sciences, 38(1):131–156.
Emmenegger, S., Laurenzini, E., and Th
¨
onssen, B. (2012).
Improving supply-chain-management based on se-
mantically enriched risk descriptions. In KMIS, pages
70–80.
Hofstetter, J. S. and Grimm, J. H. (2019). Multi-tier sustain-
able supply chain management. In Handbook on the
Sustainable Supply Chain. Edward Elgar Publishing.
Ismail, A. and Ehm, H. (2021). Simulating and evaluating
supply chain disruptions along and end-end semicon-
ductor automotive supply chain amid covid-19 crisis.
In AnyLogic Conference.
Ivanov, D. and Dolgui, A. (2020). A digital supply chain
twin for managing the disruption risks and resilience
in the era of industry 4.0. Production Planning & Con-
trol, pages 1–14.
Jaenichen, F.-M., Liepold, C. J., Ismail, A., Martens, C. J.,
D
¨
orrsam, V., and Ehm, H. (2021). Simulating and
evaluating supply chain disruptions along an end-end
semiconductor automotive supply chain. In Proceed-
ings of the winter simulation conference, volume 1.
IEEE.
Macdonald, J. R. and Corsi, T. M. (2013). Supply
chain disruption management: Severe events, recov-
ery, and performance. Journal of Business Logistics,
34(4):270–288.
MacKenzie, C. A., Barker, K., and Santos, J. R. (2014).
Modeling a severe supply chain disruption and post-
disaster decision making with application to the
japanese earthquake and tsunami. IIE Transactions,
46(12):1243–1260.
MARE (2022). Semantic supply chain disruption manage-
ment. DOI: 10.5281/zenodo.6079007.
Messina, D., Barros, A. C., Soares, A. L., and Matopoulos,
A. (2020). An information management approach for
supply chain disruption recovery. The International
Journal of Logistics Management.
Pal, K. (2019). Integrating heterogeneous enterprise data
using ontology in supply chain management. In Big
Data and Knowledge Sharing in Virtual Organiza-
tions, pages 71–102. IGI Global.
Palmer, C., Urwin, E. N., Niknejad, A., Petrovic, D., Pop-
plewell, K., and Young, R. I. (2018). An ontology
supported risk assessment approach for the intelligent
configuration of supply networks. Journal of Intelli-
gent Manufacturing, 29(5):1005–1030.
Paul, S. K., Asian, S., Goh, M., and Torabi, S. A. (2019).
Managing sudden transportation disruptions in supply
chains under delivery delay and quantity loss. Annals
of Operations Research, 273(1-2):783–814.
Ramzy, N., Auer, S., Chamanara, J., and Ehm, H. (2021).
Sens: Semantic synthetic benchmarking model for in-
tegrated supply chain simulation and analysis. Unpub-
lished.
Sabouhi, F., Pishvaee, M. S., and Jabalameli, M. S. (2018).
Resilient supply chain design under operational and
disruption risks considering quantity discount: A case
study of pharmaceutical supply chain. Computers &
Industrial Engineering, 126:657–672.
Samaranayake, P. (2005). A conceptual framework for sup-
ply chain management: a structural integration. Sup-
ply Chain Management: An International Journal.
Sawik, T. (2019). A multi-portfolio approach to integrated
risk-averse planning in supply chains under disruption
risks. In Handbook of Ripple Effects in the Supply
Chain, pages 35–63. Springer.
SC Generator (2021). Semantic supply chain generator.
DOI: 10.5281/zenodo.5675085.
Simbizi, D., Benabbou, L., and Urli, B. (2021). Systematic
literature reviews in supply chain resilience: A sys-
tematic literature review. In 11th Annual International
Conference on Industrial Engineering and Operations
Management, IEOM 2021, pages 327–340.
Simchi-Levi, D., Schmidt, W., Wei, Y., Zhang, P. Y.,
Combs, K., Ge, Y., Gusikhin, O., Sanders, M., and
Zhang, D. (2015). Identifying risks and mitigating
disruptions in the automotive supply chain. Interfaces,
45(5):375–390.
Singh, C. S., Soni, G., and Badhotiya, G. K. (2019). Perfor-
mance indicators for supply chain resilience: review
and conceptual framework. Journal of Industrial En-
gineering International, 15(1):105–117.
Tomlin, B. and Wang, Y. (2011). Operational strategies
for managing supply chain disruption risk. The hand-
book of integrated risk management in global supply
chains, pages 79–101.
Ye, Y., Yang, D., Jiang, Z., and Tong, L. (2008). Ontology-
based semantic models for supply chain management.
The International Journal of Advanced Manufactur-
ing Technology, 37(11-12):1250–1260.
Zsidisin, G. A. and Wagner, S. M. (2010). Do perceptions
become reality? the moderating role of supply chain
resiliency on disruption occurrence. Journal of busi-
ness logistics, 31(2):1–20.
MARE: Semantic Supply Chain Disruption Management and Resilience Evaluation Framework
493
