
Spectral Classification of Microplastics using Neural Networks: Pilot
Feasibility Study
Petr Dolezel
1 a
, Jiri Rolecek
1 b
, Daniel Honc
1 c
, Dominik Stursa
1 d
and Bruno Baruque Zanon
2 e
1
Faculty of Electrical Engineering and Informatics, University of Pardubice, Studentska 95, Pardubice, Czech Republic
2
Universidad de Burgos Escuela Polit
´
ecnica Superior, Burgos, Castilla y Leon, Spain
Keywords:
Microplastics, FTIR Spectra, Spectroscopy, Neural Network, Deep Learning, Spectra Matching.
Abstract:
Microplastics, i.e. synthetic polymers that have particle size smaller than 5 mm, are emerging pollutants that
are widespread in the environment. In order to monitor environmental pollution by microplastics, it is nec-
essary to have available rapid screening techniques, which provide the accurate information about the quality
(type of polymer) and quantity (amount). Spectroscopy is an indispensable method, if precise classification
of individual polymers in microplastics is required. In order to contribute to the topic of autonomous spectra
matching when using spectroscopy, we decided to demonstrate the quality and efficiency of neural networks.
We adopted three neural network architectures, and we tested them for application to spectra matching. In
order to keep our study transparent, we use publicly available dataset of FTIR spectra. Furthermore, we per-
formed a deep statistical analysis of all the architectures performance and efficiency to show the suitability
of neural networks for spectra matching. The results presented at the end of this article indicated the overall
suitability of the selected neural network architectures for spectra matching in microplastics classification.
1 INTRODUCTION
Plastic pollution has recently become a huge global
problem. Worldwide plastics production reached
about 367 million tons in 2020 (Kaul, 2021). Approx-
imately 80 percent of produced plastic is disposed of
as various kinds of waste (Chen et al., 2021). Plas-
tic waste, that is improperly deposited, can be disin-
tegrated into small pieces by sunlight, heat, physical
abrasion, eventually directing to the particle size of
microplastic (<5mm) (Xu et al., 2022).
These microplastics are receiving big interest
from the scientific community as well as from inter-
national institutions, since the effect of microplastics
on organisms and the environment is not yet clearly
known (Rochman et al., 2013; Katare et al., 2022).
One of the open problems is the issue of mon-
itoring of mikroplastics in environment. Only sev-
eral long-term studies, which examine the evolution
of microplastics pollution over the years, have been
a
https://orcid.org/0000-0002-7359-0764
b
https://orcid.org/0000-0001-5250-7194
c
https://orcid.org/0000-0001-8440-5272
d
https://orcid.org/0000-0002-2324-162X
e
https://orcid.org/0000-0002-4993-204X
performed. This is caused especially due to the time
and resource consuming process of repeated sam-
ple acquisition, laboratory preparation and evaluation.
In some recent studies, the identification and detec-
tion of microplastics is performed by manual visual
counting and sorting under a microscope, based on
color, size, morphology etc. (Hanvey et al., 2017;
Mukhanov et al., 2019). Furthermore, some authors
propose advanced image analysis-based approaches,
which are powerful in case of measuring and count-
ing particles (Lorenzo-Navarro et al., 2020).
However, spectroscopy is an indispensable
method, if precise classification of individual poly-
mers in microplastics is required. Raman and Fourier
transform infrared (FTIR) spectroscopy are the most
common techniques for classifying the polymers in
plastic particles (Cowger et al., 2020). Although both
mentioned techniques provide exceptional accuracy,
the application of them requires a complex sequence
of steps, many of which are performed manually
by default (Cabernard et al., 2018). A crucial step,
which is evaluated manually in most cases, is spectra
matching. Specifically, the Raman or SWIR spectrum
of an examined sample needs to be preprocessed
(filtering, baseline signals removal) and compared
to a reference library of spectra, in order to classify
Dolezel, P., Rolecek, J., Honc, D., Stursa, D. and Zanon, B.
Spectral Classification of Microplastics using Neural Networks: Pilot Feasibility Study.
DOI: 10.5220/0010986900003123
In Proceedings of the 15th International Joint Conference on Biomedical Engineering Systems and Technologies (BIOSTEC 2022) - Volume 4: BIOSIGNALS, pages 283-289
ISBN: 978-989-758-552-4; ISSN: 2184-4305
Copyright
c
2022 by SCITEPRESS – Science and Technology Publications, Lda. All rights reserved
283
the polymer in the sample. Although this process is
simple in theory, it is not easy to automatize it due
to the large variability of the measured spectra. See
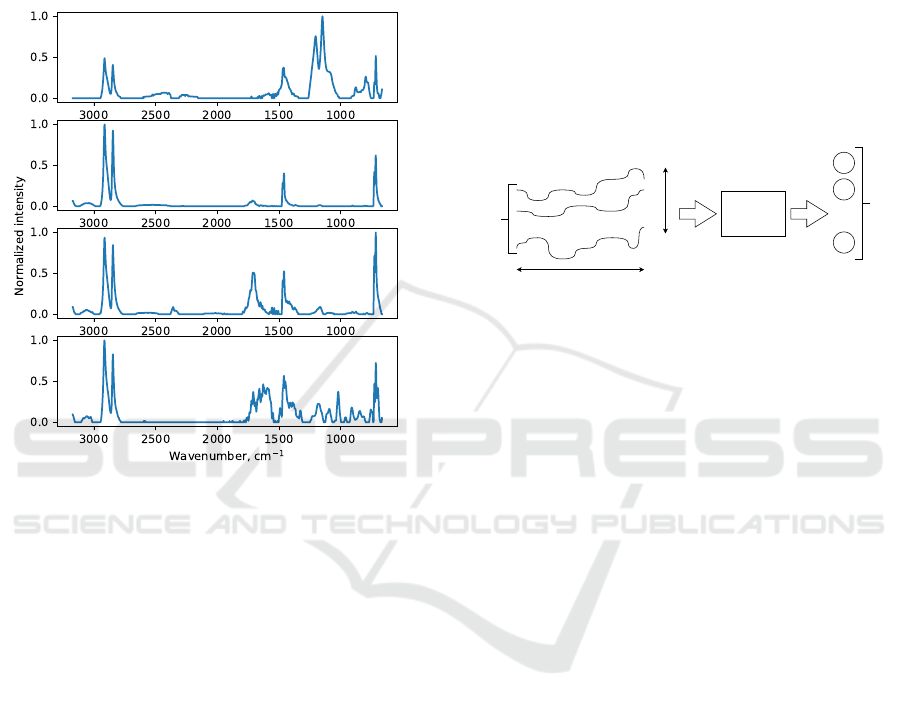
Fig. 1 for four examples of high-density polyethylene
FTIR spectrum measured by the same device. Note
the differences in peak numbers, peak positions and
peak heights.
Figure 1: Four examples of high-density polyethylene FTIR
spectrum measured by the same device. Note the differ-
ences in peak numbers, peak positions and peak heights.
Despite the obvious differences, these spectra should be
evaluated as one class.
Despite the obvious uncertainty of machine eval-
uation, several methods, that aim to replace the man-
ual spectra matching, have been proposed. Lorenzo-
Navarro et al. introduced a multi-step method com-
posed from a segmentation step, feature extrac-
tion and classification. They considered and tested
different feature extractors and classifiers, includ-
ing machine learning and deep learning algorithms
(Lorenzo-Navarro et al., 2020). Alternately, a hybrid
fusion algorithm, that simultaneously combines high-
level fusion with low- and mid-level fusion based on
an ensemble of various classical classifiers, is pro-
posed in (Chabuka and Kalivas, 2020). Finally, the
authors (Cowger et al., 2021) offer a comprehen-
sive software tool, which encapsulates a large num-
ber of tools to process and classify microplastic spec-
tra. Moreover, this tool is ”open source” and can be
rapidly adapted to include new techniques.
In order to contribute to the topic of autonomous
spectra matching, we decided to demonstrate the
quality and efficiency of convolutional neural net-
works (LeCun et al., 1999) and attention mechanism-
based neural networks (Vaswani et al., 2017) for sig-
nal classification. Specifically, we intuitively under-
stand the problem of spectra matching to be very sim-
ilar to time series classification (see Fig. 2). It is
well known that neural networks are a very effective
tool for time series classification (Ismail Fawaz et al.,
2019; Franklin and Muthukumar, 2022; Sikdar et al.,
2022). Although some pilot studies have already con-
sidered convolutional neural networks as a tool for
spectra matching (Ng et al., 2020), it is still open
problem and more analyses have to be performed.
.
.
.
x
1
x
2
x
m
Time series length
Dimensions
.
.
.
Input multivariate time series
Nonlinear
transformation
1
2
.
.
.
k
Probability distribution over k classes
Figure 2: A general framefork for time series classification.
A nonlinear transformation module processes the input time
series and provides the probability of the input time series
belonging to each class.
In this article, we adopt three neural network ar-
chitectures, that have already proven successful for
time series classification, and we test them for ap-
plication to spectra matching. In order to keep our
study transparent, we use publicly available dataset of
FTIR spectra (Chabuka and Kalivas, 2020). Further-
more, we perform a deep statistical analysis of all the
architectures performance and efficiency to show the
suitability of neural networks for spectra matching.
2 MATERIALS AND METHODS
2.1 Neural Network Architectures
Many different architectures, from multilayer percep-
tron to long short-term memory recurrent neural net-
work, have been already more or less successfully
implemented for signal classification. We aimed at
architectures with exceptional performance and ac-
ceptable response time for real-time implementation.
Based on an extensive literature review, we selected
(1) a variant of a fully-convolutional neural network
classifier adapted from (Wang et al., 2017), (2) an
implementation of a multi-scale convolutional neural
network based on (Cui et al., 2016), and (3) an atten-
tion mechanism-based Transformer architecture pre-
sented in (Vaswani et al., 2017).
BIOSIGNALS 2022 - 15th International Conference on Bio-inspired Systems and Signal Processing
284
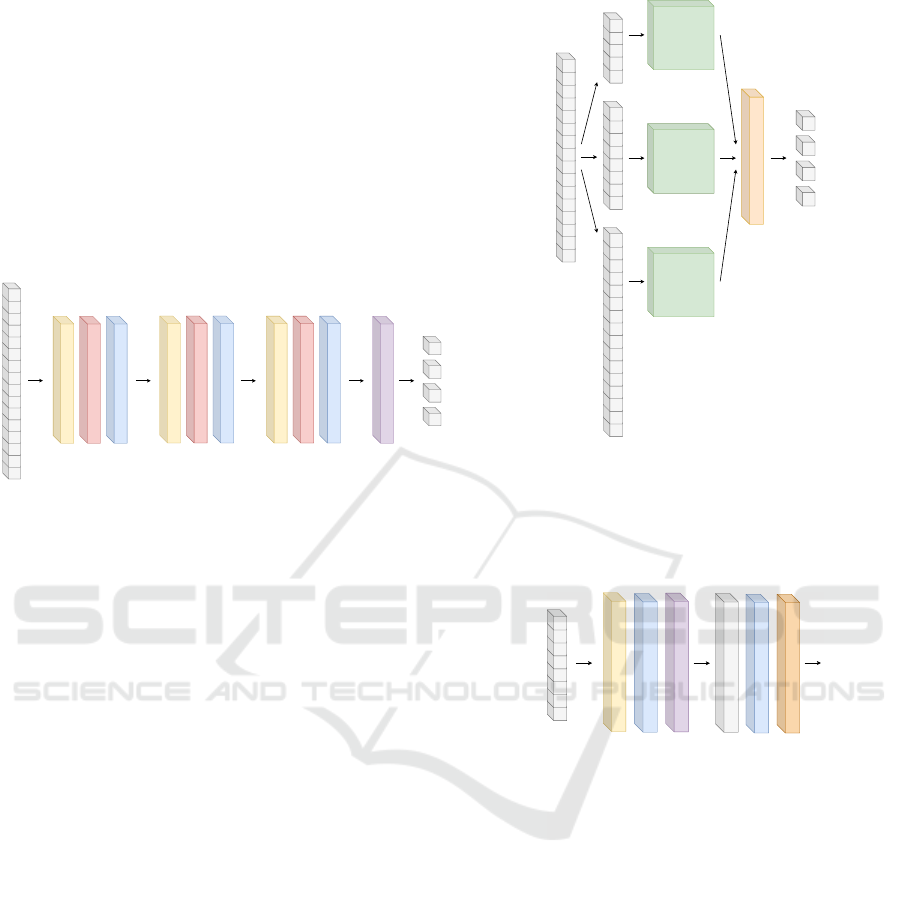
2.1.1 Fully-convolutional Neural Network
Classifier
Fully convolutional neural networks provide
efficiency and quality especially for semantic
segmentation-related issues (Shelhamer et al., 2017).
In this setting, a fully convolutional neural network
is performed as a feature extractor, followed by a
softmax layer. A number of neurons in the softmax
layer is equal to the number of classes. The explicit
graph of this architecture, as used in this contribution,
is depicted in Fig. 3.
Conv1D
64 filters, kernel size 3
ReLU activation
Batch normalization
Conv1D
64 filters, kernel size 3
ReLU activation
Batch normalization
Conv1D
64 filters, kernel size 3
ReLU activation
Batch normalization
Global average pooling
Soft max
FTIR spectrum
Figure 3: Architecture of a selected fully-convolutional
neural network classifier.
2.1.2 Multi-scale Convolutional Neural Network
The multi-scalability of this network consists in its ar-
chitecture. The first part of the architecture works in
three parallel independent branches. Each branch im-
plements a base module to extract features of differ-
ent nature from the input, operating at different fre-
quency scales. The outputs of all branches are con-
catenated and the resulting signal is processed by a
softmax layer. The overall architecture, as we imple-
mented it in our experiments, is depicted Fig. 4. The
architecture of the base module is shown in Fig. 5.
The kernel size of the convolutional layer varies from
8 (the upper module) to 24 (the lower module). The
lower module input is the original FTIR spectrum, the
middle module input is the spectrum downsized to
one half, and the upper module input is the spectrum
downsized to one third of the original.
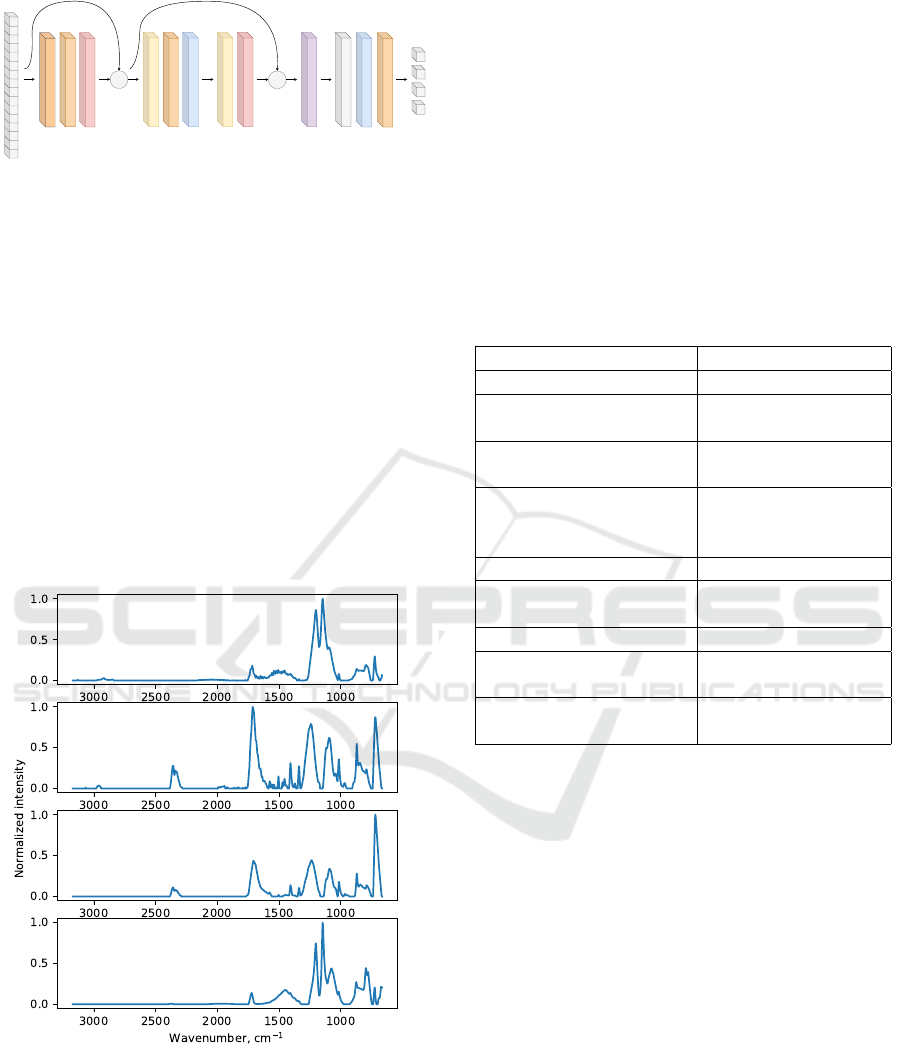
2.1.3 Transformer Architecture
The idea of the Transformer architecture is to propose
a topology based solely on attention mechanisms,
dispensing with recurrence and convolutions entirely
(Vaswani et al., 2017). The architecture was origi-
nally proposed to natural language processing, but it
can be seamlessly adapted to spectra matching. The
FTIR spectrum
Downsampling
Concatenate
Soft max
Base module
Figure 4: Overall architecture of our implementation of a
multi-scale convolutional neural network.
Downsampled FTIR spectrum
Conv1D
10 filters, kernel size [8, 16, 24]
Tanh activation
Global max pooling
Dense, 50 neurons
Tanh activation
Dropout 0.3
Figure 5: Base module for a multi-scale convolutional neu-
ral network.
key part of this architecture is a multi-head attention
layer. Intuitively, this layer allows for attending to
parts of the input sequence in various different ways,
e.g. from the long-term dependency point of view and
the short-term dependency point of view. We imple-
mented a tiny version of this architecture, in order to
keep a comparable size to the other selected architec-
tures - see Fig. 6.
Spectral Classification of Microplastics using Neural Networks: Pilot Feasibility Study
285
FTIR spectrum
Multi head attention
Head size 256, 4 heads
Dropout 0.25
Layer normalization
+
Conv1D
4 filters, kernel size 1
ReLU activation
Dropout 0.25
Conv1D
1 filter, kernel size 1
Layer normalization
+
Global average pooling
Dense, 50 neurons
ReLU activation
Dropout 0.3
Soft max
Figure 6: Our implementation based on the Transformer ar-
chitecture.
2.2 Dataset
We adopted 272 FTIR spectra from (Chabuka and
Kalivas, 2020). These spectra were acquired using
Thermo Nicolet NEXUS 670 FTIR spectrophotome-
ter with spectral resolution 4 cm
−1
. The dataset
includes 137 spectra of high-density polyethylene
(HDPE) and 135 spectra of polyethylene terephtha-
late (PET), i.e. two balanced classes for classification.
Each spectrum consists of 1300 points. Some exam-
ples are shown in Fig. 1 for high-density polyethylene
and in Fig. 7 for polyethylene terephthalate.
Figure 7: Four examples of polyethylene terephthalate
FTIR spectrum.
The dateset was shuffled and divided into train-
ing set (160 samples), validation set (41 samples) and
testing set (71 samples).
2.3 Training Details
The Adam algorithm was selected as an optimizer,
since it is generally considered to provide acceptable
performance in most of the cases (Kingma and Ba,
2014). Sparse categorical crossentropy loss function
was used to evaluate training process. Initial weights
were set randomly with Gaussian distribution. The
training experiments were performed 100 times due
to a stochastic character of training. For each training
session, the instance, which performed best over vali-
dation set, was selected for further evaluation. All the
parameters of the training are summarized in Table 1.
Table 1: Parameters of the training.
Input shape 1300 x 1
Training algorithm Adam algorithm
Loss function Sparse categorical
crossentropy
Number of experiments
for each architecture
100
Initialization Normal distribution
(mean = 0, std =
0.05)
Maximum epochs 500
Stopping criterion Maximum epochs
reached
Initial learning rate α 0.001
Exponential decay rate 1
β
1
0.9
Exponential decay rate 2
β
2
0.999
2.4 Evaluation Metrics
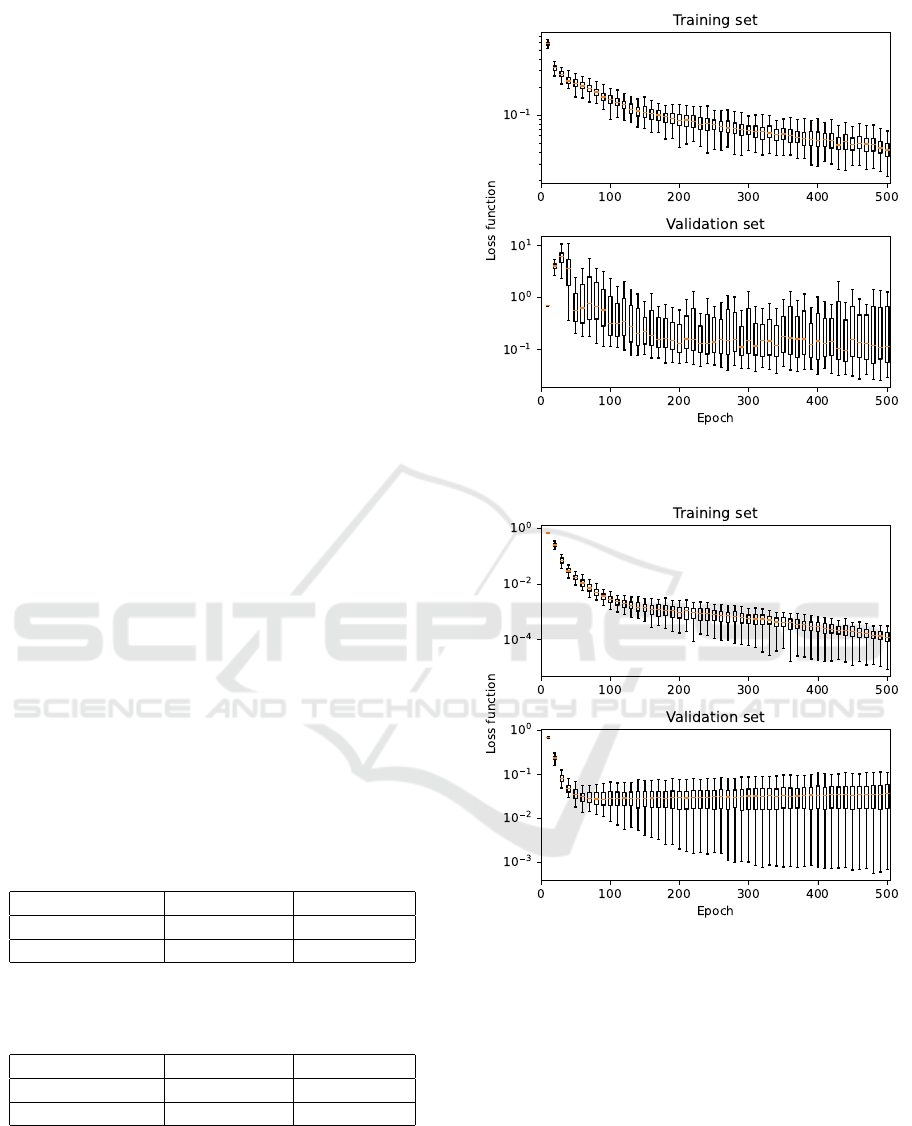
After training of all the considered architectures, ev-
ery network was evaluated. From the training perfor-
mance point of view, the courses of loss function over
the training set and over the validation set during the
training sessions were evaluated. Since 100 distinct
training sessions were performed, the courses were
depicted as sequences of box plots in relation to the
epoch number.
From the classification quality point of view, the
confusion matrix for each architecture was prepared.
Again, the confusion matrix shows the average values
including the standard deviation, since 100 training
sessions for each architecture were performed.
Evaluation of the memory size and response time
is also important, especially if the edge computing
implementation is intended. Therefore, the size of
the neural network architectures and their response
times were also considered. The response times
BIOSIGNALS 2022 - 15th International Conference on Bio-inspired Systems and Signal Processing
286
of of the selected architectures were evaluated on
a personal computer with Intel Core i5-8600K (3.6
GHz) CPU, internal memory 16 GB DDR4 330 (2666
MHz), video card NVIDIA PNY Quadro P5000 16
GB GDDR5 PCIe 3.0. The architectures were im-
plemented using TensorFlow 2.7 using Windows 10
operating system.
3 RESULTS AND DISCUSSION
The selected architectures were trained and vali-
dated 100 times according to the procedure addressed
above. In order to demonstrate training results, the
courses of the sparse categorical cross entropy loss
function over the training set and over the validation
set are depicted in Fig. 8 for the fully-convolutional
neural network classifier, in Fig. 9 for the multi-scale
convolutional neural network, and in Fig. 10 for the
Transformer architecture. The central lines in the box
graphs, shown in the figures, are medians of loss func-
tion current values in relation to the epoch number;
the edges of the boxes are 25
th
and 75
th
percentiles;
and the whiskers extend to the most extreme data
points (except outliers).
Consequently, the confusion matrices for each ar-
chitecture over the testing set are presented in Table 2,
in Table 3, and in Table 4. Each column of the matri-
ces represents the instances in an actual class (HDPE
or PET) while each row represents the instances in a
predicted class. The values in brackets mean the stan-
dard deviation for each value.
Lastly, the sizes and the relative response times
are shown in Table 5.
Table 2: Confusion matrix for the fully-convolutional neu-
ral network classifier. The values in brackets mean the stan-
dard deviation.
HDPE actual PET actual
HDPE predicted 32.95 (0.22) 1.41 (0.71)
PET predicted 0.05 (0.22) 36.59 (0.71)
Table 3: Confusion matrix for the multi-scale convolutional
neural network. The values in brackets mean the standard
deviation.
HDPE actual PET actual
HDPE predicted 33.00 (0.00) 1.35 (0.48)
PET predicted 0.00 (0.00) 36.65 (0.48)
All the presented results indicate the overall suit-
ability of the selected neural network architectures for
spectra matching. Looking at training performances,
the fully-convolutional neural network classifier pro-
vided the slowest learning curve and additionally, the
Figure 8: Training course for the fully-convolutional neural
network classifier.
Figure 9: Training course for the multi-scale convolutional
neural network.
generalization capability of this model was low - the
evaluation over the validation set provided relatively
high values with a large variance. The learning curve
for the other two architectures was steep and stable,
with the Transformer architecture in particular pro-
viding exceptionally good values of loss function over
the validation set, with low variance.
The confusion matrices, which represent perfor-
mance of each architecture over the testing set, pro-
vided results, that correspond with the training per-
formance. The best performance was provided by
the Transformer architecture, where, statistically, the
Spectral Classification of Microplastics using Neural Networks: Pilot Feasibility Study
287
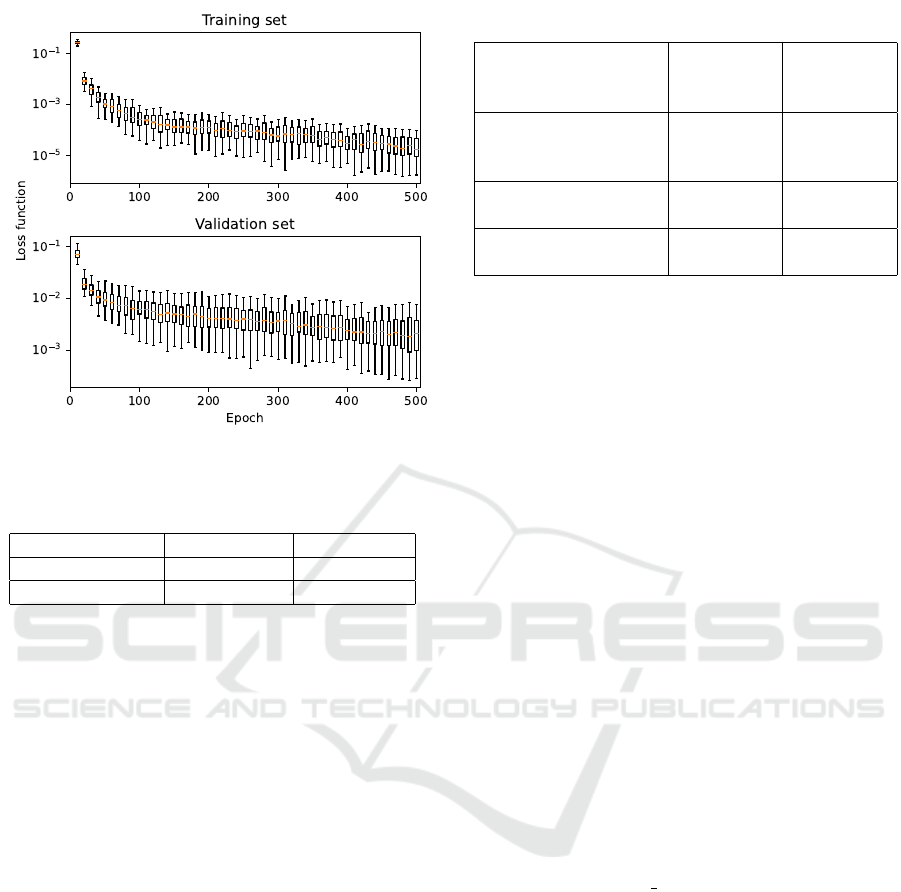
Figure 10: Training course for the Transformer architecture.
Table 4: Confusion matrix for the Transformer architecture.
The values in brackets mean the standard deviation.
HDPE actual PET actual
HDPE predicted 33.00 (0.00) 0.82 (0.38)
PET predicted 0.00 (0.00) 37.18 (0.38)
classifier misclassified less than one spectrum from
the testing set. The other two architectures performed
a little worse. For the Transformer architecture, 18
training sessions (from 100) provided model, that did
classify all the samples in the testing set correctly. For
the other two architectures, each model provided at
least one misclassified sample.
Looking at Table 5, the response times of each
classifier are similar; the multi-scale convolutional
neural network was about 20 percent slower than
the other two architectures. Considering the mem-
ory sizes, all the architectures are smaller than 1 MB.
Hence, they are very lightweight and can be consid-
ered for use in edge computing applications.
4 CONCLUSIONS
In this study, three selected neural network architec-
tures are used to classify microplastics FTIR spec-
tra. Although only a limited dataset with two types of
polymer is used, the results look promising to imple-
ment neural network architecture for spectra match-
ing.
The Transformer architecture was particularly
successful with almost 20 percent of training sessions
providing model, that classifies all the samples in the
testing set correctly.
Table 5: Size and response times.
Architecture Relative
response
time
Size (kB)
Fully-convolutional
neural network
classifier
1.00 372
Multi-scale convolu-
tional neural network
1.18 94
Transformer archi-
tecture
1.05 940
The usage of neural networks for spectra match-
ing generally brings major advantages in compari-
son to classical matching techniques. It greatly re-
duces the number of operations required for prepro-
cessing, is not sensitive to noise and has good general-
ization capability. Moreover, lightweight neural net-
works are characterized by low computational power
requirements, which makes them suitable for use in
edge computing applications, such as portable spec-
troscopes.
In a future study, datasets with more classes are
definitely suggested to be tested in order to justify the
proposed work. With a dataset that covers all the most
common plastics, it will be possible to determine the
optimal neural network architecture with high accu-
racy and efficient response time.
ACKNOWLEDGEMENTS
The work was supported from ERDF/ESF ”Co-
operation in Applied Research between the Uni-
versity of Pardubice and companies, in the Field
of Positioning, Detection and Simulation Tech-
nology for Transport Systems (PosiTrans)” (No.
CZ.02.1.01/0.0/0.0/17 049/0008394).
REFERENCES
Cabernard, L., Roscher, L., Lorenz, C., Gerdts, G., and
Primpke, S. (2018). Comparison of raman and fourier
transform infrared spectroscopy for the quantification
of microplastics in the aquatic environment. En-
vironmental Science and Technology, 52(22):13279–
13288.
Chabuka, B. K. and Kalivas, J. H. (2020). Application of
a Hybrid Fusion Classification Process for Identifi-
cation of Microplastics Based on Fourier Transform
Infrared Spectroscopy. APPLIED SPECTROSCOPY,
74(9):1167–1183.
Chen, Y., Awasthi, A., Wei, F., Tan, Q., and Li, J. (2021).
Single-use plastics: Production, usage, disposal, and
BIOSIGNALS 2022 - 15th International Conference on Bio-inspired Systems and Signal Processing
288

adverse impacts. Science of the Total Environment,
752.
Cowger, W., Gray, A., Christiansen, S., DeFrond, H.,
Deshpande, A., Hemabessiere, L., Lee, E., Mill, L.,
Munno, K., Ossmann, B., Pittroff, M., Rochman, C.,
Sarau, G., Tarby, S., and Primpke, S. (2020). Critical
review of processing and classification techniques for
images and spectra in microplastic research. Applied
Spectroscopy, 74(9):989–1010.
Cowger, W., Steinmetz, Z., Gray, A., Munno, K., Lynch,
J., Hapich, H., Primpke, S., De Frond, H., Rochman,
C., and Herodotou, O. (2021). Microplastic spec-
tral classification needs an open source community:
Open specy to the rescue! Analytical Chemistry,
93(21):7543–7548.
Cui, Z., Chen, W., and Chen, Y. (2016). Multi-scale convo-
lutional neural networks for time series classification.
Franklin, R. and Muthukumar, B. (2022). Arrhythmia and
disease classification based on deep learning tech-
niques. Intelligent Automation and Soft Computing,
31(2):835–851.
Hanvey, J., Lewis, P., Lavers, J., Crosbie, N., Pozo, K., and
Clarke, B. (2017). A review of analytical techniques
for quantifying microplastics in sediments. Analytical
Methods, 9(9):1369–1383.
Ismail Fawaz, H., Forestier, G., Weber, J., Idoumghar, L.,
and Muller, P.-A. (2019). Deep learning for time series
classification: a review. Data Mining and Knowledge
Discovery, 33(4):917–963.
Katare, Y., Singh, P., Sankhla, M., Singhal, M., Jadhav,
E., Parihar, K., Nikalje, B., Trpathi, A., and Bhard-
waj, L. (2022). Microplastics in aquatic environ-
ments: Sources, ecotoxicity, detection and remedi-
ation. Biointerface Research in Applied Chemistry,
12(3):3407–3428.
Kaul, A. (2021). Worldwide plastics produc-
tion falls in 2020 due to covid-19: Report.
https://www.republicworld.com/world-news/global-
event-news/worldwide-plastics-production-falls-
in-2020-due-to-covid-19-report.html. Accessed:
2021-11-23.
Kingma, D. P. and Ba, J. (2014). Adam: A method for
stochastic optimization. CoRR, abs/1412.6980.
LeCun, Y., Haffner, P., Bottou, L., and Bengio, Y. (1999).
Object recognition with gradient-based learning. Lec-
ture Notes in Computer Science (including subseries
Lecture Notes in Artificial Intelligence and Lecture
Notes in Bioinformatics), 1681:319–345.
Lorenzo-Navarro, J., Castrillon-Santana, M., Santesarti, E.,
De Marsico, M., Martinez, I., Raymond, E., Gomez,
M., and Herrera, A. (2020). Smacc: A system for
microplastics automatic counting and classification.
IEEE Access, 8:25249–25261.
Mukhanov, V., Litvinyuk, D., Sakhon, E., Bagaev, A.,
Veerasingam, S., and Venkatachalapathy, R. (2019).
A new method for analyzing microplastic particle size
distribution in marine environmental samples. Eco-
logica Montenegrina, 23:77–86.
Ng, W., Minasny, B., and McBratney, A. (2020). Convolu-
tional neural network for soil microplastic contamina-
tion screening using infrared spectroscopy. Science of
the Total Environment, 702.
Rochman, C., Hoh, E., Kurobe, T., and Teh, S. (2013).
Ingested plastic transfers hazardous chemicals to fish
and induces hepatic stress. Scientific Reports, 3.
Shelhamer, E., Long, J., and Darrell, T. (2017). Fully con-
volutional networks for semantic segmentation. IEEE
Transactions on Pattern Analysis and Machine Intel-
ligence, 39(4):640–651.
Sikdar, S., Liu, D., and Kundu, A. (2022). Acoustic emis-
sion data based deep learning approach for classifica-
tion and detection of damage-sources in a composite
panel. Composites Part B: Engineering, 228.
Vaswani, A., Shazeer, N., Parmar, N., Uszkoreit, J., Jones,
L., Gomez, A., Kaiser, L., and Polosukhin, I. (2017).
Attention is all you need. volume 2017-December,
pages 5999–6009.
Wang, Z., Yan, W., and Oates, T. (2017). Time series clas-
sification from scratch with deep neural networks: A
strong baseline. volume 2017-May, pages 1578–1585.
Xu, L., Han, L., Li, J., Zhang, H., Jones, K., and Xu, E.
(2022). Missing relationship between meso- and mi-
croplastics in adjacent soils and sediments. Journal of
Hazardous Materials, 424.
Spectral Classification of Microplastics using Neural Networks: Pilot Feasibility Study
289
