
Reliability Estimation of a Smart Metering Architecture using a
Monte Carlo Simulation
Tobias Altenburg
a
, Matthias Volk
b
, Daniel Staegemann
c
and Klaus Turowski
Very Large Business Applications Lab, Faculty of Computer Science Otto-von-Guericke University Magdeburg, Germany
Keywords: Internet of Things, Reliability, Smart Meter Architecture, Monte Carlo Simulation, Reliability Block Diagram.
Abstract: The trend of connectivity dominates the technological progress. The number of networked devices is
constantly increasing and the use of smart meters has become more societally relevant. For that reason,
reliability is an important attribute of related architectures. To calculate reliability, it is required to do a
specific analysis for the entire system. This paper describes a structured approach for calculating the reliability
of smart meter architectures considering the limited data availability. For this, we combine Reliability Block
Diagrams with a Monte Carlo simulation. The result is a realistic approximation of the system reliability, that
can be used to evaluate optimization methods.
1 INTRODUCTION
The Internet of Things is the dominating megatrend
in current social change (Kaufmann, 2021). The
number of networked devices and the resulting
volume of data is constantly increasing worldwide.
Until 2025 there will be 75 billion networked devices
worldwide (Statista, 2018) with a data volume of
approximately 80 zettabytes (O'Dea, 2021). The
Internet of Things has become a key technology for
future-oriented scenarios. Driven by Murphy's Law –
“Anything that can go wrong will go wrong”, the
reliability of computer systems is becoming even
more important. The digitalization of civil
infrastructure facilities in particular is becoming
especially relevant to society (BSI, 2020). The
services that are provided like the supply of water or
electricity are increasingly dependent on available
and operating information technology. Smart meters
can record actual consumption data and forward it to
the higher-level systems so that the resulting
transparency can increase grid stability. A fault, an
impairment, or even a complete breakdown can have
a major impact on public safety or other dramatic
consequences (BSI, 2020). The dependency of
modern society on complex information systems,
a
https://orcid.org/0000-0002-1433-4912
b
https://orcid.org/0000-0002-4835-919X
c
https://orcid.org/0000-0001-9957-1003
especially in the above-mentioned infrastructures, is
growing steadily (BSI, 2021). The most significant
part of this is accounted to smart meters. These are
being implemented around the world, inter alia, to
improve the efficiency of power grids for emissions
control (Mordor Intelligence, 2020). The current
trend of electromobility and the resulting increase in
electricity consumption emphasize how important the
digitalization of the energy transition is for society.
Until 2023 the penetration rate of electrical smart
meters in the European Union (EU) is expected to
grow from 44% to 71% (Kochanski, Korczak,&
Skoczkowski, 2020). In order to push that forward,
the German Federal Ministry for Economics and
Energy (BMWi) has published a roadmap for the
ongoing digitalization of the energy transformation in
Germany (BMWi, 2020). This includes a step-by-
step rollout of smart metering systems for electricity,
water, and gas.
The proposed smart metering architecture in
Figure 1 shall being used as a standard for Europe,
which is based on a set of technical and data
protection requirements that are specified in various
official documents (BSI, 2013; BSI, 2014; BSI, 2015;
BSI 2016) of the German Federal Office for
Information Security. The central concept in these
specifications provides a separate unit called the
Altenburg, T., Volk, M., Staegemann, D. and Turowski, K.
Reliability Estimation of a Smart Metering Architecture using a Monte Carlo Simulation.
DOI: 10.5220/0010988100003194
In Proceedings of the 7th International Conference on Internet of Things, Big Data and Security (IoTBDS 2022), pages 47-54
ISBN: 978-989-758-564-7; ISSN: 2184-4976
Copyright
c
2022 by SCITEPRESS – Science and Technology Publications, Lda. All rights reserved
47
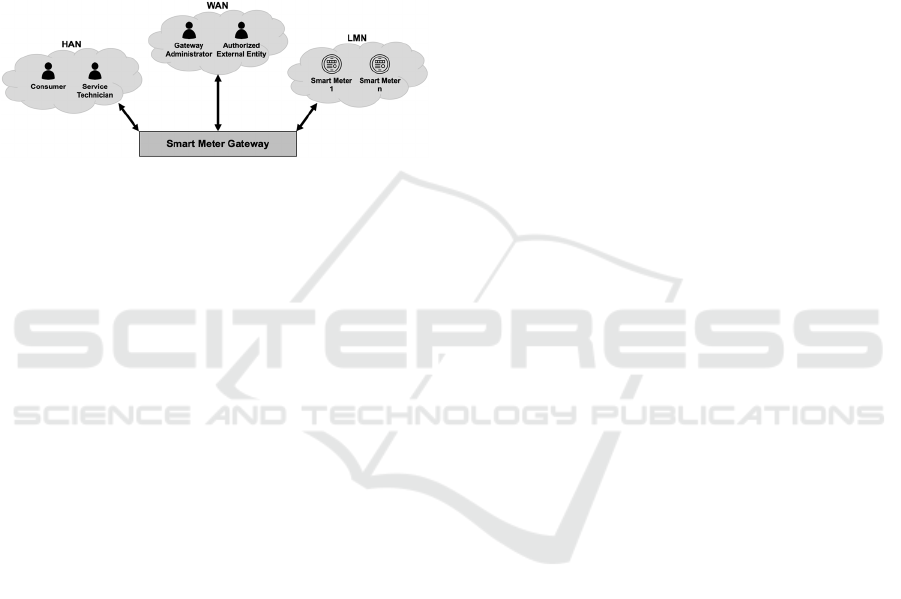
smart meter gateway (SMGW) as a central
communication medium. It provides the interfaces
between the multiple domains and the smart metering
system. Figure 1 shows the schematic architecture.
Until 2032 all consumers in Germany should be
equipped with these modern measuring devices
(BMJV, 2016). The objective of digital data
collection is a more efficient and transparent energy
distribution as well as the sustainable control of
energy production and the overall network utilization
(EY, 2013; Huang, Grahn, Wallnerström,&
Jaakonantti, 2018).
Figure 1: BSI Smart Metering Infrastructure (BSI, 2014).
Hence, the contribution at hand focuses on the
reliability of smart metering architectures. The global
number of smart meters is expected to be
approximately 188 million in 2025 (Mordor
Intelligence, 2020). In Germany, the number of smart
meters is expected to increase to 53 million (BNetzA,
2021). To guarantee the required objectives of this
ecosystem the reliability is a fundamental design goal
(Müller, 2011). Basically, smart metering systems are
more failure-prone than traditional metering devices,
because of the more complex interaction between
hardware and software components (EY, 2013). To
obtain a validated value for the failure probability of
SMGWs and smart meters we screened 5 publicly
available databases and contacted 10 companies.
These 5 companies submitted a response and 2
companies were interviewed on a detailed level. The
investigations and interviews revealed that there are
currently no validated data for the probability of
failure or error. There is currently a lack of general
data from the practice and field level, which can be
explained by the delayed rollout (OVG NRW, 2020).
For the reason that analytical approaches of
general reliability issues at component or system level
were not available the approximative reliability
methods respective Monte Carlo simulation (MCS)
techniques became very popular (Wang,
Broccardo,& Song, 2019). Compared to other
reliability Methods MCS have the advantage of being
accurate and easy to implement. This means that
MCS is applicable for the reliability analysis of a
smart metering architecture. It also enables the
evaluation of the proposed reliability optimization by
using different methods identified in a literature
review (Altenburg, Bosse,& Turowski, 2020). Based
on the previous argumentation we would like to
answer the following research question: “How could
a valid reliability analysis on smart metering
architectures with limited data be facilitated by using
the Monte Carlo simulation?”
To answer the aforementioned research question,
in Section 2 the theoretical basis for reliability theory
and analysis is presented. Then, in Section 3, the
approach for the proposed reliability analysis is
described. The process of reliability simulation and
the presentation of the results are shown in Section 4.
Concluding remarks are given in Section 5 that
summarizes and illustrates the next steps to be taken.
2 FOUNDATIONS
This chapter presents the theoretical basis for the
reliability analysis of a smart metering architecture
that will be performed. The present paper use the
Design Science Research (DSR). A key feature of
DSR is solving social and real-world problems by
constructing and evaluating a scientific artefact (vom
Brocke, Hevner,& Maedche, 2020). Artefacts can be
classified as concepts, models, methods, or
realizations that contribute to a scientifically useful
outcome. According to Pfeffers (2008), the design
science process consists of 6 essential steps, namely
problem identification and motivation, definition of
the objectives for a solution, design and development,
demonstration, evaluation and communication. This
paper describes a practical problem, which can be
solved by a predefined reliability analysis based on
RBD and MCS. This approach will be described and
executed in the following chapters and the result will
be interpreted as well.
2.1 Basics of Reliability
The research field of reliability was formed by Jean-
Claude Laprié. He established a standard framework
and general terminology for reliable and fault-tolerant
systems (Laprié, 1995). According to Bertsche (2008)
and Laprié (1995), Reliability R(t) is defined as “the
probability that a system will perform its functions
satisfactorily and without failures under specified
functional and environmental conditions over a
specified period of time”.
According to a recently conducted literature
review conducted by Altenburg et al. (2020), the
design phase offers the highest potential for reliability
IoTBDS 2022 - 7th International Conference on Internet of Things, Big Data and Security
48
optimization. In order to demonstrate that these
identified methods (Altenburg et al., 2020) will
increase the reliability R(t) of a smart metering
architecture it is necessary to do a validated reliability
analysis. Reliability analysis is a methodical approach
to be able to determine the reliability of a system and
the number of failures. The approach to calculating
the system reliability starts with the design of the
model and ends with the statistical calculation of the
overall reliability (Yuan, Tang, Wang,& Li, 2019). In
the literature, there are several techniques for
quantitative and qualitative analysis of reliability
(Niknafs, Faridkhah,& Kazemi, 2018). The basis for
our approach is a combination of quantitative
methods, because we have limited data as described
aforementioned.
In quantitative methods the Reliability Block
Diagram (RBD) (Bobalo, Seniv, Yakovyna,&
Symets, 2019), the Network Diagram (Ridzuan,
Rusli,& Saad, 2020), Markov Modeling (Aggarwal,
Kumar,& Singh, 2015) and MCS (Wang et al., 2019)
are the most important methods for reliability
analysis. To perform the most exact calculation of
reliability it is also possible to combine these
techniques (Niknafs et al., 2018; Li& Zhang, 2011).
2.2 Reliability Block Diagram and
Monte Carlo Simulation
Our selected evaluation approach, which is detailed
in Section 3, uses RBD to model the overall system
and an MCS to calculate the reliability per
component. RBD is a schematic illustration of the
main components in a system, which represents the
hierarchy and mutual interaction to the overall
function of a system (Niknafs et al., 2018; Raso, de
Vasconcelos, Marques, Soares,& Mesquita, 2017).
After that, we use MCS as a simulation technique.
The execution of an MCS is based on repeated
random sampling and statistical analysis to estimate
results for complex system functions (Harrison, 2010;
Mason et al., 2008). This approximation can be used
to generate realistic results, that we will use for the
reliability analysis of the smart metering architecture.
3 AN APPROACH FOR
RELIABILITY ANALYSIS
To be able to perform a reliability analysis for the
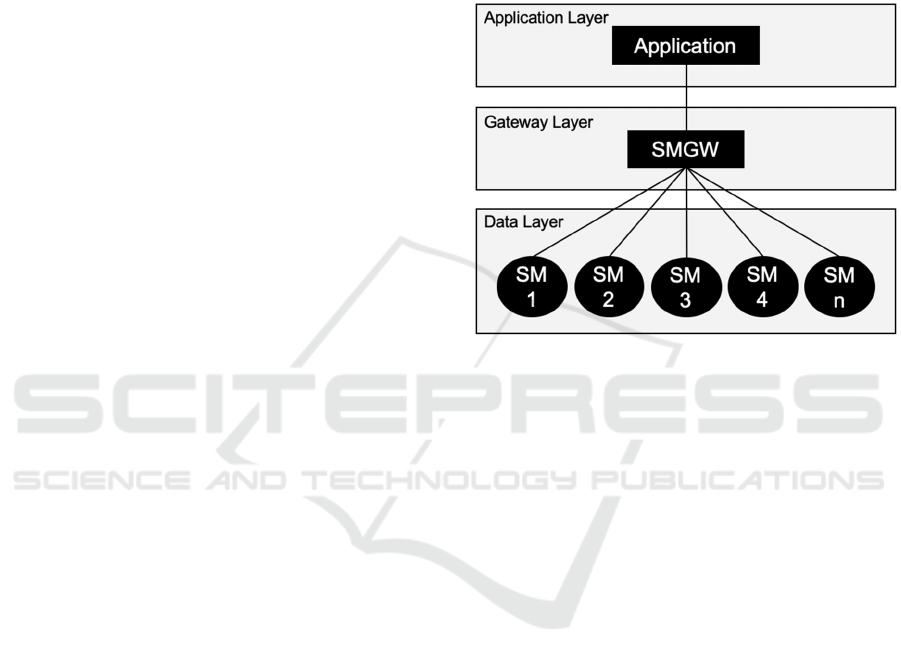
architecture in Figure 1, it is transformed into a
simplified model as shown in Figure 2. The Data
Layer is the equivalent of the Local Metrological
Network (LMN; cf. Figure 1), which includes all the
meters in a home or household and can be connected
or read out by the SMGW in the Gateway Layer
(Henneke, Freudenmann, Wisniewski,& Jasperneite,
2017). We have grouped the Home Area Network
(HAN; cf. Figure 1) and the Wide Area Network
(WAN; cf. Figure 1) into the Application Layer
because meter information can be read or configured
remotely in both domains (Henneke et al., 2017).
Figure 2: Simplified illustration of a smart metering
architecture for reliability analysis.
Figure 2 shows the simplification of the overall
system from Figure 1 into its basic components. We
assume five smart meters in our reliability analysis,
because in the future there will not only be smart
metering for electricity there will be also smart
metering for water or gas consumption. The next step
is to convert the simplified model from Figure 2 into
the logic of the RBD. Depending on the configuration
the failure of any component can trigger the failure of
the whole system, so that the required system
functions are not fulfilled (Ahmeda, Hasana,
Perveza,& Qadirb, 2016). An RBD design can
include three basic component connections, which
can be combined with each other - series connection,
active redundancy or standby redundancy (Ahmeda et
al., 2016). The following Figure 3 transformed into an
RBD from the simplified architecture in Figure 2.
To be able to calculate the quantitative reliability
of the overall system, the failure probabilities of each
component are required. There are currently no
validated data available for the failure probabilities
and the characteristic lifetime of a smart meter or
SMGW. For that reason, we use the failure
probabilities per component and an MCS to simulate
the different values.
Reliability Estimation of a Smart Metering Architecture using a Monte Carlo Simulation
49
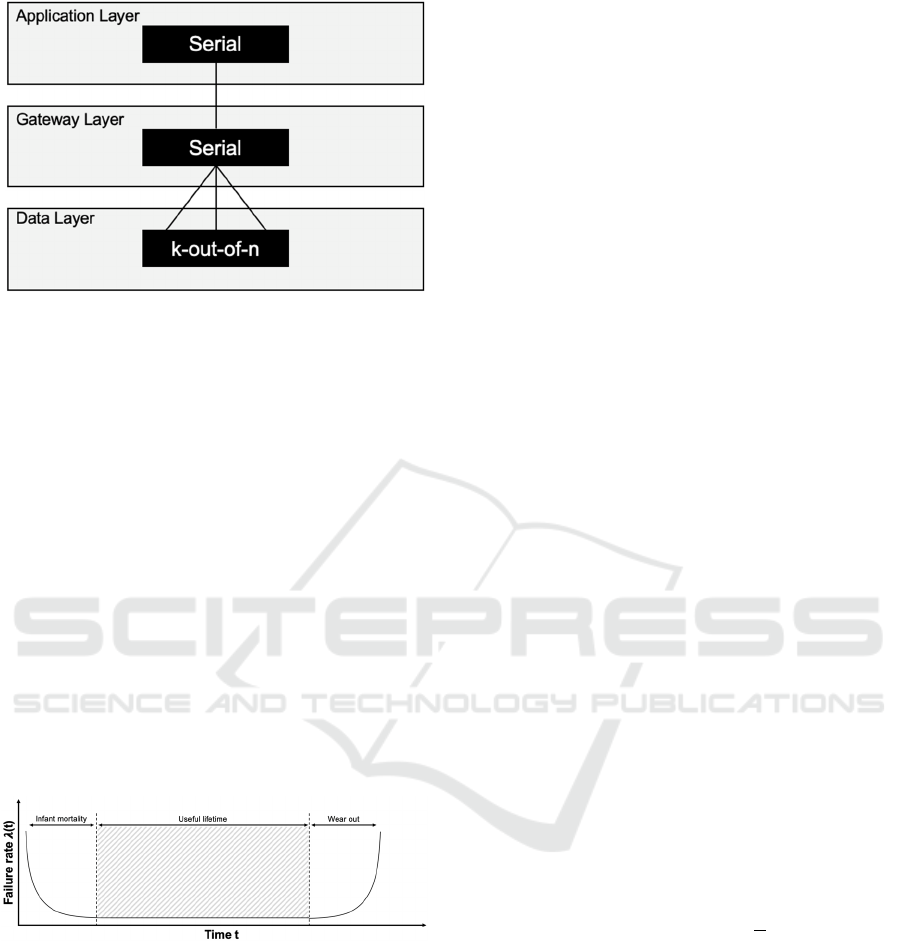
Figure 3: Simulation model based on RBD.
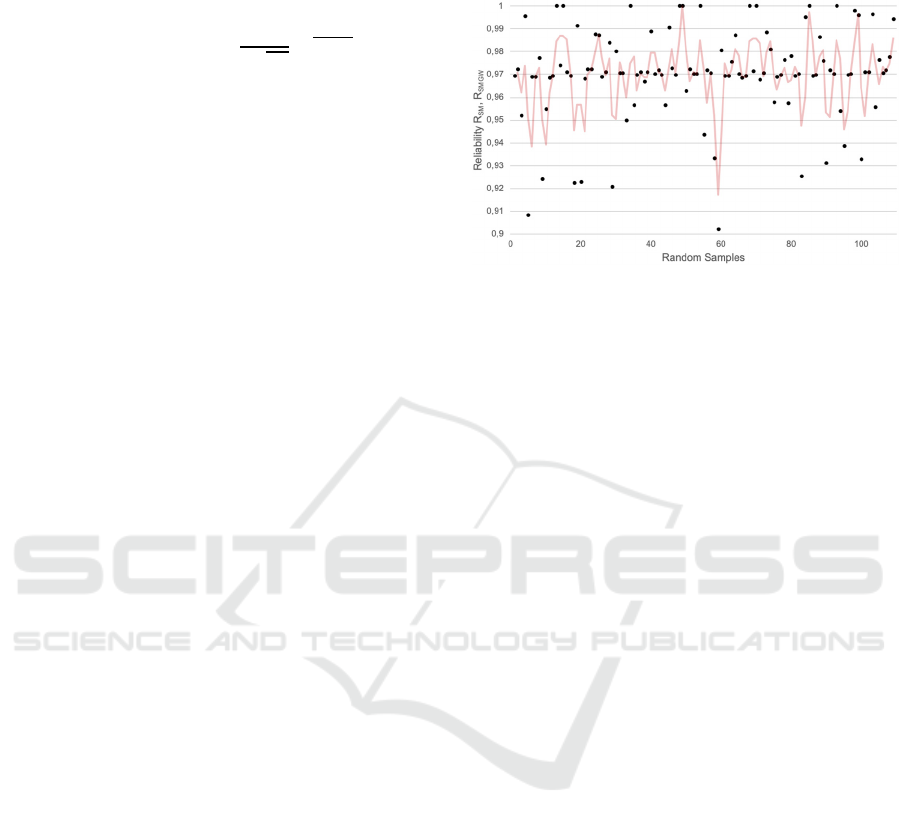
In addition to the architecture, the Time t is an
important factor in the reliability domain, because it
is directly related to the Reliability R(t) (Laprié,
1995). In many practical use cases the reliability level
of an intact component depends mainly on the age
that the component has already reached. The so-
called bathtub curve shown in Figure 4 describes the
generic time course of the Failure Rate λ(t) (Bonart&
Bär, 2020). In the literature, the bathtub curve is
divided into three phases - infant mortality, useful
lifetime and wear out (Bonart& Baer, 2020; Alvarez-
Alvarado& Jayaweera, 2018). Most studies focus on
the useful life period (Li, 2014; Kim, Singh,&
Sprintson, 2015; Li, 2013). In our evaluation, we also
focus on the mid-period of the bathtub curve. In this
phase, the Failure Rate λ(t) is constant, which means
that the focus is on random failures. Furthermore, this
is usually also the longest time phase in the overall
lifetime of a system.
Figure 4: Bathtub curve (Neubeck, 2004).
4 EVALUATION
This section presents our incremental approach to
reliability analysis of a smart metering architecture.
Reliability distributions of systems must be modeled
with suitable mathematical functions to capture the
real world. The bathtub curve can be approximately
described as a sum of Weibull distributions. The
Weibull distribution is one of the most commonly
used reliability techniques because of its versatility.
Its distribution can be used to describe decreasing,
constant and increasing Failure Rates λ(t) in technical
systems. With this, it is possible to model different
failure types and so all phases from the bathtub curve
(Lienig& Brümmer, 2017). Depending on the life
phase of a component, the Weibull distribution can be
an exponential distribution or a logarithmic normal
distribution (Härtler, 2016).
As described in Section 3, the focus of our
reliability analysis is on the useful life phase where
Failure Rates λ(t) are constant. For this case, the
reliability distribution equals an exponential
distribution. The exponential distribution is
commonly used in the development of electronic
systems, because it is sufficiently accurate for
reliability calculations (Lienig& Brümmer, 2017).
This is the foundation for the following Formulas for
reliability calculations (Gelman, Martin, Malcolm,&
Liew, 2021; Ram& Davim, 2018; Dey, Bhale,&
Nandi, 2020):
Reliabilit
y
R
t
e
(1)
4.1 Smart Meter and Smart Meter
Gateway
For an overall reliability analysis, it is necessary to
split the system into independent components.
Because of the high technical similarities between
smart meters and SMGW (EY, 2013; Gährs, Weiß,
Bluhm, Dunkelberg,& Katner, 2021) it is possible to
run a common reliability analysis of the components.
The higher system complexity of smart meter
architectures implicates a higher Failure Probability
G(t) of the system. The typical average for this value
can be set as 2% (EY, 2013; Zhou, Zonghuan,&
Zhonghua, 2021). It serves as the basic for calculating
the Failure Rate λ(t) and the Lifetime t:
𝐹𝑎𝑖𝑙𝑢𝑟𝑒 𝑅𝑎𝑡𝑒
λ
t
1
𝑇
𝐿𝑖𝑓𝑒𝑡𝑖𝑚𝑒 𝑡 𝑇 𝐺𝑡
(2)
Afterward, the e-function can be used, which is an
exponential function with Euler's constant
(Humenberger& Schuppar, 2019) as basis to calculate
the Reliability R(t) for the two components by
Formula (1):
Reliabilit
y
𝑅
𝑡
𝟗𝟖,𝟎𝟐%
(3)
For a more realistic approximation of the
reliability, we use the principle of MCS. The
objective is to repeat the calculation of the Reliability
R(t) many times and to approximate a realistic result
IoTBDS 2022 - 7th International Conference on Internet of Things, Big Data and Security
50
using the law of Large Numbers (Hartbecke&
Schütte, 2005). For this we use the following function
(Ji, 2014):
𝐿𝑖𝑓𝑒𝑡𝑖𝑚𝑒 𝑡
𝑥,𝜇,𝜎
1
𝜎
√
2𝜋
𝑒
𝑥∈
0,1
; 𝜇 2081,52 ℎ; 𝜎 5256 ℎ
(4)
This function returns the percentile for a given
mean and the standard deviation. The parameters for
the reliability calculation are described below:
The parameter x indicates the probability in the
normal distribution and is created by a random
number between 0 and 1.
The parameter μ indicates the arithmetic mean
of the distribution and is the Lifetime t
MC
of our
calculated Reliability R(t) in Formula 3.
It is calculated as follows:
𝐿𝑖𝑓𝑒𝑡𝑖𝑚𝑒 𝑡
12 𝑎 𝑥 1,98%
𝐿𝑖𝑓𝑒𝑡𝑖𝑚𝑒 𝑡
2081,51 ℎ
(5)
The parameter σ indicates the standard deviation
of the distribution, which is empirically defined as 5%
(Zhou et al., 2021) and calculated into the
corresponding Lifetime t
𝜎
.
𝐿𝑖𝑓𝑒𝑡𝑖𝑚𝑒 𝑡
12 𝑎 𝑥 5%
𝐿𝑖𝑓𝑒𝑡𝑖𝑚𝑒 𝑡
5256 ℎ
(6)
The next step is to run Formula 4 for 80.769
random samples each to simulate the Lifetime t(x,μ,σ).
According to the law of Large Numbers (Hartbecke&
Schütte, 2005) and the paper by Liu (2017), we
assume that 80.769 random samples are an optimal
number of trials for the purposed MCS. Each
simulated Lifetime t(x,μ,σ) is now inserted into
Formula 1, so that we obtain the reliability R
SM
and
R
SMGW
for 80.769 smart meters and SMGW. In the
end, we calculate the average of the results and we get
approximately real reliability of the two components:
𝑅𝑒𝑙𝑖𝑎𝑏𝑖𝑙𝑖𝑡𝑦 𝑅
,𝑅
𝟗𝟔,𝟗𝟑% (7)
Figure 5 shows the result of the reliability
calculation based on the procedure described above
and illustrates the smoothed Reliability R
SM
and
R
SMGW
. Because of the large amount of samples only
every 741st random sample is included in the diagram
as these are exactly dividable and so a total of 109
measurements are presented. The red trend line
represents the moving average of the random
samples. As one can note, that the average reliability
of the component varies strongly, because there are
for example some early failures in the reliability
sample or there are also samples without failures.
Figure 5: Smoothed calculation of reliability using an MCS
of 80.769 samples.
4.2 Application
The WAN has the primary impact on system
reliability because it provides the overall information
that is needed to stabilize the grid. The services in the
WAN are operated in a cloud environment (BSI,
2014). To approximate the Reliability R
App
of the
application that is operated in a cloud environment,
we can use the characteristic availability of the three
big cloud providers. This is at least 99.9% (Hauer,
Hoffmann, Lunney, Ardelean,& Diwan, 2020; Wong,
Zavodovski, Corneo, Mohan,& Kangasharju, 2021;
Meinel, Schnjakin, Metzke,& Freitag, 2014) and is
used in section 4.3. with the consolidation of the
results.
4.3 Consolidation of Results
In this section, we will merge the Reliability R
SM
and
R
SMGW
that we determined above from the RBD
model defined in Figure 3 to get the Reliability R
Total
of the overall system. For the smart meters we
assumed a “k-out-of-n” dependency. The objective is
that all of the five smart meters do not fail. Therefore,
the Formula for the Reliability R
SM-Total
is as follows:
𝑅
𝑘,𝑛,𝑅
𝑛
𝑘
𝑅
1 𝑅
𝑘5;𝑛5;𝑅
96,93%
(8)
𝑅
𝑘,𝑛,𝑅
𝟖𝟖,𝟑𝟓%
The following applies for this:
The parameter x indicates the probability in the
normal distribution and is created,
Reliability Estimation of a Smart Metering Architecture using a Monte Carlo Simulation
51

n is the total number of units that are connected
in parallel,
and Reliability R
SM
is the determined reliability
of the smart meter.
The remaining components are connected in
series (see Figure 3). Therefore, there is a
multiplication of the determined reliabilities to
calculate the Reliability R
Total
of the entire system.
𝑅
𝑅
𝑅
𝑅
𝑅
88,35% 96,93% 99,90%
𝑅𝑒𝑙𝑖𝑎𝑏𝑖𝑙𝑖𝑡𝑦 𝑅
𝟖𝟓,𝟓𝟓%
(9)
Eventually past, we can summarize the
calculations in Table 1 and compare them with each
other. It can be seen that the simulated Reliability
R
Total
is about 5% lower than the hypothetical
Reliability R(t). Following the above definition of
reliability according to Bertsche (2008) and Laprié
(1995) the result means that about 15% of smart meter
architectures could fail within the characteristic
lifetime of 12 years. As an example, based on current
forecasts for Germany of approximately 53 million
smart meters (BNetzA, 2021) that would affect nearly
660,000 metering installations per year just for
Germany in particular. In order to counteract this, it
is necessary to increase the reliability of smart meters
and smart meter gateways in particular. The design
phase offers the greatest potential for reliability
optimization (Altenburg et al., 2020). This is where
the diverse methods for reliability optimization can
already be implemented at the beginning and used
with sustainable benefits.
Table 1: Comparison of hypothetical and simulated
reliability.
5 CONCLUSION AND FUTURE
WORK
This paper presented a structured reliability analysis.
The theoretical foundations and the methodological
approach were presented at the beginning. After that,
we calculated the reliability of a smart meter
architecture based on a limited data set using an RBD
and an MCS. The result is a realistic reliability
evaluation of the analyzed overall system. Our
performed approximation demonstrates the need for
reliability optimization in the context of smart meter
architectures. Furthermore, the presented approach
answers our aforementioned research question and
verifies that the reliability of a smart metering
architecture can be calculated with the help of an
MCS for a limited dataset.
The largest optimization potential includes the
design phase of a system (Altenburg et al., 2020). We
will consolidate popular methods from the literature
into efficient design strategies. This will provide a
standard framework that can be used for reliability
optimization. Based on our presented approach it is
possible to validate the defined design strategies.
REFERENCES
Aggarwal, A.K., Kumar, S., Singh, V. (2015). Markov
modeling and reliability analysis of urea synthesis
system of a fertilizer plant. Journal of Industrial
Engineering International 11, 1-14.
Ahmeda, W., Hasana, O., Perveza, U., Qadirb, J. (2016).
Reliability Modeling and Analysis of Communication
Networks. Journal of Network and Computer
Applications, Volume 78, 191-215.
Altenburg, T., Bosse, S., Turowski, K. (2020). Safety in
distributed sensor networks – A literature Review. 5th
International Conference on Internet of Things, Big
Data and Security - IoTBDS, 161-168.
Alvarez-Alvarado, M.S., Jayaweera, D. (2018). Bathtub
curve as a Markovian process to describe the reliability
of repairable components. The Institution of
Engineering and Technology, Vol. 12, 5683-5689.
Bertsche, B., 2008. Reliability in Automotive and
Mechanical Engineering. Springer, 45–57.
Bobalo Y., Seniv M., Yakovyna V., Symets I. (2019).
Method of Reliability Block Diagram Visualization and
Automated Construction of Technical System
Operability Condition. CSIT 2018, vol. 871, Springer.
Bonart, Th., Bär, J. (2020). Quantitative
Betriebswirtschaftslehre Band II – Marketing und
Marktforschung, technische Zuverlässigkeit. Springer
Gabler, 1. Auflage, 242-280.
BMJV (Bundesministerium der Justiz und für
Verbraucherschutz) (2016). Gesetz über den
Messstellenbetrieb und die Datenkommunikation in
intelligenten Energienetzen, Messstellenbetriebsgesetz
- MsbG, §29.
BMWi (Bundesministerium für Wirtschaft und Energie)
(2020). Fahrplan für die weitere Digitalisierung der
Energiewende. Retrieved on November 20, 2021, from
https://www.bmwi.de/Redaktion/DE/Downloads/F/fah
rplan-fuer-die-weitere-digitalisierung-der-energie
wende.pdf
BNetzA (Bundesnetzagentur für Elektrizität, Gas,
Telekommunikation, Post und Eisenbahnen) (2021).
Monitoringbericht 2020, 305.
BSI (Bundesamt für Sicherheit in der Informationstechnik)
(2020). Die Lage der IT-Sicherheit in Deutschland
IoTBDS 2022 - 7th International Conference on Internet of Things, Big Data and Security
52

2020. Retrieved on November 20, 2021, from
https://www.bsi.bund.de/SharedDocs/Downloads/DE/
BSI/Publikationen/Lageberichte/Lagebericht2020.pdfb
si.bund.de.
BSI (Bundesamt für Sicherheit in der Informationstechnik)
(2021). IT-Sicherheitsgesetz, Bundesgesetzblatt Teil I
Nr.31, §8.
BSI (Bundesamt für Sicherheit in der Informationstechnik)
(2015). Protection profile for the security module of a
smart metering system–common criteria protection
profile BSI-CC-PP- 0077-V2-2015. Retrieved on
November 20, 2021, from https://www.bsi.bund.de/
SharedDocs/Zertifikate_CC/PP/aktuell/PP_0077+V2.h
tml.
BSI (Bundesamt für Sicherheit in der Informationstechnik)
(2014). Protection profile for the gateway of a smart
metering system–common criteria protection profile
BSI-CC- PP-0073-2014. Retrieved on November 20,
2021, from https://www.bsi.bund.de/SharedDocs/
Zertifikate_CC/PP/aktuell/PP_0073.html
BSI (Bundesamt für Sicherheit in der Informationstechnik)
(2021). Anforderungen an die Interoperabilität der
Kommunikationseinheit eines intelligenten
Messsystems (BSI TR- 03109-1). Retrieved on
November 20, 2021, from https://www.bsi.bund.de/
SharedDocs/Downloads/DE/BSI/Publikationen/Techni
scheRichtlinien/TR03109/TR03109-1.pdf
BSI (Bundesamt für Sicherheit in der Informationstechnik)
(2021). Anforderungen an die Funktionalität und
Interoperabilität Sicherheitsmoduls (BSI TR-03116-2).
Retrieved on November 20, 2021, from
https://www.bsi.bund.de/SharedDocs/Downloads/DE/
BSI/Publikationen/TechnischeRichtlinien/TR03116/B
SI-TR-03116-3.pdf
BSI (Bundesamt für Sicherheit in der Informationstechnik)
(2014). Kryptographische Vorgaben für die
Infrastruktur von intelligenten Messsystemen (BSI TR-
03109-3). Retrieved on November 20, 2021, from
https://www.bsi.bund.de/SharedDocs/Downloads/DE/
BSI/Publikationen/TechnischeRichtlinien/TR03109/T
R-03109-3_Kryptographische_Vorgaben.pdf
BSI (Bundesamt für Sicherheit in der Informationstechnik)
(2017). Smart Metering PKI–Public Key Infrastructure
für Smart Meter Gateways (BSI TR-03109-4).
Retrieved on November 20, 2021, from
https://www.bsi.bund.de/SharedDocs/Downloads/DE/
BSI/Publikationen/TechnischeRichtlinien/TR03109/T
R-03109-4_PKI.pdf
BSI (Bundesamt für Sicherheit in der Informationstechnik)
(2015). Smart Meter Gateway Administration (BSI TR-
03109-6). Retrieved on November 20, 2021, from
https://www.bsi.bund.de/SharedDocs/Downloads/DE/
BSI/Publikationen/TechnischeRichtlinien/TR03109/T
R-03109-6-Smart_Meter_Gateway_Administration.
html
BSI (Bundesamt für Sicherheit in der Informationstechnik)
(2021). Certificate Policy für die Smart-Meter-PKI.
Retrieved on November 20, 2021, from
https://www.bsi.bund.de/SharedDocs/Downloads/DE/
BSI/Publikationen/TechnischeRichtlinien/TR03109/P
KI_Certificate_Policy.pdf
Dey, S., Bhale, P., Nandi, S. (2020). ReFIT: Reliability
Challenges and Failure Rate Mitigation Techniques for
IoT Systems. I4CS, Springer International Publishing,
123-142.
Ernst & Young GmbH (2013). Kosten-Nutzen-Analyse für
einen flächendeckenden Einsatz intelligenter Zähler.
Gelman, L., Martin, N., Malcolm, A., Liew, E. (2021).
Advances in Condition Monitoring and Structural
Health Monitoring. WCCM 2019, Springer
International Publishing, 325-332.
Gährs, S., Weiß, J., Bluhm, H., Dunkelberg, E., Katner, J.
(2021). Erkenntnisse zu Umweltwirkungen von Smart
Metern - Erfahrungen aus dem Einsatz von Smart
Meter in Europa. Institut für ökologische
Wirtschaftsforschung, Berlin.
Harrison, R. L. (2010). Introduction to Monte Carlo
Simulation. AIP Conference Proceedings, 17-21.
Hartbecke, K., Schütte, C. (2005). Gesetze der Natur.
Historische und systematische Perspektiven. Mentis
Verlag, 291-317.
Hauer, T., Hoffmann, P., Lunney, J., Ardelean, D., Diwan,
A. (2020). Meaningful Availability. NSDI.
Henneke, D., Freudenmann, Ch., Wisniewski, L.,
Jasperneite, J. (2017). Implementation of Industrial
Cloud Applications as Controlled Local Systems (CLS)
in a Smart Grid Context. 22nd IEEE International
Conference on Emerging Technologies and Factory
Automation (ETFA), 1-7.
Huang, Y., Grahn, E., Wallnerström, C.J., Jaakonantti, L.
(2018). Smart meters in Sweden – lessons learned and
new regulations.
Humenberger, H., Schuppar, B. (2019). Mit Funktionen
Zusammenhänge und Veränderungen beschreiben -
Mathematik Primarstufe und Sekundarstufe I + II.
Springer-Verlag GmbH Deutschland, 75-118.
Härtler G. (2016). Wahrscheinlichkeitsmodelle der
Zuverlässigkeit- Statistik für Ausfalldaten. Springer
Spektrum, Berlin, 49-68.
Ji, X. (2014). Normal Inverse Function in teaching
inference about population mean and population
proportion. 9th International Conference on Teaching
Statistics (ICOTS9), USA.
Kaufmann, T. (2021). Megatrend- und Technologieanalyse
In: Strategiewerkzeuge aus der Praxis. Springer Gabler,
Berlin, 29-26.
Kim, H., Singh, C., Sprintson, A. (2015). Using clustering
to evaluate reliability of composite power systems. 18th
International Conference on Intelligent System
Application to Power Systems (ISAP), 1–7.
Kochanski, M., Korczak, K., Skoczkowski, T. (2020).
Technology Innovation System Analysis of Electricity
Smart Metering in the European Union. Energies 2020,
MDPI.
Laprié, J. C. (1995). Dependable Computing: Concepts,
Limits, Challenges. 25th IEEE International
Symposium on Fault-Tolerant Computing, 42-54.
Li, G., Zhang, K. (2011). A combined reliability analysis
approach with dimension reduction method and
Reliability Estimation of a Smart Metering Architecture using a Monte Carlo Simulation
53

maximum entropy method. Structural and
Multidisciplinary Optimization, Vol. 43, Springer,
121–134.
Li, W. (2014). Risk assessment of power systems: models,
methods, and applications. John Wiley & Sons, New
York, USA.
Li, W. (2013). Reliability assessment of electric power
systems using Monte Carlo methods. Springer Science
& Business Media, New York.
Lienig, J., Brümmer, H. (2017). Fundamentals of
Electronic Systems Design. Springer International
Publishing, 45-73.
Liu, M. (2017). Optimal number of trials for monte carlo
simulation. VRC, Value Research Report.
Mason, S. J., Hill, R. R., Mönch, L., Rose, O., Jefferson, T.,
Fowler, J. W. (2008). Introduction to Monte Carlo
Simulation. Winter Simulation Conference, 677-688.
Meinel, Ch., Schnjakin, M., Metzke, T., Freitag, M. (2014).
Anbieter von Cloud Speicherdiensten im Überblick.
Technische Berichte des Hasso-Plattner-Instituts für
Softwaresystemtechnik, vol. 84, 10-12.
Mordor Intelligence LLP (2020). Global Smart Meters
Market - Growth, Trends, Forecasts (2020 - 2025).
Müller, K.J. (2011). Sicherheit im Smart Grid, 18. DFN-
Workshop „Sicherheit in vernetzten Systemen“.
Neubeck, K. (2004). Practical Reliability Analysis. Pearson
Prentice Hall, New Jersey, USA.
Niknafs, H., Faridkhah, M., Kazemi, C. (2018). Analytical
Approach to Product Reliability Estimation Based on
Life Test Data for an Automotive Clutch System.
Mechanics and Mechanical Engineering Vol. 22, 845-
863.
O’Dea, S. (2021). Data volume of internet of things (IoT)
connections worldwide in 2019 and 2025. Retrieved on
November 20, 2021, from https://www.statista.com/
statistics/1017863/worldwide-iot- connected-devices-
data-size.
OVG Nordrhein-Westfalen, Decision from 04.03.2021. Az
21 B 1162/20.
Peffers, K., Tuunanen, T., Rothenberger, M.A., Chatterjee,
S. (2008). A Design Science Research Methodology for
Information Systems Research. Journal of Management
Information Systems, vol. 24 no. 3, 45-77.
Ram, M., Davim, J.P. (2018). Diagnostic Techniques in
Industrial Engineering. Springer International
Publishing, pp. 207-231.
Raso, A., de Vasconcelos, V., Marques, R., Soares, W.,
Mesquita, A. (2017). Use of reliability engineering
tools in safety and risk assessment of nuclear facilities.
International Nuclear Atlantic Conference – INAC.
Ridzuan, M. I. M., Rusli, M. A. Z., Saad, N. M. (2020).
Reliability Performance of Low Voltage (LV) Network
Configuration. Springer, 783-793.
Statista (2018). Internet of Things (IoT) connected devices
installed base worldwide from 2015 to 2025 (in
billions). Retrieved on November 20, 2021, from
https://www.statista.com/statistics/471264/iot-number-
of-connected- devices-worldwide/.
vom Brocke, J., Hevner, A., Maedche, A. (2020).
Introduction to Design Science Research. In: Design
Science Research, Springer, Cham.
Wang, Z., Broccardo, M., Song, J. (2019). Hamiltonian
Monte Carlo methods for Subset Simulation in
reliability analysis. Structural Safety, Volume 76, 51-
67.
Wong, W., Zavodovski, A., Corneo, L., Mohan, N.,
Kangasharju, J. (2021). SPA: Harnessing Availability
in the AWS Spot Market. Conference on Computer
Communications Workshops.
Yuan, R., Tang, M., Wang, H., Li, H. (2019). A Reliability
Analysis Method of Accelerated Performance
Degradation Based on Bayesian Strategy. IEEE
Access, vol. 7, 169047-169054.
Zhou, J., Zonghuan, W., Zhonghua, Y. (2021). Research on
the Reliability Allocation Method of Smart Meters
Based on DEA and DBN. Applied Sciences 11, no. 15:
6901.
IoTBDS 2022 - 7th International Conference on Internet of Things, Big Data and Security
54
