
Simulating Weather Events on a Real-world Map using Unity 3D
Hamza Noueihed, Heba Harb and Joe Tekli
a
Department of Electrical and Computer Engineering, School of Engineering,
Lebanese American University (LAU), 36 Byblos, Lebanon
Keywords: Simulator Modelling, Unity 3D, Virtual Sensors, Semantic Sensor Network, Weather Events.
Abstract: During the past decade, 3D simulation models have gained importance in the development of software
solutions that aim to mimic real-world events and phenomena with increasing levels of accuracy and detail.
In this paper, we introduce VOWES, a Virtual Outdoor Weather Event Simulator to replicate and measure
outdoor weather events in vivid 3D visualizations. We make use of the Unity 3D engine to build the simulator
environment and its virtual sensors, and integrate the Mapbox SDK and the WeatherStack API for realistic
real-world weather mapping. We have conducted a large battery of experiments involving 30 human testers,
considering various evaluation criteria. Results highlight VOWES’ quality and performance, and its ability to
simulate complex weather environments with large numbers of sensors and weather phenomena.
1 INTRODUCTION
With the rising interest in creating realistic and vivid
simulations, 3D models have been gaining increasing
importance in the development of software solutions
that aim to mimic real-world events and phenomena.
Simulation modelling allows creating and analysing
the behaviour of a digital prototype system
representing a physical real-world entity, aiming to
study and predict the latter’s behaviour and
performance in the real-world (Garcia-Dorado I. et al.
2017). Simulation software has become one of the
most commonly used techniques for virtual
demonstrations in different fields, especially 3D
models used to simulate real-world structures,
objects, and events, with increasing levels of accuracy
and detail, e.g., (Li X. et al. 2019, Zigon B. et al.
2018, Garcia-Dorado I. et al. 2017).
In this paper, we introduce VOWES, a Virtual
Outdoor Weather Event Simulator to represent
outdoor weather events and data in vivid 3D
visualizations. It is designed as a digital twin solution
to describe and replicate weather measurements,
events, sensors, and their properties from the real-
world, into a software simulation environment. We
make use of the Unity 3D engine to build and design
the simulator environment and its virtual sensors. We
develop special visualizations and behaviours to
a
https://orcid.org/0000-0003-3441-7974
present weather measurements, events, and sensors as
visible 3D structures with specifications controllable
by the user. We utilize the Mapbox SDK (MapBox
2021) to import high-resolution world maps showing
countries, cities, and buildings. In addition, we utilize
the WeatherStack API (WeatherStack 2021) to
capture real-time weather measurements and
conditions from the geographic area that is being
simulated and integrate them in the simulation
environment to allow for more realistic and accurate
simulations. Qualitative and performance evaluations
highlight the potential of the tool.
In the following, Section 2 reviews related
works. Section 3 describes the VOWES simulation
tool. Section 4 describes the experimental evaluation,
before concluding in Section 5 with future directions.
2 RELATED WORKS
With the rising interest in creating realistic and vivid
models, Unity 3D has been gaining increasing
importance as a powerful tool for the creation of 3D
visualizations, functions, and attributes, and their
integration with dedicated processing features and
metric measurements to achieve accurate outputs and
analyses. Unity is a cross-platform game engine
developed by Unity Technologies, which was
86
Noueihed, H., Harb, H. and Tekli, J.
Simulating Weather Events on a Real-world Map using Unity 3D.
DOI: 10.5220/0010989000003203
In Proceedings of the 11th International Conference on Smart Cities and Green ICT Systems (SMARTGREENS 2022), pages 86-93
ISBN: 978-989-758-572-2; ISSN: 2184-4968
Copyright
c
2022 by SCITEPRESS – Science and Technology Publications, Lda. All rights reserved

announced and released in June 2005 at Apple Inc.'s
Worldwide Developers Conference as a Mac OS X-
exclusive game engine. Starting in 2018, the engine
has been extended to support more than 25 platforms
for creating two-dimensional (2D), three-dimensional
(3D), augmented reality, and virtual reality games.
Also, the Unity engine has been used for simulations
in various fields including architecture, engineering,
automotive, and construction, e.g., (Sanders B. et al.
2020, Sun L. et al. 2020, Wang R. et al. 2020). One
of its distinctive features is the power of its real-time
3D rendering, making it one of the world’s leading
real-time development platforms (Unity).
In this context, several Unity 3D-based
simulation solutions have been developed in the
literature. In (Wazir H. and Annaz F. 2015), the
authors design a Unity-3D simulator to help navigate
unmanned aerial vehicles (UAVs). The latter is
coupled with sensors and physical hardware allowing
to collect data from the UAV’s surrounding
environment and feeding it into the virtual simulation
for processing and analysis. The authors emphasize
the importance of Unity 3D in presenting a realistic
and precise model while tracing the performance of
UAVs in the real-world. In (Buyuksalih I. et al.
2017), the authors develop a Unity 3D virtual
environment to study the properties and potential
prospects of using solar energy on buildings in a
highly populated urban area. They mimic building
structured using dedicated 3D visualizations, and
mimic solar energy measurements based on values
and calculations accumulated from a real world urban
area in the city of Istanbul. The authors specifically
address the challenge of attaining high accuracy in
predicting solar energy outcomes with the influence
of the buildings’ shadow casting. The authors extend
their simulated environment to represent and study
the underground utility systems in the city, where the
whole city map is translated into a dedicated
underground 3D model. In (Jain V. and Mahdavi A.
2016), the authors design and integrate virtual sensors
to measure light conditions in both indoor and
outdoor environments. They focus on monitoring
daylight conditions and design artificial light sources
to map different sunlight conditions in the real world.
They accumulate measurements from real sensors
and map the data to the virtual sensors to create
realistic conditions in the virtual environment. The
authors utilize dedicated CAD software to create both
indoor and outdoor environments with high degrees
of precision and accuracy. Unity 3D is used to
animate the CAD environment and handle light
condition variations and sensor simulations. In
(Wazir H. and Annaz F. 2015), the authors show how
environmental events, such as fire, can be
demonstrated in a 3D manner. They attempt to imitate
real-life scenarios and study the level of stress that
different people might face in simulating different
kinds of fire events. The authors highlight the
capabilities of Unity 3D in visualizing and animating
complex objects and events such as fire, flame,
smoke, and their propagation.
3 VOWES SIMULATION TOOL
We design and develop our VOWES simulation tool
using the Unity 3D game engine to build the
environment and its virtual sensors, and integrate
them with real-world 3D maps and a weather API for
realistic weather mapping. We develop special
visualizations and behaviours to present weather
measurements, events, and sensors as visible 3D
structures with specifications controllable by the user.
The following subsections describe the main
components of our simulator tool.
3.1 Virtual 3D World
To achieve a realistic 3D simulation of outdoor
environmental events and measurements, we use
Unity’s flexibility in integrating third-party APIs to
acquire dynamic 3D maps and real-world weather
measurements. More specifically we utilize the
Mapbox SDK (MapBox 2021) to import high-
resolution world maps showing countries, cities, and
buildings, and we integrate the WeatherStack API
(WeatherStack 2021) to capture real-time weather
measurements and conditions from the geographic
area that is being simulated.
Mapbox offers APIs, SDKs, and live-updating
map data, allowing to build better mapping,
navigation, and search experiences across different
platforms (MapBox 2021). We utilize the Mapbox
SDK to import the 3D maps of real-life cities and
allow the user to explore and visualize those cities
from within the Unity 3D environment, with high
levels of detail, where particular locations or
buildings can be easily leveraged for procedurally
generating user-specific experiences or styling. Users
are prompted to select their city of choice upon
launching a new simulation project. Consequently,
the data layers are imported and built into the Unity
3D environment, including buildings data, points of
interest (POIs), roads, and real-time traffic data,
where the data can be fully customized within Unity
3D’s development environment (e.g., changing the
layout of certain buildings, adding a building,
Simulating Weather Events on a Real-world Map using Unity 3D
87
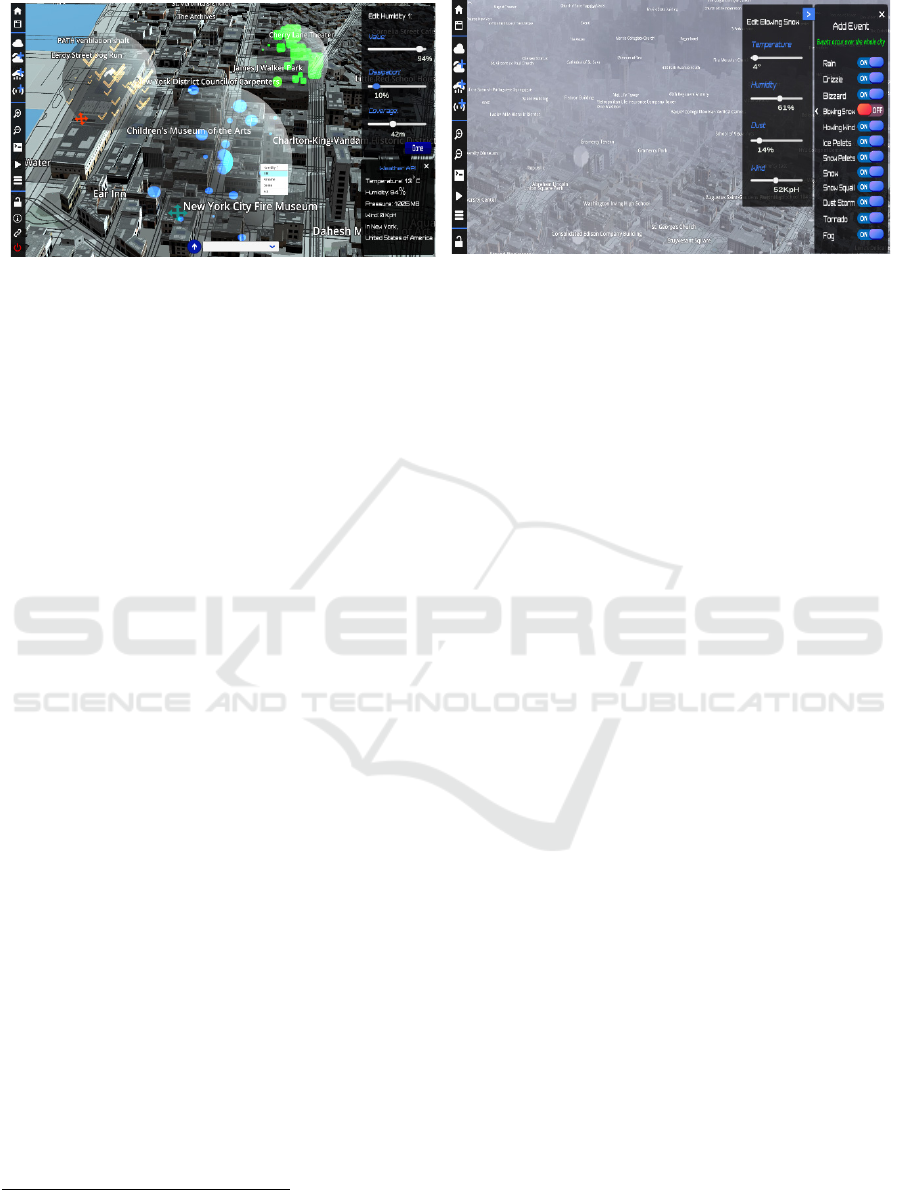
a. 3D visualization of the city of New York, with sample
weather measurements and some of their
p
arameters
b. Sample visualization of the city of New York, shown
durin
g
a snow storm in late Januar
y
2021
Figure 1: VOWES simulation tool snapshots of the city of New York.
removing or changing the properties of a road, etc.,
cf. Figure 1.a). In addition, we utilize the
WeatherStack API (WeatherStack 2021) to acquire
real-time weather data for the selected city being
simulated by the user 2 , while storing a 14-day
historical record of the weather information. The
historical record is useful to allow weather
forecasting through the simulator. Following the
user’s selection of the city of interest, and upon
launching the simulation project, the tool
automatically acquires and processes the real-data
weather information and presents the corresponding
visualizations and behaviours on-screen (Figure 1.b).
3.2 Virtual Weather Measurements
and Events
We develop a dedicated weather simulation module
using Unity 3D’s Particle System graphics (Unity
2020) to create dynamic weather objects, visualizing
and simulating the behaviours of weather
measurements (e.g., wind, humidity, temperature)
and weather events (e.g., storm, tornado, fire). We
utilize Unity’s particle system to render small images,
called particles, and control their collective behaviour
to produce visual effects where every particle within
the system presents an individual graphical element
in the effect. Every particle system is modelled as a
3D sphere object with mutable boundaries, serving as
a container for a blob of particles associated with the
target weather measurement or event. The object’s
properties can be defined and fine-tuned by the user
through controllable parameters (e.g., coverage,
value, dissipation) as seen in Figure 1.
2
WeatherStack API is utilized by more than 75k companies
worldwide, providing multi-year history and live data
(WeatherStack, 2021).
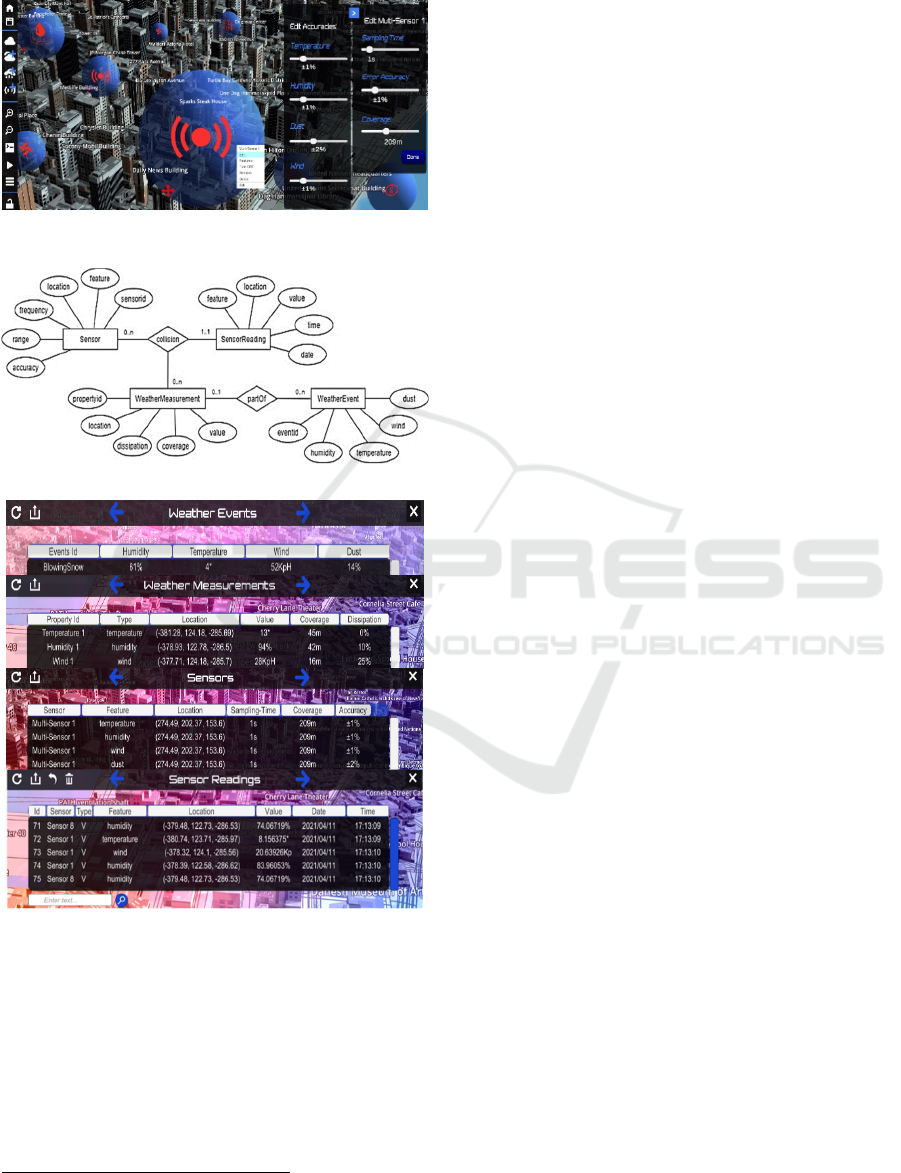
3.3 Virtual Sensors and Multi-sensors
We define a virtual sensor as a spherical Unity 3D
game object with mutable boundaries, having user-
controllable properties including location
(coordinates of the sphere’s centre point),
measurement range (radius of the sphere), sampling
rate (frequency of capture), and sampling accuracy
(precision of capture, cf. Figure 2). Every weather
measurement is associated with an identifying tag,
which is assigned to the corresponding virtual sensor
objects once its measurable feature is chosen by the
user. The user can easily toggle between the sensors’
measurable features using their identifying tags. The
tags help identify all virtual sensor game objects
without the need for any additional manual code
writing or Unity scripting. A virtual multi-sensor is
modelled as a set of multiple overlapping 3D sphere
objects where each sphere object represents an
individual virtual sensor. This allows a multi-sensor
to capture multiple weather measurements from its
constituent virtual sensors and allows flexibility and
modularity in designing different kinds of virtual
sensors. The sensed values are based on the user-
chosen properties for the corresponding weather
measurement or the event object. Knowingly, the
sensor starts first finding the contact points with the
weather game object, estimating the corresponding
weather value at each point, accumulating the average
of all points, and showing the output values to the user
through the database console. This process is done
continuously until no weather item is detected within
the sensing range. As soon as the collision ends, the
function on collision exist indicates that contact has
been broken between the sensor and the weather
SMARTGREENS 2022 - 11th International Conference on Smart Cities and Green ICT Systems
88
game objects, signaling the end of the weather
measurements sensing process.
Figure 2: Virtual sensor configuration panel.
a. Conceptual ER describing an extract of the database
b
. Sam
p
le data
p
roduced b
y
the VOWES simulator tool
Figure 3: Extract of the VOWES database schema and
sample data.
3.4 Environment Data Storage
The data generated through the VOWES simulation
environment, including virtual weather
measurements and events, as well as virtual sensor
properties and readings, are organized and stored in a
3
http://sigappfr.acm.org/Projects/VOWES/
relational database structure. Figure 3 shows the
database conceptual schema and corresponding
sample data snapshots from the simulator tool. The
data from every simulation project is saved in the
database, with its timestamp under the user’s account,
and can be utilized by the user to save, exit, reload,
refresh and query the simulation project. The data is
also essential to allow the development of data
monitoring, mining, and extrapolation functionalities,
including project versioning, temporal querying,
measurement forecasting, and event prediction. For
instance, while VOWES does not currently perform
forecasting and prediction, yet it will allow
visualizing predicted events once their data becomes
available. In other words, VOWES will allow the user
to easily fast-forward (or fast-backward) in time to
visualize the weather environment and its events in
the future (or in the past), according to the available
temporal data in its database. The predicted events
and their measurements will plug into VOWES and
benefit from its visualization functionalities. The
latter are outside the scope of this work and will be
addressed in a future study.
4 EMPIRICAL EVALUATION
We have conducted qualitative and performance
evaluations to assess the VOWES’ tool, considering
three evaluation criteria: i) simulation accuracy, ii)
user friendliness, and iii) time performance. The
prototype system is available online
3
.
4.1 Simulation Accuracy
An essential feature in our simulator is the
functionality of the virtual sensor (and virtual multi-
sensor) component(s). As described in Section 4, a
virtual sensor is designed to mimic the behaviour of a
real sensor in the virtual simulation environment, by
capturing weather measurements (e.g., temperature,
humidity, wind) based on the occurring weather event.
To test the accuracy of the weather measurements
made by virtual sensors, we refer to the real-time
weather values given by the integrated weather API,
which are set as the initial values for any weather
measurement or event as seen in Figure 4.a and b. The
weather values provided by the weather API are
regularly updated in the simulation tool, to highlight
the real weather conditions in the chosen geo-location
being simulated. We also test the performance of the
Simulating Weather Events on a Real-world Map using Unity 3D
89
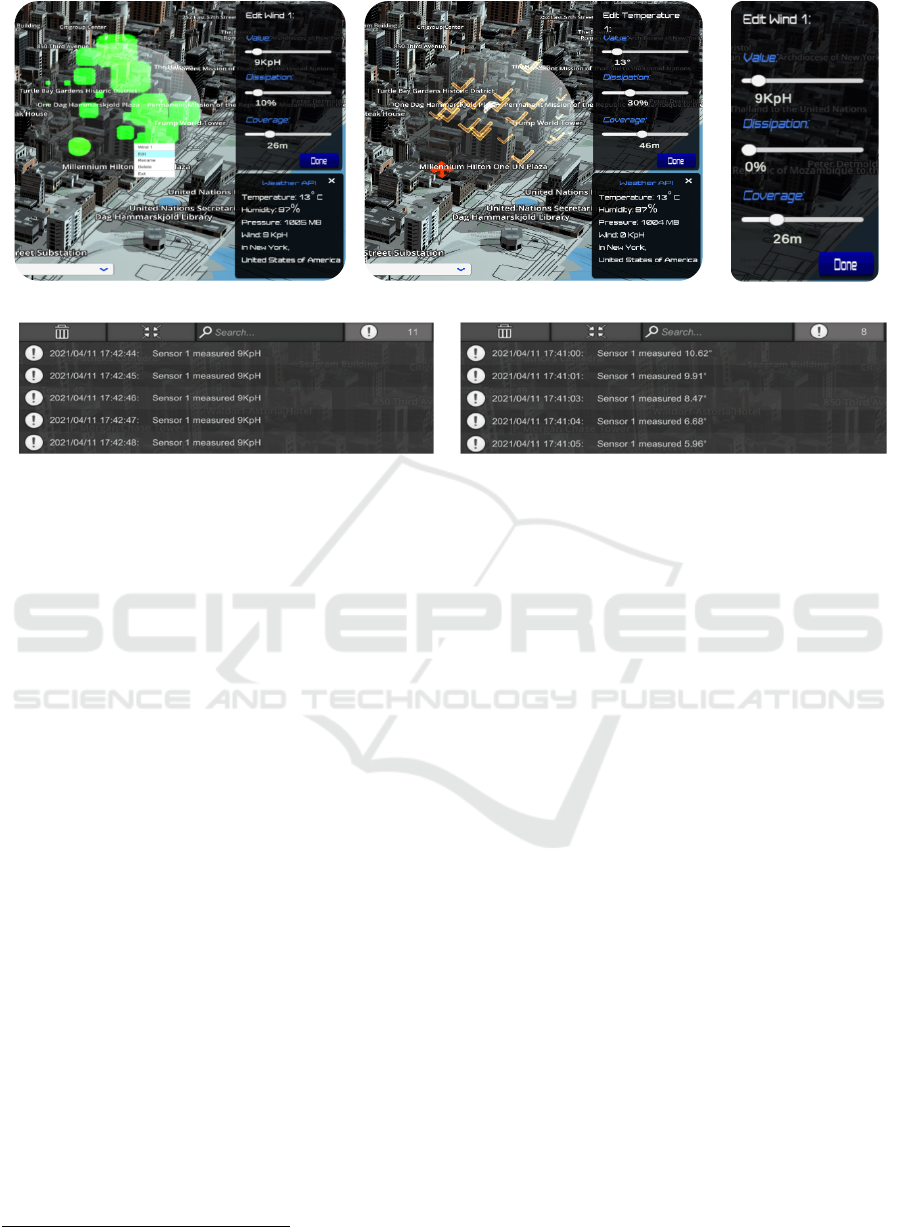
a. Sample wind measurement b. Sample temperature measurement c. Parameters’ panel
d. Wind speed readings with no dissipation (cf. a)
e. Tem
p
erature readin
g
s with 30% dissi
p
ation
(
cf. b
)
Figure 4: Display of weather measurement properties (a b, c) and sensor readings (d, e).
virtual sensors by checking their readings in
comparison with the selected weather measurements
and their associated properties (e.g., value,
dissipation, location, coverage). For example, if we
select a wind measurement and set dissipation to 0%
(cf. Figure 4.a), we expect the sensor to capture the
same specified wind speed value returned by the API
as long as it occurs within its coverage area,
regardless of its collision location (cf. Figure 4.d). Yet
if we set the temperature dissipation parameter to
50%, and we incrementally move the virtual sensor
away from the weather measurement’s location, we
expect the sensor to capture temperature values at a
decreasing rate of 50% considering the sensor’s
collision location w.r.t. the temperature measurement
location (cf. Figure 4.e). We follow the above
approach by modifying all the weather measurement
properties and checking the virtual sensors’
measurements accordingly. For every property, we
consider 10 variations of equal spans (e.g.,
temperature varies between -30, -20, …, 60 Celsius,
dissipation varies between 0, 10, 20, …, 100%). The
results produced for all property variations and tests
concur with the virtual sensors’ expected
measurements, denoting their simulation accuracy.
4.2 User-friendliness
The VOWES tool is designed to allow non-expert
users who have no previous knowledge about the
4
Graphical User Interface
simulation tool to be able to easily utilize it and
benefit from its functionalities. Hence, we evaluate
the tool’s user-friendliness by performing two kinds
of evaluations: i) GUI
4
testing, and ii) usability
testing. The former aims at checking the GUI’s input
fields and components, while the latter aims at
checking the ease/difficulty of usage of the software
tool by non-expert users.
GUI Testing: In this experiment, we check the
display of input fields and buttons on the screen
considering the aspects of size, alignment, and
content. We also check the menu and parameter
panels of the application by testing their buttons and
mouse hovering functionality, and their impact on the
main display. This is applied on all user-interfaces in
the whole simulator, starting from testing the
capability of generating more than one project
simultaneously (through the main page), to the ability
to select a country/city and viewing it in a 3D
environment, as well as scrolling and zooming in and
out of the map with high resolution and details. We
also evaluate and test the ability to add weather
measurements and events in the same simulation
project, and we test the functionality of the designed
buttons by pressing each button more than 50 times
consecutively. In addition, we make sure that all the
weather measurements are movable around the map,
by relocating every one of them more than once.
SMARTGREENS 2022 - 11th International Conference on Smart Cities and Green ICT Systems
90
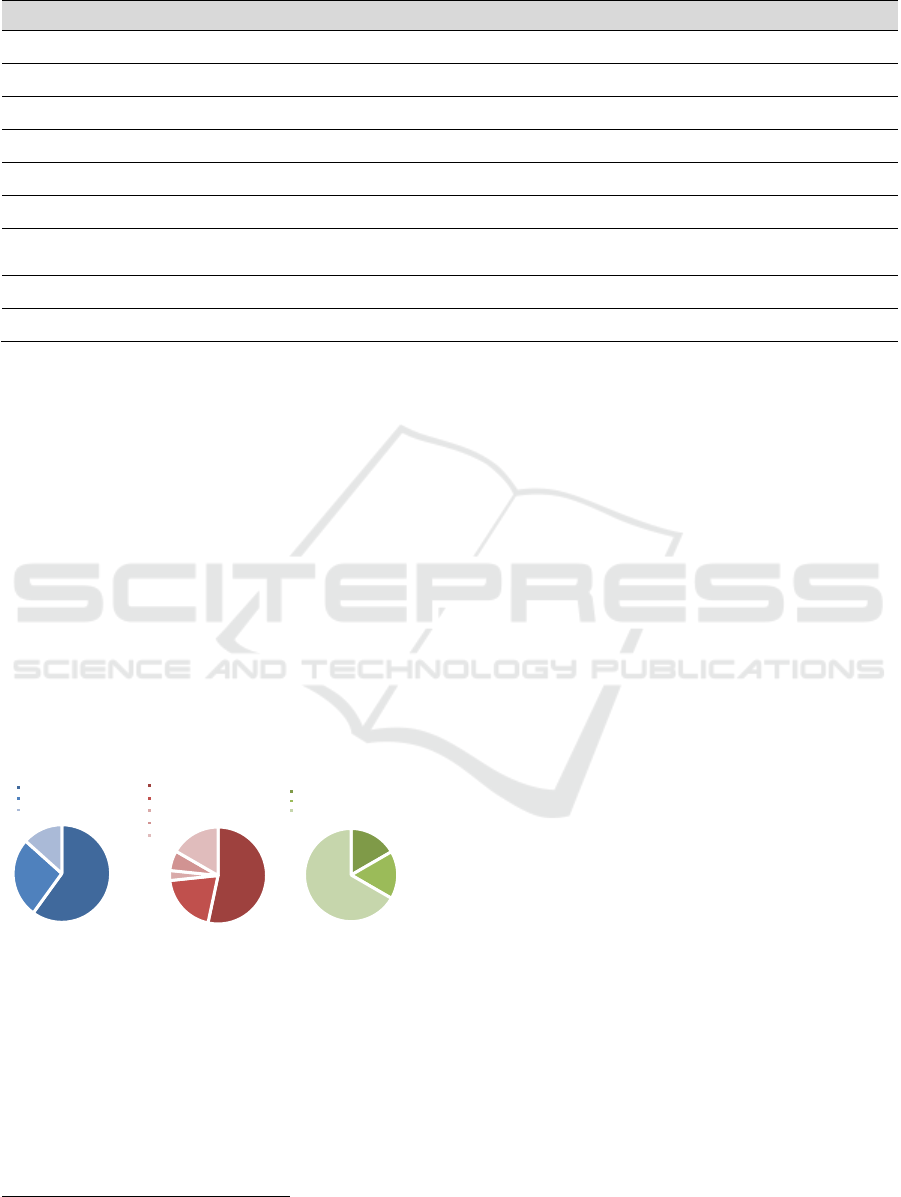
Table 1: Simulation tool usability evaluation criteria.
Criterion Description Evaluation question
Stability
It is the ability of the software tool to function over a long period
of time without crashin
g
.
Given the criterion’s description, how satisfied are you with the
stabilit
y
of the simulation tool?
Look and Feel
It refers to the first impression a user has after using the software
tool.
Given the criterion’s description, how satisfied are you with the look
and feel of the simulation tool?
Ease of Use
It describes how easy and straightforward it is to use and
mani
p
ulate the software tool.
Given the criterion’s description, how satisfied are you with the ease
of use of simulation tool?
Functionality
It refers to the capacity of the software tool to provide useful
functions and features servin
g
its main ob
j
ective.
Given the criterion’s description, how satisfied are you with the
functionalit
y
of the simulation tool?
Responsiveness
It refers to the time it takes the software tool to execute a certain
action or behaviour.
Given the criterion’s description, how satisfied are you with the
res
p
onsiveness and overall s
p
eed of this a
pp
lication?
Format
It refers to the materials and options provided (e.g., buttons,
instructions
)
and their or
g
anization within the software tool.
Given the criterion’s description, how satisfied are you with the
format of this simulation tool?
Navigation
It refers to the interactions that allow users to navigate across,
into, and back-out of the software's format (e.g., back to the
main
p
a
g
e, o
p
enin
g
/closin
g
side menus, zoom in/out
)
.
Given the criterion’s description, how satisfied are you with the
navigation of this simulation tool?
Icon Intuitiveness
It reflects how easy it is to guess a button’s resulting action or
b
ehaviour before a user
p
resses it.
Given the criterion’s description, how satisfied are you with the
intuitiveness of the icons of this simulation tool?
User Interface
It is the means through which a user controls a software
a
pp
lication and interacts with it.
Given the criterion’s description, how satisfied are you with the
interface of this simulation tool?
We apply the same testing on the virtual sensors,
where we perform 10 consecutive addition, renaming,
deletion, and movement operations on every sensor in
the simulation exercise. Similarly, we test up to 10
separate projects by launching every project using a
different city map, populating it with weather
measurements, weather events, and virtual sensors,
saving it, closing it, re-opening it, and verifying that
the sensors, measurements, events, and their values
and locations are correctly loaded and initialized
respectively. Furthermore, we test the parameter
panels associated with every visual component by
checking the functionality of its buttons and range
sliders (describing coverage, value, and dissipation,
cf. Figure 4.c) and observing their impact on the
visual component. Results of all GUI tests were
successful and allowed fine-tuning and improving the
visual aspects and behaviour in the simulation tool.
a. Educational level
b
. Field of stud
y
c. Ex
p
erience with Unit
y
3D
Figure 5: Non-expert testers’ education levels, majors, and
experience with Unity 3D
Usability Testing: We also created an online
survey
5
to evaluate the usability and user-friendliness
of our simulation tool considering nine evaluation
criteria: i) stability, ii) look and feel, iii) ease of use,
iv) functionality, v) responsiveness, vi) format, vii)
navigation, viii) icon intuitiveness, and ix) user
5
Available at: https://forms.gle/F6odKynC9pcvmCzq6
interface (cf. Table 1). A total of 30 non-expert testers
(undergraduate and graduate students, cf. Figure 5)
were invited to contribute to the experiment, where
they independently rated every evaluation criterion
on an integer scale from 0 to 4 (i.e., from highly
dissatisfied to highly satisfied). Tests were conducted
on a network version of the tool made available
through the university’s computer labs, where every
computer lab consists of an HP ProLiant ML350
Generation 5 (G5) Dual-Core Intel XeonTM 5000
processor with 2.66 GHz processing speed and 16 GB
of RAM. A total of 170 responses were collected,
with every criterion receiving 30 rating scores.
Results in Figure 6 show the average rating scores and
their standard deviations aggregated for every
criterion. Most testers are satisfied with the tool’s
usability, producing an overall average rating of 3 out
of 4 considering all criteria combined. Three criteria
received average scores below 3: look and feel (2.80),
ease of use (2.80), and responsiveness (2.80). Tester
discussions revealed that the latter are generally due
to the perceived loading time delays of certain Unity
3D components, visual effects, or animations, which
probably require increased processing power. This is
a common issue with most 3D rendering
environments due to their high processing and
memory requirements and can be improved with the
usage of GPUs and other enhancements. Few testers
recommended including additional features like: i)
considering the impact of outside weather conditions
on indoor environments (e.g., indoor heating/cooling
systems), and ii) including pollution-related
measurements (e.g., carbon dioxide concentration).
We plan to consider the latter in a future study.
18
8
4
Undergraduatestudents
Graduatestudents
Doctoralstudents
16
6
5
ComputerScience/Engineering
Engineering(other)
Architecture
Sciences
Other
5
5
20
NeverheardofUnity3D
Know,butneverusedUnity3D
KnowandusedUnity3D
Simulating Weather Events on a Real-world Map using Unity 3D
91
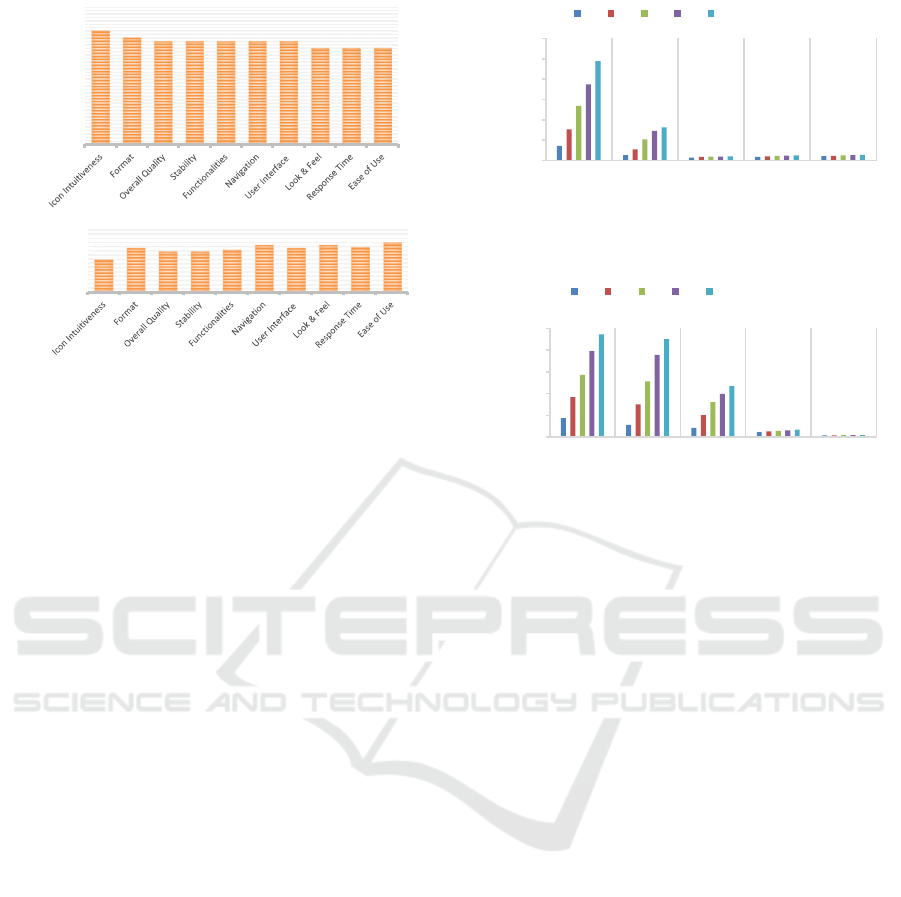
Figure 6: Average tester ratings for every usability
criterion.
4.3 Time Performance
The following paragraphs highlight and discuss the
time results obtained during the tool’s: i) setup phase
and ii) simulation phase. Experiments were
conducted on an HP ProLiant ML350 Generation 5
(G5) Dual-Core Intel XeonTM 5000 processor with
2.66 GHz processing speed and 16 GB of RAM.
Setup Phase: The simulation tool allows the user
to visualize sensors, weather measurements (e.g.,
wind, humidity, temperature), and weather events
(e.g., storm, fire, tornado) as objects with editable and
controllable parameters. As such, we evaluate the
tool’s setup phase by measuring the time to create and
load large numbers of game objects, ranging over: 20,
40, 60, 80, and 100 different objects where half of
them represent sensors and the other half represent
weather events and measurements. We start by
adding 10 sensors and 10 weather phenomena with
random values for their attributes. Then, we measure
the time consumed to save and then load these game
objects from the database, along with their respective
features. Also, we measure the time to search,
refresh, and export the game objects’ data from the
database, to keep track of all the sensors and weather
phenomena placed or edited in a project environment.
Results in Figure 7 show that most setup operations
run in almost instantaneous time, where search,
refresh and export operations share almost identical
performance levels with execution time increasing by
approximately 179𝜇s for every added game object.
Simulation Phase: This phase demonstrates the
sensors’ behaviour in action, where sensors are
Figure 7
:
Execution time of setup phase operations.
Figure 8: Execution time of simulation phase operations.
detecting the weather measurements within their
coverage areas, based on the features specified by the
user. Each sensor works following its internal
sampling rate, collecting data from the environment
and storing them in the database. As a continuation of
the setup phase evaluation, we create 50 sensors with
a sampling rate of 0.1s (i.e., every 0.1s, all sensors
carry out their reading calculations simultaneously
and store the results in the database). We evaluate the
time performance of sensor reading queries
considering large numbers of data tuples ranging
over: 10k, 20k, 30k, 40k, and 50k. We evaluate
export, search, refresh, delete, and undo queries, by
executing every query 10 times and computing the
average execution time. Results in Figure 8 reflect
efficient simulation time, where the maximum
consumed time was detected at 945ms to export 50k
tuples (i.e., almost 3.7MB) into an external CSV file.
This highlights the tool’s time performance in
running large simulation projects, and its ability to
simulate complex weather environments with large
numbers of sensors and weather phenomena.
5 CONCLUSION
This paper introduces VOWES, a Virtual Outdoor
Weather Event Simulator to replicate and measure
outdoor weather events and data in 3D. We make use
of the Unity 3D engine to build the simulator
3,30
3,10
3,00 3,00 3,00 3,00 3,00
2,80 2,80 2,80
0,0
0,5
1,0
1,5
2,0
2,5
3,0
3,5
4,0
Averagetesterratings
0,79
1,06
0,98 0,98
1,02
1,13
1,06
1,13 1,08 1,19
0,0
0,5
1,0
1,5
Stdev
145
54
28
36
44
307
109
35
42
46
537
208
38
46
51
749
292
39
49
54
977
325
41
51
57
0
200
400
600
800
1000
1200
Save Load Search Refresh Exportto
CSV
Time(ms)
Setupoperations
20 40 60 80 100Game‐objects
175
113
84
47
17
369
301
203
53
17
572
513
323
58
18
791
758
398
62
18
945
901
470
70
19
0
200
400
600
800
1000
ExportTo
CSV
Search Refresh Deletea
Tuple
Undolast
action
Time(ms)
Simulationoperations
10 20 30 40 50thousandtuples
SMARTGREENS 2022 - 11th International Conference on Smart Cities and Green ICT Systems
92

environment and introduce special visualizations and
behaviours to present weather measurements, events,
and sensors. We integrate the Mapbox SDK to import
high-resolution world maps, and the WeatherStack
API to capture real-time weather measurements and
conditions, allowing for more realistic and accurate
simulations. Empirical evaluations are promising and
highlight the system’s quality and potential.
We are currently extending VOWES to integrate
a knowledge base structure, providing a formally
description of the simulator’s components (Noueihed
H. et al. 2022). We are also investigating the impact
of data collection (Moataz S. et al., 2020, Ebrahimi
D. et al. 2019, Ebrahimi D. et al. 2018), and data
duplication and de-duplication techniques (Shazad F.
et al. 2022, Mansour E. et al. 2020) on the quality and
time performance of the tool. We also plan to
investigate different machine learning models
(Fuentes S. et al. 2020, Oses N. et al. 2020) and
evolutionary developmental techniques (Salloum G.
and Tekli J. 2021, Abboud R. and Tekli J. 2019), to
perform weather measurement forecasting and event
prediction (Hewage P. et al. 2021, Moreno R. et al.
2020). Forecasting and prediction will be added as
plug-and-play layers, allowing for model
transparency and extensibility.
REFERENCES
Abboud R. and Tekli J. (2019). Integration of Non-
Parametric Fuzzy Classification with an Evolutionary-
Developmental Framework to perform Music Sentiment-
based Analysis and Composition. Springer Soft
Computing 24(13): 9875-9925
Buyuksalih I., et al. (2017). 3D Modeling and Visualization
based on the Unity Game Engine - Advantages and
Challenges. 4th Inter. GeoAdvances Workshop pp. 161-
166.
Ebrahimi D., et al. (2019). UAV-Aided Projection-based
Compressive Data Gathering in Wireless Sensor
Networks. IEEE Internet Things journal 6(2): 1893-1905.
Ebrahimi D., et al. (2018). Data Collection in Wireless
Sensor Networks Using UAV and Compressive Data
Gathering. GLOBECOM pp. 1-7.
Fuentes S., et al. (2020). Machine Learning Modeling of
Wine Sensory Profiles and Color of Vertical Vintages of
Pinot Noir Based on Chemical Fingerprinting, Weather
and Management Data. Sensors 20(13): 3618.
Garcia-Dorado I., et al. (2017). Fast Weather Simulation for
Inverse Procedural Design of 3D Urban Models. ACM
Transactions on Graphics 36(2): 21:1-21:19.
Hewage P., et al. (2021). Deep Learning-based Effective
Fine-grained Weather Forecasting Model. Pattern
Analysis and Applications 24(1): 343-366.
Jain V. and Mahdavi A. (2016). Implementation of
Simulation-based Virtual Sensors Using Radiance and
Java. Applied Mechanics and Materials 824: 740-747.
Li X., et al. (2019). Primitive-Based 3d Building Modeling,
Sensor Simulation, and Estimation. IEEE Inter.
Geoscience and Remote Sensing Symposium
(IGARSS'19) pp. 5148-5151.
Mansour E., et al. (2020). Data Redundancy Management in
Connected Environments. International Conference on
Modeling, Analysis, and Simulation of Wireless and
Mobile Systems (MSWiM-Q2SWinet) pp. 75-80.
MapBox (2021). Mobile Maps SDK v10.
https://www.mapbox.com/mobile-maps-sdk
Moreno R., et al. (2020). Seeking the Best Weather Research
and Forecasting Model Performance: an Empirical
Score Approach. Journal of Supercomputing 76(12):
9629-9653.
Noueihed H., et al. (2022). Knowledge-based Virtual
Outdoor Weather Event Simulator using Unity 3D.
Journal of Supercomputing, doi.org/10.1007/s11227-
021-04212-6.
Oses N., et al. (2020). Analysis of Copernicus' ERA5 Climate
Reanalysis Data as a Replacement for Weather Station
Temperature Measurements in Machine Learning
Models for Olive Phenology Phase Prediction. Sensors
20(21): 6381.
Salloum G. and Tekli J. (2021). Automated and Personalized
Nutrition Health Assessment, Recommendation, and
Progress Evaluation using Fuzzy Reasoning. Inter.
Journal of Human-Computer Studies (IJHCS) Vol. 151,
102610.
Moataz S. et al. (2020). UAV Trajectory Planning for Data
Collection from Time-Constrained IoT Devices. IEEE
Trans. on Wireless Communications. 19(1): 34-46.
Sanders B., et al. (2020). Design and Validation of a Unity-
Based Simulation to Investigate Gesture based Control
of Semi-autonomous Vehicles. International Conference
on Human-Computer Interaction (HCI'20) 10:325-345.
Shazad F., et al. (2022). Data Redundancy Management
Framework for Connected Environments. Computing
journal (accepted, to appear).
Sun L., et al. (2020). An Optimised Steelmaking-continuous
Casting Scheduling Simulation System with Unity 3D.
Inter. J. of Simulation and Process Modelling 15(3): 213-
224.
Unity (2020). Architecture, Engineering & Construction,
https://unity.com/solutions/architecture-engineering-
construction
Unity (2020). Particle System. Unity Documentation,
https://docs.unity3d.com/ScriptReference/ParticleSyste
m.html (accessed Jan. 2022).
Wang R., et al. (2020). Portable Interactive Visualization of
Large-scale Simulations in Geotechnical Engineering
using Unity3D. Advances in Engineering Software 148:
102838.
Wazir H. and Annaz F. (2015). Applicability of Virtual
Reality in the Study of Environmental Stress. Applied
Mechanics and Materials 741: 209-214.
WeatherStack (2021). Real-Time & Historical World
Weather Data API. https://weatherstack.com/
Zigon B., et al. (2018). Interactive 3D Simulation for Fluid-
Structure Interactions using Dual Coupled GPUs.
Journal of Supercomputing 74(1): 37-64.
Simulating Weather Events on a Real-world Map using Unity 3D
93
