
Automatic Detection and Identification of Trichomonas Vaginalis
from Fluorescence Microscopy Images
Yongjian Yu
1
and Jue Wang
2
1
Axon Connected, LLC, Earlysville, VA 22936, U.S.A.
2
Department of Mathematics, Union College, Schenectady, NY 12308, U.S.A.
Keywords: Detection, Segmentation, Multiscale, Trichomoniasis, Trichomonas Vaginalis, Fluorescence Microscopy.
Abstract: Trichomonas vaginalis (TV) causes sexually transmitted infections that, if unresolved timely, can lead to
adverse health conditions. We construct a software platform integrating a novel, robust multiscale image
analysis pipeline for automatic detection and characterization of TV from dual-resolution, multi-band digital
fluorescence microscopy scans. We develop two spectral indices to highlight the TV in the spectrally
contaminated image. The system employs a search algorithm that incorporates the spectral indices to locate
the microorganisms from the low-resolution scans across the sample slide, and then identifies the TV using
a multiscale edge-sensitive automatic thresholding segmentation and index-driven ranking in the high-
resolution view. Method capability is demonstrated through the discriminability in the feature classification
and in the TV test pipeline, both showing a high sensitivity. This technique can be used to enable automatic,
fast diagnosis of trichomoniasis at the point-of-care clinics.
1 INTRODUCTION
Trichomoniasis (or trich for short) is the most
prevalent non-viral sexually transmitted infection
(STI) in the world (Bahadory et. al. 2021; WHO
2021a). It is caused by infection with a protozoan
parasite called Trichomonas vaginalis (T. vaginalis,
or TV for short). In 2020, the World Health
Organization (WHO) estimated 156 million new
infections of trich (WHO 2021b). According to the
latest WHO report, the estimates for trich were 6.3%
(95% UI: 4.0–7.2) in women and 0.6% (95% UI:
0.4–0.9) in men (Rowley et. al. 2019). Because no
recommendations are available for general screening
for TV, the epidemiology of trich has largely come
from population-based and clinic-based surveillance
studies (CDC 2021).
TV infection can be overlooked by clinicians, as
the process generally follows a benign course and is
frequently asymptomatic. The majority of people
who have trich (70–85%) either have minimal or no
genital symptoms, and untreated infections might
last from months to years (CDC 2021). Symptoms of
TV may be non-specific, making it difficult to
differentiate TV from other STIs clinically, which
require different treatment approaches. TV infection
in women is associated with vaginitis, urethritis,
cervicitis, and pelvic inflammatory disease. TV
infection can cause adverse pregnancy complica-
tions, such as tubal infertility, preterm delivery, low
birth weight, and premature rupture of membranes
(Webb et. al. 2021). TV transmission from mother to
child has been associated with neonatal morbidities,
including vaginitis, urinary tract infection, and
respiratory disease. TV infection has also been
linked to cervical human papillomavirus (HPV)
infection and cervical cancer (Amorim et. al. 2017;
Bahadory et. al. 2021). Among men, TV infection
has been associated with benign prostatic
hyperplasia and invasive prostate cancer (Bahadory
et. al. 2021; Webb et. al. 2021). Moreover, TV
infection is associated with an increased risk of
human immunodeficiency virus (HIV) transmission
and acquisition (Masha et. al. 2019). Up to 53% of
women with HIV have TV infections (CDC 2021).
Without inclusive testing protocols, TV infections
largely go undiagnosed and untreated. Therefore,
improving the detection of TV is of high
significance and impact.
The standard test for trich at the near point-of-
care (nPOC) clinics uses microscopic examinations
of the fresh saline wet mount to identify moving
organisms as TV. Wet mount microscopy is
considered insensitive compared to the culture
method (Nathan et. al. 2015). The sensitivity is
reported to be 52% in a recent study of 136
participants (Hsieh et. al. 2020). Current screening
for trich is performed using tests with limited
190
Yu, Y. and Wang, J.
Automatic Detection and Identification of Trichomonas Vaginalis from Fluorescence Microscopy Images.
DOI: 10.5220/0010993400003123
In Proceedings of the 15th International Joint Conference on Biomedical Engineering Systems and Technologies (BIOSTEC 2022) - Volume 2: BIOIMAGING, pages 190-197
ISBN: 978-989-758-552-4; ISSN: 2184-4305
Copyright
c
2022 by SCITEPRESS – Science and Technology Publications, Lda. All rights reserved
sensitivity, including wet mount microscopy
(sensitivity 38–68%), culture of specimens (44–
88%), nucleic acid hybridization (roughly 60%),
rapid antigen detection (83–86%), and nucleic acid
amplification tests (NAATs) (76–100%) (Andrea
and Chapin 2011; CDC 2021; Gaydos et. al. 2017;
Hsieh et. al. 2020; Hobbs and Seña 2013; Nathan et.
al. 2015; Patil et. al. 2012). The culture method has
a relatively longer turn-around time and is limited by
non-viable organisms in the specimen. The FDA-
cleared NAATs can improve the quality of trich
diagnostics, but they use large robotic platforms and
are time-consuming, thus not feasible for nPOC.
Moreover, the result is typically yes or no, rather
than being quantitative. The histochemical methods
use non-specific stains, which require interpretations
by the cytologists, pathologists, or other experts.
The emerging immunofluorescence (IF) assay
that binds the trich specific molecules enables an
easy interpretation and thus lowers the critical
errors. The IF assay makes it possible to locate,
highlight, and count all living, immobile, dead, and
even partially destroyed TV. In addition, the IF
assay is more sensitive than the wet mount
brightfield microscopic examinations. An automatic
IF assay equipped with motorized scanner and
automatic data analyzer is highly desired. It is a
challenging task to automatically detect the rare TV
from the IF micrographs, especially in the early
stage of infection. The TV is embedded among other
microorganisms such as white blood cells, epithelial
cells, yeast, hyphae, and swab debris, etc. The
multiband image suffers from degradation due to
channel crosstalk, local defocusing, biological
sample variability, and preparation variability.
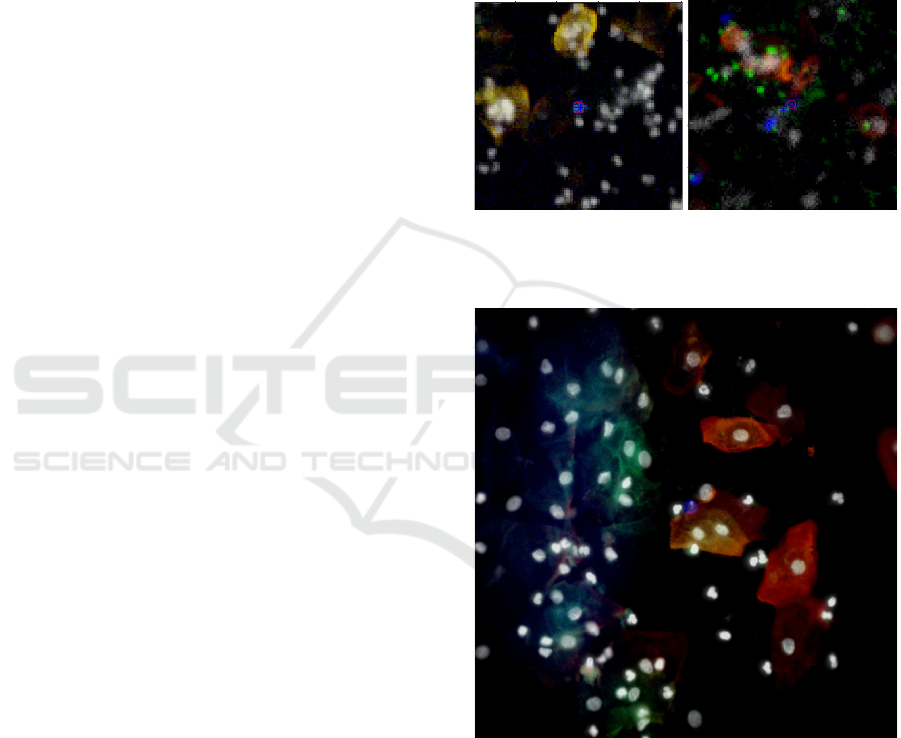
Example IF micrographs of clinical samples are
shown in Figure 1 at a 4X objective and Figure 2 at
a 40X objective, respectively. The color is assigned
as follows: red for channel 3 (epithelial cells), green
for channel 2 (yeast and hyphae of candida
albicans), grayscale for channel 1 (nuclei of various
microorganisms including the bacteria, epithelial
cells, TV, white blood cells, and yeast), and blue for
channel 4 (TV). The pseudo-color for display is
different from the LED illumination or fluorophore
emission waveband, which is further elaborated in
section 2.1. The non-specific staining can be seen in
the composite image. The TV is oval shaped and has
a faint eccentric, elongated nucleus. The organism
varies in size but is typically around 10 μm in length
and 7 μm in width, slightly larger than the white
blood cell (WBC). It can assume an amoeboid form
when attached to the vaginal epithelial cells.
Towards detection efficiency and robustness, the
algorithm needs to first find the TV candidates using
a 4X objective, and then identify the TV within a
40X objective high-resolution view.
We propose two normalized TV spectral indices
along with a pipeline of data processing algorithms
for a rapid search and identification of TV from IF
micrographs. We analyze the discriminability of the
indices and demonstrate their potential after being
integrated into an automated digital IF microscopic
system for a computer-aided diagnosis of trich.
Figure 1: Composite images of pseudo-colored four-band
IF micrographs at a 4X objective. The locations of
possible TV (blue) are marked by the red circles.
Figure 2: Composite image of pseudo-colored four-band
IF micrograph at a 40X objective. The TV approximately
centered in the image.
2 METHODS
2.1 Problem Statement
A research digital IF microscopic platform under
development and optimization is utilized for this
Automatic Detection and Identification of Trichomonas Vaginalis from Fluorescence Microscopy Images
191
study. The platform runs with dual resolutions, four
spectral channels, and is configurable to scan and
analyze vaginal microbiome swab samples for
aiding diagnosis of bacterial vaginosis, candida
albicans infection, and trichomoniasis (trich). The
four-channel image can be expressed by
𝑰
𝐼
𝐼
𝐼
𝐼
. (1)
The 𝐼
, 𝐼
, 𝐼
and 𝐼
represent the fluorescence
images in the four emission spectral channels (lime,
green, blue, and far red). The LED illumination
spectrum for each channel image is at a shorter
wavelength than the respective stain emission
wavelength. These images contain numerous
different microorganisms, in the form of isolated
cells or colony of cells, such as the epithelium,
fungus, DNA materials/bacteria, and TV. For the
diagnosis of trich, a TV-specific antibody staining
enables TV expression mostly in 𝐼
. Likewise, 𝐼
, 𝐼
,
and 𝐼
express selectively the stained epithelium,
fungus, and DNA materials/bacteria, respectively.
Because of the channel crosstalk problem, these
images are not mutually independent in terms of the
contents. In the TV expression channel 𝐼
, there
exist distractive interfering images of irrelevant
objects. Likewise, the other channels have their own
latent objects of interest, but also contain the ghost
images of the other unwanted objects. The presence
of channel crosstalk reduces the sensitivity and
accuracy of finding, segmenting, and identifying
TV. Detection of TV with a high sensitivity becomes
a challenging task in the case of only a single TV
presence. The difficulty is further compounded by
the background fluorescence and debris that increase
the false detection rate.
2.2 Segmentation and Identification
The dual-resolution system uses a 4X and a 40X
objective to find and identify the TV, respectively.
2.2.1 TV Search
A 4X scan of the sample slide yields 25 sub-images,
each with 2K-by-2K pixels. The pixel pitch of the
image is approximately 1.6 μm. The 4X TV search
algorithm consists of finding the boundary of the
organism and its nucleus, blob quantification, and
support vector machine (SVM) classification of the
blobs into two classes: TV alike and non-TV.
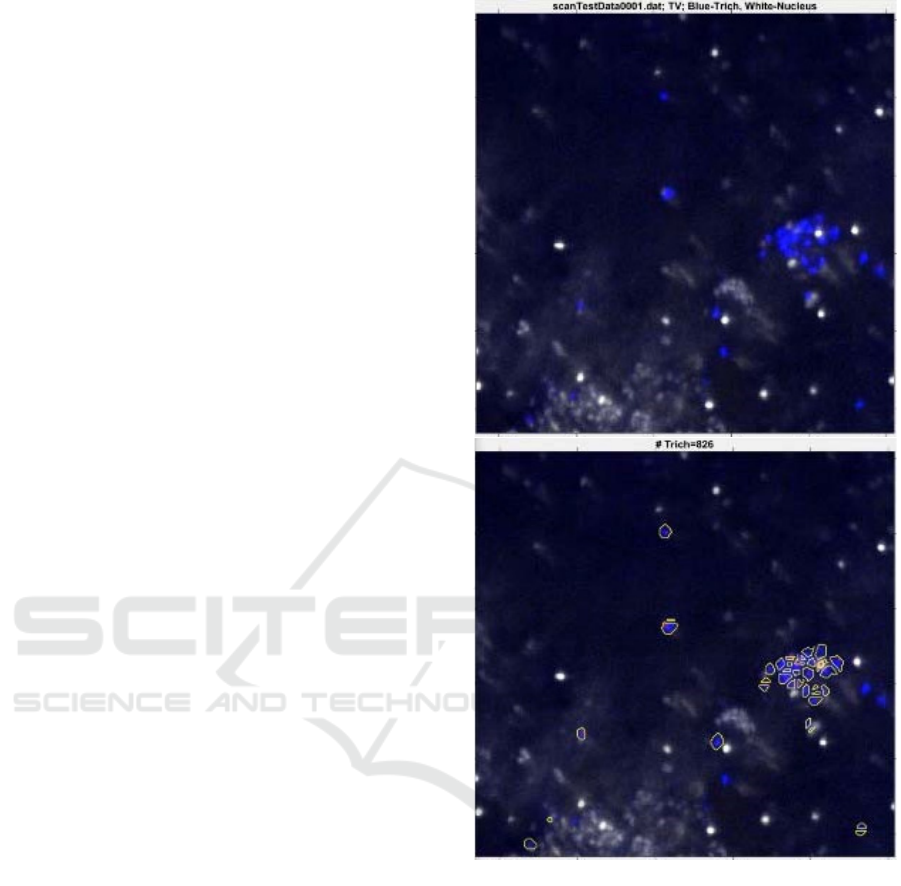
The external boundary segmentation of TV is
performed via adaptive thresholding of the TV-
sensitive channel 4X 𝐼
. Considering the tiny size of
the trich nucleus (1 to 3 pixels), we apply the top-hat
Figure 3: 4X TV search and segmentation. The contour
delineates the TV external boundary.
filtering of DNA-sensitive channel 4X 𝐼
for bright
objects to extract the trich nuclei. Top-hat filtering
computes the morphological opening of the image
and then subtracts the result from the original image.
The TV candidates are masked as nucleated blobs in
the 4X 𝐼
segmentation map. Any clump of nuclei is
identified by a size thresholding and then split into
individual TV nucleus using a marker-controlled
watershed method. The nuclear markers are located
as the local extended maxima. Similarly, a touching
cluster of TV is identified by the number of nuclei
in the cluster and spilt via the watershed controlled
by the individually segmented nucleus. Finally, the
BIOIMAGING 2022 - 9th International Conference on Bioimaging
192

strong cytokeratin and yeast areas are masked out
using a set union:
𝐻𝐼
𝐼
𝜀∪𝐻𝐼
𝐼
𝜀, (2)
where 𝐻∙ is the Heaviside function acting as a
thresholding operator; the ∪ denotes the union of
sets; 𝜀 is a smaller number in the range of 0-10. An
example of the 4X TV segmentation is shown in
Figure 3.
The initial TV candidates are numerically
labelled. Each blob will be further quantified by the
features outlined in the later sections and classified
into TV alike or non-TV. Each 4X TV candidate is
then imaged with a 40X objective and examined to
identify if it is a true TV.
2.2.2 TV Segmentation with Multiscale
Edge-sensitive Automatic
Thresholding
In order to accommodate for the shadow depth of
focus with the 40X objective imaging, which may
cause the local out-of-focus issue, we develop a
multiscale edge-sensitive automatic thresholding
technique for 40X TV segmentation. The edge
information facilitates locating the objects in dim
regions where they are likely to be missed by
grayscale thresholding, and the automatic
thresholding recovers the cells with undefined edges
due to local defocusing. The method optimizes an
objective functional, i.e., maximizing the Dice shape
similarity between the multiscale edge synthesized
segmentation and automatic thresholding
segmentation of an input image 𝐼 , expressed as
follows,
𝑇
∗
max
|
∩
|
|
|
|
|
, (3)
where 𝐼
is an L-level linear quantized image of 𝐼
(40X 𝐼
or 𝐼
); the quantization compresses the range
of the threshold value 𝑇 to an integer set {1, 2, …,
L}. 𝐻∙ is the Heaviside function acting as a
thresholding operator. 𝐶 denotes the edge
synthesized contours by morphological linking of
the multiscale edges 𝐸 of the input image 𝐼, 𝐶
𝐸⊕𝑆
∥
⊕𝑆
, where ⊕ stands for the dilation
operator; 𝑆
∥
and 𝑆
are the horizontal and vertical
line structure elements of length 3, respectively; 𝐹
∙
is the filling operator on 𝐶 . The final 40X TV
segmentation is given by the fusion 𝐻
𝐼
𝑇
∗
∪
𝐹
𝐶
.
The morphological linking synthesized edge 𝐶
may contain false contours resulted from the
clustered edges of noise. Moreover, the algorithm
itself is unable to determine if the segmentation is
good or bad without the ground truth. To overcome
these issues, we build and incorporate some ground
truth data into the proposed segmentation paradigm.
In recognition of the approximate circular shape
prior of the objects of interest, we perform a circular
Hough transform to 𝐼 to find all circles with radii in
the radius range of TV (or TV nuclei if segmenting
the TV nuclei). This results a network of circles 𝐶
.
Since 𝐶
is much resilient to image noise and fuzzy
edges, 𝐹
𝐶
is well deserved to be an approximate
ground truth semantic segmentation. We regularize
𝐹
𝐶
using 𝐹
𝐶
by maintaining only the
segmentations in 𝐹
𝐶
that are also in 𝐹
𝐶
. When
the foreground is well segmented, the shapes of
𝐹
𝐶
and 𝐹
𝐶
are close to each other, leading to a
high shape similarity. When 𝐶 deviates from 𝐶
significantly, 𝐶 becomes unreliable. We set the Dice
metric threshold of 0.5 for an acceptable goodness
measure of 𝐶 with reference to 𝐶
. If the Dice metric
is below 0.5, we use 𝐶
rather than 𝐶 as the final
object segmentation.
The edge-sensitive automatic thresholding
segmentation with shape regularization and
approximate ground truth support solves the
problem (to a certain extent) of conventional
segmentation algorithms (Ray and Saha 2007),
where the algorithms are unable to tell if the results
are satisfactory or not unless a human user inspects
the results.
2.3 Normalized Tv Spectral Indices
Denote 𝐽
the latent fluorescence signal in the raw
image 𝐼
(k =1 to 4). The raw signal in the k
th
channel can be modelled as a linear combination of
the latent data across four channels,
𝐼
∑
𝛼
𝐽
𝑛
, (4)
where 𝛼
is a 4 by 4 real-coefficient matrix, with
unity diagonal elements, i.e., 𝛼
1; 𝑛
is the
background and noise. The off-diagonal non-zero
coefficients reflect the residual of channel crosstalk,
non-specific staining, and sample variability.
The research microscope system in use does not
provide channel crosstalk correction, and thus the
latent image is inaccessible. To solve the channel
crosstalk problem with the raw data, we proposed
two spectral indices for a robust search of TV alike
with a low-resolution view, followed by quality
verification with a high-resolution view. A pre-
processing is first performed to convert the raw
image into an image appropriate for human
Automatic Detection and Identification of Trichomonas Vaginalis from Fluorescence Microscopy Images
193

visualization of the targets of interest, including
noise reduction, contrast enhancement, and
background subtraction. The TV spectral indices are
defined as
TVSI
𝐼
𝐼
/𝐼
𝐼
, (5)
TVSI
𝐼
𝐼
/𝐼
𝐼
, (6)
where 𝐼
𝑝
𝐼
,𝑘1 to 4; 𝑝𝐼 denotes a series
of operations on 𝐼, including the median filtering,
histogram stretching, and background subtraction.
The denominators in (5) and (6) normalize the
spectral indices to highlight the dim TV by
suppressing the distractive interference of ghost
images of unwanted objects. Both indices are less
than 1, but they can assume small negative values
because the illumination in each channel is
unbalanced. In section 3 results, we will mainly
demonstrate the discriminability of these two
indices, coupled with other features, for TV search
and identification.
2.4 TV Ranking for Identification
The TV is of similar size with many district clutter
organisms, such as the (candida albicans) yeast cells,
monocytes, and some debris co-existing in the trich
test sample. These clutter organisms express
fluorescence in the same waveband as the TV does.
Consequently, accurate TV enumeration is hindered
by the false positive rate resulted from
misidentifying those yeast cells, monocytes and
debris as TV. To increase the accuracy of trich
diagnosis, we develop a TV ranking model to
differentiate quantitatively the detected TV from
yeast or debris. This model incorporates the spectral
indices, sizes of TV and its nucleus, and a condition
that the TV must have a nucleus.
The DNA marker channel 𝐼
is first enhanced
around the 4X candidate region using a multiscale
blobness filter bank, followed by a binarization of
the blobness image using the clustering method
(Otsu 1979), biovolume elasticity method (Luo et.
al. 2018), or locally adaptive thresholding method
(Singh et. al. 2011). The binarized map contains the
TV nucleus, as well as other DNA materials (e.g.,
nuclei of WBC), which may cluster with the TV
nucleus under examination. The nuclear clumps are
split using the watershed transform. Denote 𝐵
and
𝐵
the segmentation masks of TV and its nucleus,
respectively. 𝐵
is further split until each area has
one nucleus in it. The true TV nucleus is determined
via a merit scoring and selection process. The
ranking model is defined by
𝑅 𝑆
〈
TVSI
〉
𝜇
𝜎
𝑆
〈
TVSI
〉
𝜇
𝜎
𝑓
𝐵
,𝐵
𝑔𝐴
,𝐴
; 𝑀
,𝑀
,𝐷
,𝐷
, (7)
where 𝑆∙ is the Sigmoid function parametrized by
the offset μ and spread σ;
〈
∙
〉
denotes the averaging
of cell segmentation; 𝑓
𝐵
,𝐵
|
𝐵
∩𝐵
|
/
|
𝐵
|
;
the ∩ and
|
∙
|
denote set intersection and cardinality,
respectively; 𝑔𝐴
,𝐴
; 𝑀
,𝑀
,𝐷
,𝐷
is the size
driven probability given by
𝑔
𝐴
,𝐴
; 𝑀
,𝑀
,𝐷
,𝐷
exp
exp
, (8)
where 𝐴
and 𝐴
are the trich area and nucleus area,
respectively; 𝑀
,𝑀
,𝐷
,𝐷
are the means and
standard deviations of the sizes of TV and nucleus,
respectively.
3 RESULTS
We demonstrate the capability and power of the
proposed platform for TV testing. Firstly, the
spectral indices are employed as the discriminative
features in the classification framework for TV and
non-TV organisms. Secondly, the spectral indices,
segmentation and ranking algorithms are integrated
into a complete system for TV quantification.
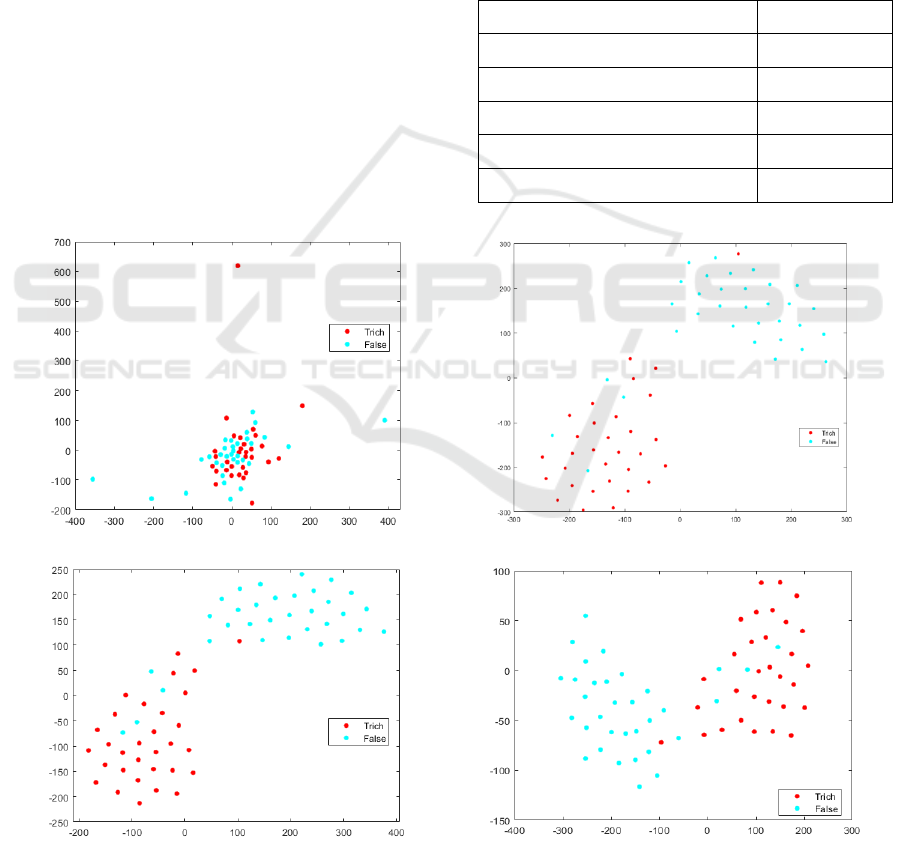
In order to study how the normalized TV
spectral indices perform as features for TV
classification at a low resolution (4X objective), we
construct four discriminative feature sets as follows:
𝑆
〈
TVSI
〉
,
〈
TVSI
〉
,
〈
𝐼
〉
,
𝑆
〈
TVSI
〉
,
〈
TVSI
〉
,
〈
𝐼
〉
,
〈
𝐼
〉
,
𝑆
〈
TVSI
〉
,
〈
TVSI
〉
,
〈
𝐼
〉
,
〈
𝐼
〉
,𝐴
,𝐴
,
𝑆
Union of 𝑆
and {nucleus eccentricity, cell-
minor-to-major-axis-length ratio}.
The nucleus eccentricity measures the distance
between the centroid of the cell and nucleus. We
apply the t-Distributed Stochastic Neighbor
Embedding (t-SNE) to visualize the clusters of
feature points in a two-dimensional plane based on
the feature relative similarities in a high-dimensional
feature space that corresponds to the user labels. The
optimal feature set 𝑆
is identified with t-SNE; the
result is shown in Figure 4. Using 𝑆
, we train a
linear and a nonlinear SVM classifier over 64 4X
cell images that contain 31 TV positive and 33 TV
negative. The samples are split randomly to 85%
(54) training and 15% (10) testing. An accuracy of
90% is achieved for the linear SVM and the
BIOIMAGING 2022 - 9th International Conference on Bioimaging
194
accuracy increases to 100% with the nonlinear SVM
using a radial basis function (RBF) kernel.
The TV detection and segmentation result at a
high resolution is shown in Figure 5 (b), with a
probability of 0.89 according to the ranking model.
The normalized spectral index maps are illustrated in
Figure 5 (c) and (d) that highlight the TV. A region
of interest (ROI) is selected for processing. The
procedure of nucleus detection and segmentation is
illustrated in Figure 6.
To quantify the performance of the integrated IF
system, 33 clinical TV samples are scanned and
analyzed. Slide preparation takes places in the slide
well. The sample is fixed with methanol for 5
minutes. A dilated solution of α-T. vaginalis, p65
adhesive antigen antibody is applied. The sample is
incubated for 15 minutes at room temperature. Then
DAPImount is applied and covered with a coverslip.
The overall time for slide preparation is less than 30
minutes including wash and dry time. The sample
slide is automatically scanned and trichomonads are
enumerated and reported in about 15 minutes.
The test results are compared to the experts’ data
reading. The sensitivity of the IF TV test is 100%,
specificity is 94%, and accuracy is 97%. We point
out that the relative lower classification accuracy in
the 4X classification is compensated by the 40X
ranking mechanism thus a high overall system level
performance is expected. The method comparison is
summarized in Table 1. Compared to the standard
wet mount microscopy and other methods used for
trich diagnosis, the IF test achieves a superior
performance. Coupling the 4X and 40X algorithms
in the sample evaluation, the developed technique is
able to deliver a test with a high sensitivity and
accuracy for quick TV detection and identification.
Table 1: Comparison of sensitivity.
Wet mount microscopy 38–68%
Culture 44–88%
Nucleic acid hybridization roughly 60%
Rapid antigen detection 83–86%
Nucleic acid amplification tests 76–100%
Proposed integrated IF 100%
(a) (b)
(
c
)
(
d
)
Figure 4: Classification of TV and other cells using the discriminative features. (a) Three-feature set 𝑆
. (b) Four-feature set
𝑆
. (c) The optimal six-feature set 𝑆
. (d) All eight features 𝑆
.
Automatic Detection and Identification of Trichomonas Vaginalis from Fluorescence Microscopy Images
195
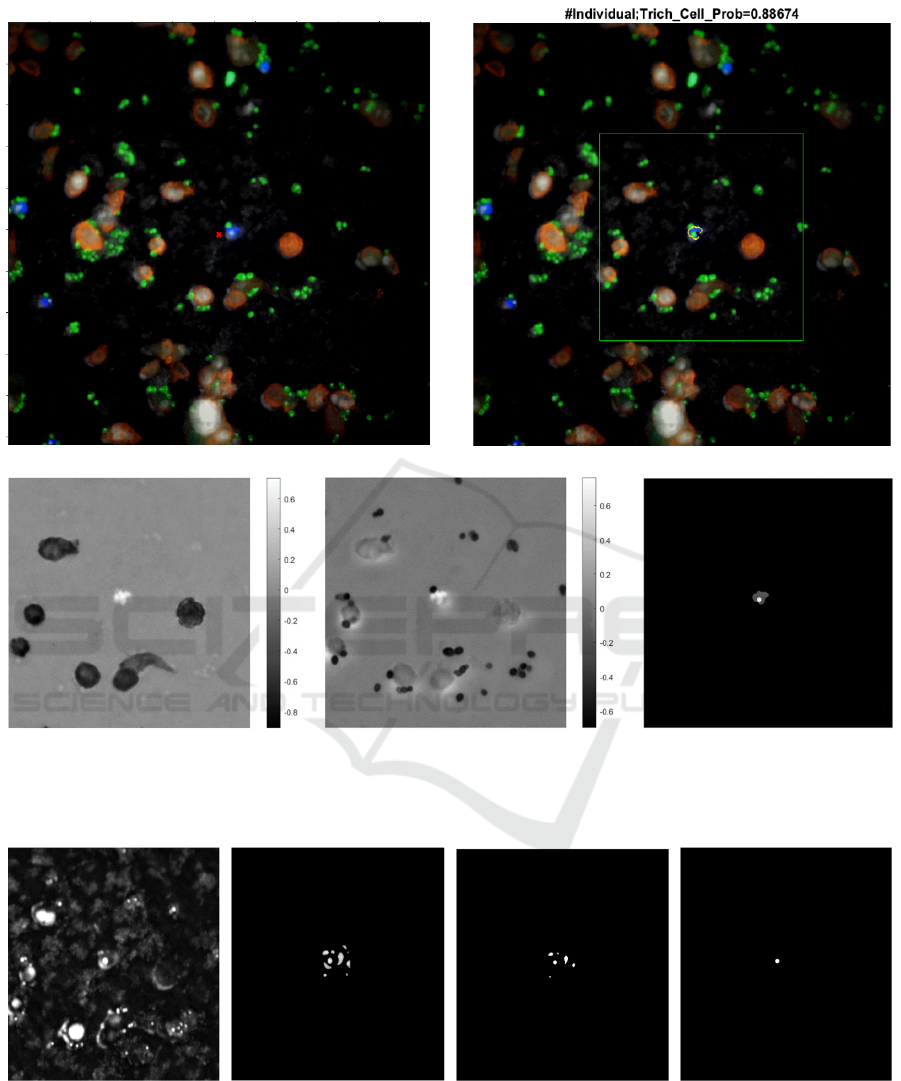
(a) (b)
(c) (d)
(e)
Figure 5. (a) Composite image of the pseudo-colored four-band IF micrograph at a 40X objective. (b) Segmentation
contours of the TV and its nucleus, with the ROI box overlaid on the composite image. (c) Spectral index TVSI
1
map. (d)
Spectral index TVSI
2
map. (e) Segmentation masks of the TV (gray) and its nucleus (white).
(
a
)
(
b
)
(
c
)
(
d
)
Figure 6: (a) Preprocessed nucleus channel. (b) ROI blobness enhancement. (c) Blobness map. (d) TV nucleus.
BIOIMAGING 2022 - 9th International Conference on Bioimaging
196

4 CONCLUSIONS
We have developed a set of novel spectral indices
along with cell segmentation and ranking algorithms
for a quick, robust search and quantitative
identification of TV from fluorescence micrographs
of specimen samples for assisting trich diagnosis in
a point-of-care setting. We demonstrate that the
proposed spectral indices are strong discriminative
TV features against artifacts. A low-resolution
search algorithm and a high-resolution identification
algorithm are integrated into the testing framework
and data processing pipeline. We devise an edge-
sensitive automatic thresholding method that
incorporates a cost minimization with an implicit
shape regularization and self-validation. It is capable
of extracting the TV with a wide range of signal
levels and edge strengths. Moreover, this method is
generic for cell detection. Our technique has shown
promising results and achieved a high sensitivity and
accuracy. We implement a software system that
eliminates user variability in slide reading and offers
the ability to archive images. The system enables a
real-time, more accurate assessment of trich
infections.
REFERENCES
A. T. Amorim, L. M. Marques, G. B. Campos, et al., “Co-
infection of sexually transmitted pathogens and
Human Papillomavirus in cervical samples of women
of Brazil”, BMC Infect. Dis., 17(1):769, 2017.
S. B. Andrea and K. C. Chapin, “Comparison of Aptima
Trichomonas vaginalis transcription-mediated
amplification assay and BD Affirm VPIII for detection
of T. vaginalis in symptomatic women: performance
parameters and epidemiological implications”, J. Clin.
Microbiol., 49(3):866-869, 2011.
S. Bahadory, S. Aminizadeh, A. Taghipour, F. Bokharaei-
Salim, K. Khanaliha, M. H. Razizadeh, A. Soleimani,
L. beikzadeh and A. Khatami, “A systematic review
and meta-analysis on the global status of Trichomonas
vaginalis virus in Trichomonas vaginalis”, Microbial
Pathogenesis, Vol. 158, 105058, 2021.
Centers for Disease Control and Prevention (CDC),
Trichomoniasis, Sexually Transmitted Infections
Treatment Guidelines, 2021.
C. A. Gaydos, J. D. Klausner, N. P. Pai, H. Kelly, C.
Coltart and R. W. Peeling, “Rapid and point-of-care
tests for the diagnosis of Trichomonas vaginalis in
women and men”, Sex Transm. Infect., 93(S4):S31-
S35, 2017.
M. M. Hobbs and A. C. Seña, “Modern diagnosis of
Trichomonas vaginalis infection”, Sex Transm. Infect.,
89(6):434-438, 2013.
Y. H. Hsieh, M. K. Lewis, V. G. Viertel, D. Myer, R. E.
Rothman and C. A. Gaydos, “Performance evaluation
and acceptability of point-of-care Trichomonas
vaginalis testing in adult female emergency
department patients”, Int. J. STD AIDS, 31(14):1364-
1372, 2020.
T. L. Luo, M. C. Eisenberg, M. A. L. Hayashi, C.
Gonzales-Cabezas, B. Foxman, C. F. Marrs and A. H.
Rickard, “A sensitive thresholding method for
confocal laser scanning microscope image stacks of
microbial biofilms”, Sci. Rep., Vol. 8, 13013, 2018.
S. C. Masha, P. Cools, E. J. Sanders, M. Vaneechoutte and
T. Crucitti, “Trichomonas vaginalis and HIV infection
acquisition: a systematic review and meta-analysis”,
Sexually Transmitted Infections, 95(1):36-42, 2019.
B. Nathan B, J. Appiah J, P. Saunders, D. Heron, T.
Nichols, R. Brum, S. Alexander, P. Baraitser and C.
Ison, “Microscopy outperformed in a comparison of
five methods for detecting Trichomonas vaginalis in
symptomatic women”, Int. J. STD AIDS, 26(4):251-
256, 2015.
N. Otsu, “A Threshold Selection Method from Gray-Level
Histograms”, IEEE Trans. Syst. Man Cybern. Syst.,
Vol. 9, No. 1, 62-66, 1979.
M. J. Patil, J. M. Nagamoti and S. C. Metgud, “Diagnosis
of trichomonas vaginalis from vaginal specimens by
wet mount microscopy, in pouch tv culture system,
and PCR”, J. Glob. Infect. Dis., 4(1):22-5, 2012.
N. Ray and B. Saha, “Edge sensitive variational image
thresholding”, IEEE ICIP, 16-19, 2007.
J. Rowley, S. Vander Hoorn, E. Korenromp, N. Low, M.
Unemo, L. J. Abu-Raddad, R. M. Chico, A. Smolak,
L. Newman, S. Gottlieb, S. S. Thwin, N. Broutet and
M. M. Taylor, “Chlamydia, gonorrhoea,
trichomoniasis and syphilis: global prevalence and
incidence estimates, 2016”, Bulletin of the World
Health Organization, 97(8), 548-562P, 2019.
T. R. Singh, S. Roy, O. I. Siggh, T. Sinam and K. M.
Singh, “A new local apative thresholding technique in
binarization”, IJCSI International Journal of
Computer Science Issues, Vol. 8, Issue 6, No. 2, 271-
277, 2011.
B. Webb, A. Crampton, M. J. Francis, J. Hamblin, T. M.
Korman and M. Graham, “Increased diagnostic yield
of routine multiplex PCR compared to clinician
requested testing for detection of Trichomonas
vaginalis”, Pathology, Vol. 53, Issue 2, 257-263,
2021.
World Health Organization (WHO), “Global progress
report on HIV, viral hepatitis and sexually transmitted
infections”, July 2021.
World Health Organization (WHO), “Sexually transmitted
infections (STIs)”, Nov. 2021.
Automatic Detection and Identification of Trichomonas Vaginalis from Fluorescence Microscopy Images
197
