
Alt-Texify: A Pipeline to Generate Alt-text from SVG Visualizations
Aspen Belle
1
, Vanessa Goh
1
, Akshay Kumar
1
, Richard Pranjatno
1
, Pui Man Yip
1
,
Umayangani Wickramaratne
2
and Humphrey O. Obie
1 a
1
Faculty of Information Technology, Monash University, Melbourne, Australia
2
Academy Xi, Melbourne, Australia
Keywords:
Visualization, Accessible Visualizations, Alternative Text, Caption Generation, SVG, Data Extraction,
Accessibility.
Abstract:
Data visualizations are used everywhere on the web to convey data and insight. However, interpreting these
visualizations is reliant on sight, which poses a problem for the visually impaired who rely on screen readers.
Alternative text descriptions are often missing from visualizations or not of a helpful quality, which the screen
readers rely on to interpret them for the user. In this short paper, we propose Alt-Texify, a pipeline to generate
alternative text descriptions for SVG-based bar, line and scatter charts. Our pipeline classifies the chart type
and extracts the data and labels from the SVG code and inserts the relevant information into a description tem-
plate. Our approach extracts the data and labels deterministically, allowing for factually accurate descriptions
99.74% of the time.
1 INTRODUCTION
With the advent of ‘Big Data’, data visualizations are
becoming increasingly common on the internet (Bat-
tle et al., 2018). By viewing data visually, humans
are able to interpret trends and patterns quickly and
easily, when compared to viewing the raw data (Obie
et al., 2019). Well-designed visualizations use visual
encodings to create interest and convey the data effec-
tively and efficiently (Poco and Heer, 2017a).
For a person to be able to interpret visualizations,
they are dependent on sight. This poses a problem
for the visually impaired, who are reliant on screen
reader software to convey the information aurally to
the user. Relaying text-based information is straight-
forward; however this is not the case for graphical
content, such as images. In this case, the screen reader
is reliant on an alternative text (alt-text) description
to be included by the author. Alt-text can be speci-
fied using the alt field of an image (HTML Standard,
2021) and will be read out when the screen reader
encounters an image on the page. Without this, the
screen reader will announce the existence of an im-
age, or skip it entirely. Existing research on the use of
alt-text has found that the alt tag is often missing or
lacking in detail (Gleason et al., 2019; Morris et al.,
a
https://orcid.org/0000-0002-6322-2984
2016). Similarly, the quality of generated image de-
scriptions using image recognition techniques cannot
compare to the quality of human written descriptions
(Wu et al., 2017). The reasons commonly cited for
not using alt-text tend to be either not knowing about
the feature, lacking the time, or not knowing what to
write (Gleason et al., 2019).
Our early work in this area aims to tackle the
problem of writing descriptive alt-text for visualiza-
tions. In this short paper, we present an end-to-end
pipeline that extracts the text labels and data from an
SVG-based visualization and determines the signifi-
cant trends of the data. Given a line graph, scatter plot
or a bar graph in SVG format, our pipeline will output
an appropriate description of the visualization. Ex-
isting solutions in generating textual descriptions for
charts are rooted in machine learning and use Object
Detection and Optical Character Recognition (OCR)
techniques to extract data from images (Jung et al.,
2017; Liu et al., 2020). However, the accuracy of
these methods may vary based on the training of the
model. Our tool takes a deterministic approach in ex-
tracting chart data by focusing on SVGs, where the
underlying shape geometry is encoded in XML for-
mat. Being able to extract data by scraping the XML
code means the resulting output of our tool is more
reliable. We also include graph trends in our alt-text
Belle, A., Goh, V., Kumar, A., Pranjatno, R., Yip, P., Wickramaratne, U. and Obie, H.
Alt-Texify: A Pipeline to Generate Alt-text from SVG Visualizations.
DOI: 10.5220/0010994600003176
In Proceedings of the 17th International Conference on Evaluation of Novel Approaches to Software Engineering (ENASE 2022), pages 275-281
ISBN: 978-989-758-568-5; ISSN: 2184-4895
Copyright
c
2022 by SCITEPRESS – Science and Technology Publications, Lda. All rights reserved
275

description, based on previous work on caption gener-
ation (Liu et al., 2020) to make our description more
accessible and useful.
To evaluate our pipeline, a sample was taken from
the dataset that was used in evaluating Beagle, a
system to extract SVG-based visualizations from the
internet and classify their visualization type (Battle
et al., 2018). This dataset includes an image of the
visualization and its SVG code. From the latter, the
data and text labels are extracted, and are then used to
calculate and interpret the trend. A description is then
created and included in an alt tag. Because our ex-
traction method is code-based and deterministic, we
achieve 99.74% accuracy in extracting the data for bar
charts.
To summarize, our early work described in this
short paper makes the following contribution:
• we build upon prior data-extraction work to in-
clude forms of checking for accuracy of output
data
• we present a prototype software tool to generate
descriptions of visualizations to be included as alt-
text on webpages
• we also present an evaluation of the effectiveness
of this tool.
2 RELATED WORK
2.1 Classifying Charts Type
Chart type classification is an area that has been re-
searched extensively and researchers have developed
specialized techniques for the task, mainly reliant on
vectorization algorithms (Battle et al., 2018; Huang
and Tan, 2007). This is done by extracting shapes
from vector images of charts and using these shapes
as features for the classification algorithm.
Beagle is an automated system to extract SVG-
based visualizations from the internet (Battle et al.,
2018). It was developed to identify how common in-
teractive visualizations are, as well as the most com-
mon chart types. It includes two components: a web
crawler for identifying and extracting SVG-based vi-
sualizations from webpages, and an annotator for au-
tomatically classifying extracted visualizations with
their corresponding visualization type. Battle et al.
have shown that visualizations on the web mostly fall
under four types: bar graph, line graph, scatter plot
and maps (Battle et al., 2018). Our tool leverages
Beagle’s Annotator in our pipeline to classify three
chart types: bar graph, line graph and scatter plot.
2.2 The Use of Alt-text on the Web
The alt attribute for images was added to HTML in
1995 as an alternative to rendering images on the web
(Berners-Lee and Connolly, 1995). Its accessibility
uses were not mentioned until 1997, where it was
deemed necessary to include the attribute for images
(W3C, 1997). To date, the alt and longdesc attributes
are still the only ways to make images and charts
accessible (D
¨
urnegger et al., 2010). In the case of
SVGs, single graphic elements such as bars can also
be given alt-text. However, many website authors still
do not include these attributes (Morris et al., 2018).
Gleason et al. found that Twitter users do not include
alt-text for photo tweets because they either do not re-
member to add alt-text, lack the time to do so, or did
not know what to write for the description (Gleason
et al., 2019).
Weninger et al. also present several downsides
of adding alt-text to charts (Weninger et al., 2015).
Firstly, the creation of alt-text requires some amount
of effort from the author of the content to create de-
tailed alt-text. Secondly, because charts can be inter-
preted differently depending on the person, the alt-
text will only present the chart in one way and infor-
mation to support other interpretations will be lost to
those reliant on alt-text. When alt-text is included, it
is of low quality (Gleason et al., 2019), despite the
guidelines provided by the W3C (W3C, 2016). Addi-
tional help, such as templates, are needed when writ-
ing alt-text (Morash et al., 2015). We provide this
help in the form of our tool being available for gener-
ating alt-text for charts on the web.
2.3 Generating Alt-text for
Visualizations
Alt-text best practices for visualizations differ from
those of images, in that the text should necessarily be
more descriptive, nuanced, and comprehensive. This
is because they comprise several distinguishing fea-
tures, most prominently metrics, numbers, trends, and
multiple dimensions (Weninger et al., 2015). Jung et
al. suggest that alt-text span two sections: the first
should provide a concise one-line overview of the vi-
sualization, and the second should go into further de-
tail to discuss the chart type, axes labels and range of
values, trends, and other data dimensions (Jung et al.,
2021). The authors recommend structuring alt-text in
a tabular format in a hidden HTML element next to
the visualization (Jung et al., 2021). We leverage as-
pects of their recommendations in our pipeline when
constructing the final alt-text output. Our approach
and resulting prototype would be useful to people
ENASE 2022 - 17th International Conference on Evaluation of Novel Approaches to Software Engineering
276

with vision impairments; and non-technical website
designers who would like to integrate alt-text for vi-
sualizations hosted on their own websites.
3 METHOD OVERVIEW
In this section, we describe the process of how alt-text
can be generated from SVG charts and the evaluation
of the accuracy and usefulness of our Alt-Texify pro-
totype tool. Figure 1 shows the high-level overview
of our Alt-Texify prototype while Figure 2 shows the
user interface.
3.1 Identify Chart Types
The scope of this work is limited to bar charts, line
charts and scatter plots, which have been found to be
the most common chart types on the internet (Bat-
tle et al., 2018). We adopt Beagle Annotator (Battle
et al., 2018) to identify the type of the input chart.
The input chart will only proceed to the data extrac-
tion stage if it matches one of those three chart types.
3.2 Extract Data from Chart
In order to extract data from a bitmap chart we build
upon Revision (Savva et al., 2011) with a different
focus more suited towards alt-text and also adapted
ReV (Poco and Heer, 2017b) for feature detection and
extraction. Our adaptation of Revision focuses more
on extracting a complete series rather than an accurate
set of marks (for line and scatter plot charts).
When extracting marks from a bar chart, small
inaccuracies in the size of the bar are significantly
less egregious than excluding a bar from the entire
graph. In the original Revision approach, the height
and width of the bars are used. From this, the graph
with the highest mode is inferred to be the width,
however, due to potential inaccuracies in the extrac-
tion of a bar’s bounding box affecting the mode dis-
proportionately, our approach identifies the bars with
the lowest variance to be the width. Similarly we
found that during the calculation of the baseline, this
same effect occurred leading us to utilise the median
base value for calculations. Finally, when adding in
small bars which may have been excluded before, we
are more lenient and do not require bars to exactly
touch the baseline. Rather we include them if they
are close to the baseline as our other detected bars.
3.3 Identify Trends
Presenting the title and axes labels are sufficient
enough to obtain an abstract level understanding of
a chart. However, additional descriptions into the de-
tails of a chart would be required to provide a deeper
insight (Liu et al., 2020). To achieve this, provid-
ing additional descriptions such as the minimum and
maximum peaks of a bar graph, general trend for line
graphs and scatterplots would be ideal. We propose
a method to identify the trends for a line graph and
scatter plot and identify peaks for a bar graph.
The extracted data values of a line graph and scat-
ter plot are plotted coordinate points rather than the
actual true value. The line graphs and scatter plots
must be in a consecutive data series to observe the
trend along the series, increasing or decreasing. If
the graph was categorical data, observations would be
done through statistical methods rather than trend ob-
servations.
Regression analysis is a method to determine the
trend of a graph (Draper and Smith, 1981). Multi-
ple regression analysis types such as linear regression,
ridge regression, lasso regression and polynomial re-
gression were taken into consideration for the most
efficient method to analyse the graph trend.
For providing a general trend of the graph lin-
ear regression is sufficient (Draper and Smith, 1981).
Linear regression identifies whether the trend is in-
creasing, decreasing or constant based on the gradient
of the trend line. A drawback of linear regression is
that the sensitivity of the trend line is susceptible to
outliers.
We utilized a different analysis technique for bar
graphs. The categories in bar graphs are independent
of each other and are not able to be described by a
regression line. To provide more insight into the val-
ues of the bar graph we present the lowest and highest
categories of the graph, along with their values. These
results are used in the alt-text generation to give more
insight into the graph.
3.4 Alt-text Generation
There are two segments to an alt-text template. The
first segment is a short overview of the graph and
the second is providing trends, axes ranges, and other
data dimensions (Jung et al., 2021). The order of in-
formation to present inside the first segment for all
classes of charts is the type of chart, chart title, and
then the axes labels name.
We then extend the initial alt-text segment based
on the chart type. For bar graphs, the categories
within the horizontal axis are mentioned first in the
Alt-Texify: A Pipeline to Generate Alt-text from SVG Visualizations
277
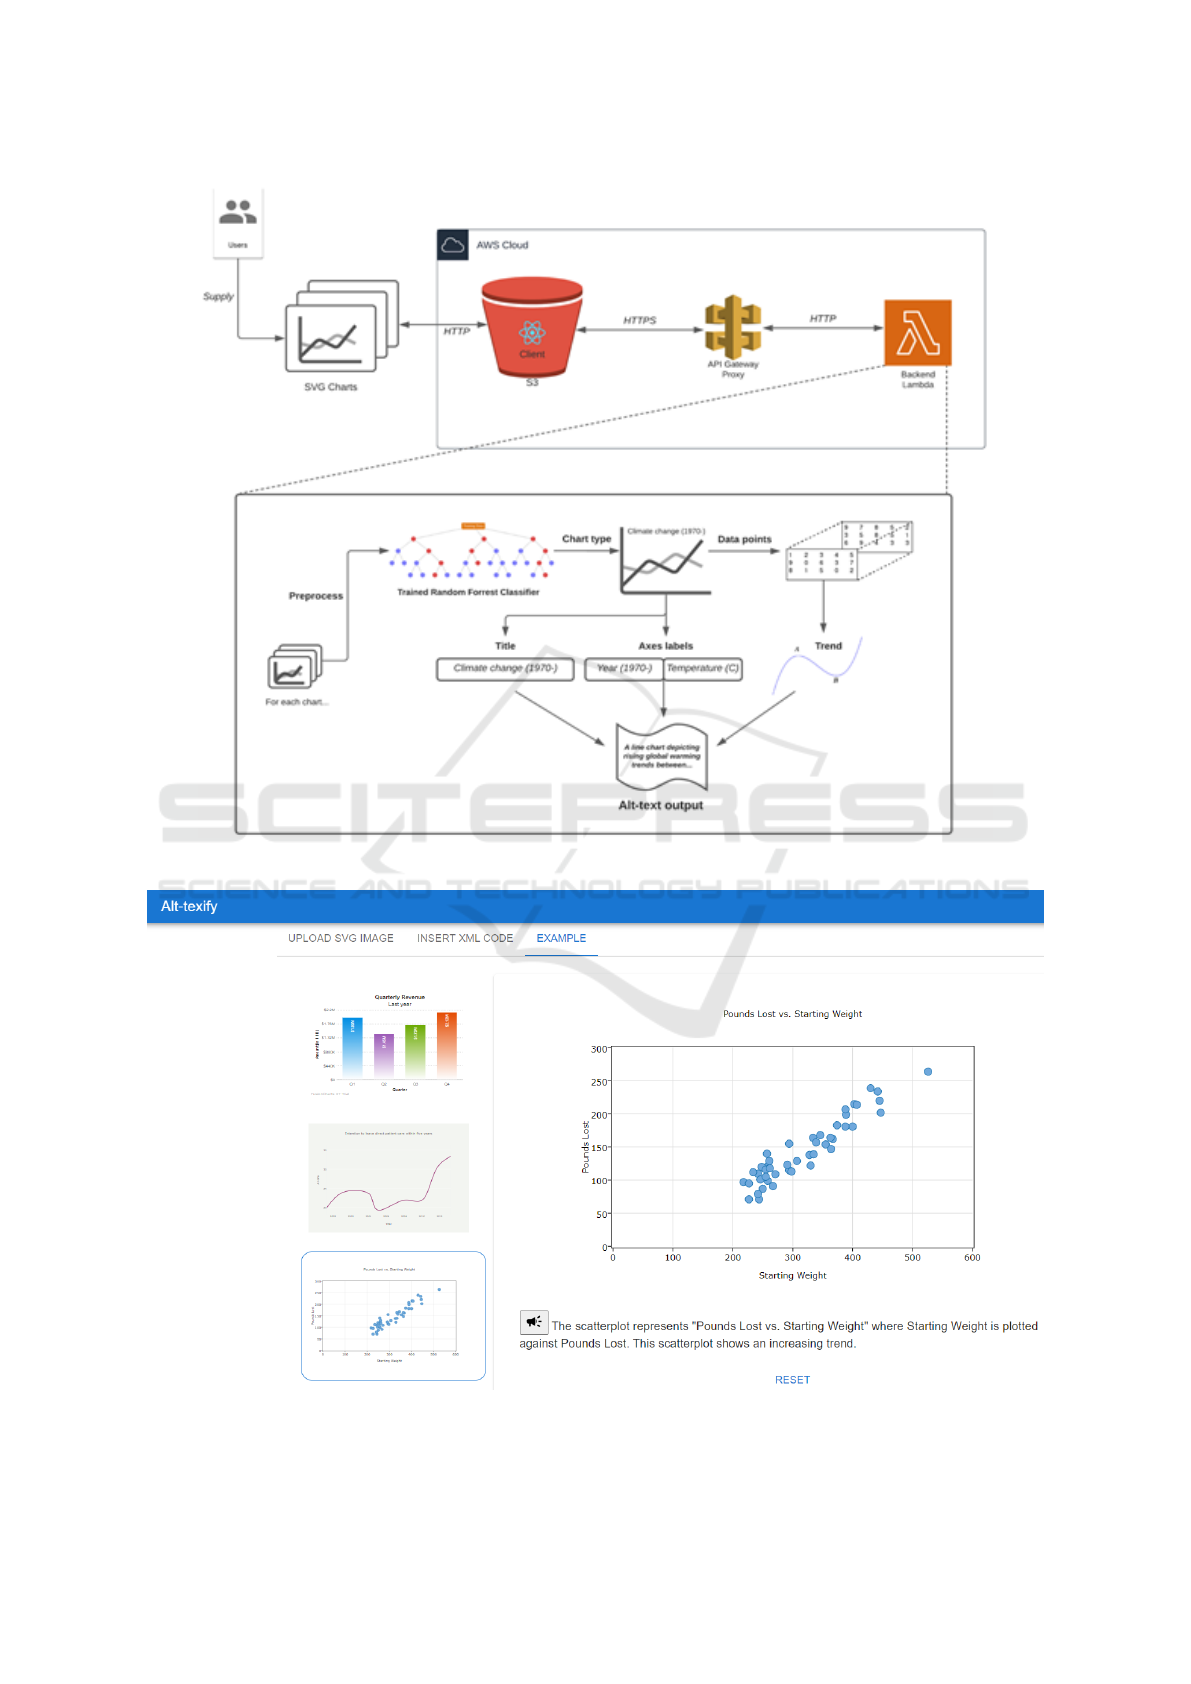
Figure 1: High-level overview of Alt-Texify.
Figure 2: User interface of Alt-Texify.
ENASE 2022 - 17th International Conference on Evaluation of Novel Approaches to Software Engineering
278

second segment, followed by the highest category in
the bar graph and its associated value. The last ad-
dition is the lowest category of the graph and its as-
sociated value. For line graphs and scatterplots, the
first alt-text segment is extended upon by adding the
general trend of the graph. Actual data values were
not included in the alt-text description for line graphs
and scatterplots since we are only analysing the gen-
eral trend. Figure 3 and Figure 4 show sample alt-text
templates for bar charts, line charts, and scatter plots.
3.5 Software Prototype
We created a prototype React web application de-
signed to generate alt-text automatically from SVG
charts. It allows users to either upload a SVG chart
or paste the SVG XML code. As the visually im-
paired are one of our main audiences using this web-
site, this web application follows accessibility guide-
lines such as ARIA tags, keyboard accessibility (Jung
et al., 2021; Mozilla, 2021). It is hosted on an AWS
S3 bucket and the uploaded SVG chart or XML code
is sent to an AWS Lambda for chart logic process-
ing. Our working prototype can be accessed at https:
//tinyurl.com/Alt-Texify.
4 RESULTS
We assess the accuracy of the software developed in
two areas: the accuracy of the extracted data; and the
accuracy of the chart classification. The latter section
reuses the chart classification model discussed by Bat-
tle et al. which classifies the chart type with a reported
accuracy of 86% (Battle et al., 2018). Due to the sim-
ilarities between the source domain, and the domain
of our inputs, we did not perform our own evaluation
of the accuracy of this section of our tool. Errors in
classifying chart types may propagate through the tool
and affect both data extraction and the results of the
alt text-generation.
For line charts and scatter plots, as we extract the
coordinates of each data value directly from the XML
code, data validation was not required. However, to
evaluate the accuracy of the extracted data from the
bar charts, we considered two metrics: the number of
bars extracted, and how much the extracted bound-
ing boxes overlapped with the ground truth bounding
boxes. Testing was done using a random selection
of 2000 images from (Battle et al., 2018), and the
extracted bar bounding boxes were compared to the
ground truth data provided alongside the images. We
exclude charts containing a bar with a bounding box
area of 0, as there is no way for our algorithm to accu-
rately detect this bar. Our method was able to extract
all bars from 95.14% of charts, with a further 4.7%
of the remaining charts having only one bar missing.
There were no instances where there were more bars
detected than were present in the chart. Average de-
tection time was 1.27 seconds. Out of 13,000 bars de-
tected the average overlap percentage is 95.2% which
is sufficiently high enough to perform trend analysis.
5 LIMITATIONS AND FUTURE
WORK
We introduce a prototype end-to-end pipeline for gen-
erating alt-text. As such, it has a number of areas we
hope to see explored in future research. As the com-
pleted tool is intended as an indication of where future
research is needed, and to answer questions about the
niche the tool occupies, it is lacking in some techni-
cal features. Whilst these limitations do not overly af-
fect the conclusions drawn in this early work, they do
nonetheless affect it. One of our primary limitations
is the restricted scope of charts our tool is designed
to work on. There is a necessary balance to be found
between accepting a high number of chart types and
providing a high enough accuracy for a usable tool.
Whilst these limitations would affect the practicality
of a complete tool, they do not constrain our example
overtly.
Furthermore, our next step is to conduct a user
study evaluating our tool with participants with vary-
ing degrees of visual impairment, and normal sighted-
ness. Our user study would cover the five categories
of what makes alt-text accessible, namely: correct-
ness, comprehensibility, coverage, conciseness, and
helpfulness (Obeid and Hoque, 2020).
Another research direction is the generation of
text for auditory processing over visual. The human
brain processes auditory information differently to vi-
sual information (Carterette and Jones, 1967) and thus
designing generated text for consumption of audio
places unique design goals on the text. We found
that prior papers did not consider this, and as such
we aimed to improve upon this method, and pro-
duce text that is easily understandable via just audi-
tory methods. Natural language generation is a well
studied field and an area undergoing research (Gatt
and Krahmer, 2018), however most of these are aimed
at producing text which is aimed to be consumed vi-
sually or converted to auditory mediums via text-to-
speech applications. We propose that future research
should be directed towards the problem of generat-
ing text with an “audio first” approach, such that its
intended method of consumption is through auditory
Alt-Texify: A Pipeline to Generate Alt-text from SVG Visualizations
279
Figure 3: Bar chart template.
Figure 4: Line chart and scatter plot template.
methods. The development and research of this area
would bring a significant improvement to chart com-
prehension for the visually impaired.
6 CONCLUSIONS
In this paper, we introduced Alt-Texify, a pipeline
to classify and extract information from SVG-based
line, bar and scatter charts to create alt-text. The gen-
erated alt-text can assist the visually-impaired in in-
terpreting visualizations on the internet. Our pipeline
consists of three stages: chart classification, extract-
ing the data and alt-text generation. The first stage,
based on previous work, has 86% classification accu-
racy. The second stage achieves 99.74% data extrac-
tion accuracy for bar charts. And the last stage in-
serts the extracted data and labels into a template that
has been created based on previous research on what
makes alt-text helpful and accessible.
ACKNOWLEDGEMENTS
Support for this work from ARC Laureate Program
FL190100035 and Discovery Project DP200100020
is gratefully acknowledged.
REFERENCES
Battle, L., Duan, P., Miranda, Z., Mukusheva, D., Chang,
R., and Stonebraker, M. (2018). Beagle: Automated
Extraction and Interpretation of Visualizations from
the Web, page 1–8. Association for Computing Ma-
chinery, New York, NY, USA.
Berners-Lee, T. and Connolly, D. (1995). Hypertext markup
language - 2.0. Retrieved 9 October 2021 from,
https://datatracker.ietf.org/doc/html/rfc1866.
Carterette, E. C. and Jones, M. H. (1967). Visual and au-
ditory information processing in children and adults.
Science, 156(3777):986–988.
Draper, N. and Smith, H. (1981). Applied Regression Anal-
ysis. Number pt. 766 in Applied Regression Analysis.
Wiley.
D
¨
urnegger, B., Feilmayr, C., and W
¨
oß, W. (2010). Guided
generation and evaluation of accessible scalable vec-
tor graphics. In Proceedings of the 12th International
Conference on Computers Helping People with Spe-
cial Needs: Part I, ICCHP’10, page 27–34, Berlin,
Heidelberg. Springer-Verlag.
Gatt, A. and Krahmer, E. (2018). Survey of the state
of the art in natural language generation: Core
tasks, applications and evaluation. J. Artif. Int. Res.,
61(1):65–170.
Gleason, C., Carrington, P., Cassidy, C., Morris, M. R., Ki-
tani, K. M., and Bigham, J. P. (2019). “it’s almost like
they’re trying to hide it”: How user-provided image
descriptions have failed to make twitter accessible. In
The World Wide Web Conference, WWW ’19, page
549–559, New York, NY, USA.
HTML Standard (2021). Html living stan-
dard. Retrieved 30 September 2021 from,
https://html.spec.whatwg.org/multipage/images.html.
Huang, W. and Tan, C. L. (2007). A system for understand-
ing imaged infographics and its applications. In Pro-
ceedings of the 2007 ACM Symposium on Document
Engineering, DocEng ’07, page 9–18.
Jung, C., Mehta, S., Kulkarni, A., Zhao, Y., and Kim, Y.-S.
(2021). Communicating visualizations without visu-
als: Investigation of visualization alternative text for
people with visual impairments. IEEE Transactions
on Visualization and Computer Graphics, 12(1):1–11.
Jung, D., Kim, W., Song, H., Hwang, J.-i., Lee, B., Kim,
B., and Seo, J. (2017). Chartsense: Interactive data
extraction from chart images. In Proceedings of the
2017 CHI Conference on Human Factors in Comput-
ing Systems, CHI ’17, page 6706–6717.
Liu, C., Xie, L., Han, Y., Wei, D., and Yuan, X. (2020).
Autocaption: An approach to generate natural lan-
guage description from visualization automatically.
In 2020 IEEE Pacific Visualization Symposium (Paci-
ficVis), pages 191–195.
Morash, V. S., Siu, Y.-T., Miele, J. A., Hasty, L., and Lan-
dau, S. (2015). Guiding novice web workers in mak-
ing image descriptions using templates. ACM Trans.
Access. Comput., 7(4).
Morris, M. R., Johnson, J., Bennett, C. L., and Cutrell, E.
(2018). Rich Representations of Visual Content for
Screen Reader Users, page 1–11. Association for
Computing Machinery, New York, NY, USA.
Morris, M. R., Zolyomi, A., Yao, C., Bahram, S., Bigham,
J. P., and Kane, S. K. (2016). ”with most of it being
pictures now, i rarely use it”: Understanding twitter’s
ENASE 2022 - 17th International Conference on Evaluation of Novel Approaches to Software Engineering
280

evolving accessibility to blind users. In Proceedings of
the 2016 CHI Conference on Human Factors in Com-
puting Systems, CHI ’16, page 5506–5516.
Mozilla (2021). Understanding the web content ac-
cessibility guidelines. Retrieved 22 October
2021 from, https://developer.mozilla.org/en-
US/docs/Web/Accessibility/.
Obeid, J. and Hoque, E. (2020). Chart-to-text: Generating
natural language descriptions for charts by adapting
the transformer model. CoRR, abs/2010.09142.
Obie, H. O., Chua, C., Avazpour, I., Abdelrazek, M.,
Grundy, J., and Bednarz, T. (2019). A study of the
effects of narration on comprehension and memorabil-
ity of visualisations. Journal of Computer Languages,
52:113–124.
Poco, J. and Heer, J. (2017a). Reverse-engineering visual-
izations: Recovering visual encodings from chart im-
ages. Comput. Graph. Forum, 36(3):353–363.
Poco, J. and Heer, J. (2017b). Reverse-engineering visual-
izations: Recovering visual encodings from chart im-
ages. Computer Graphics Forum, 36:353–363.
Savva, M., Kong, N., Chhajta, A., Fei-Fei, L., Agrawala,
M., and Heer, J. (2011). Revision: Automated clas-
sification, analysis and redesign of chart images. In
Proceedings of the 24th Annual ACM Symposium on
User Interface Software and Technology, UIST ’11,
page 393–402.
W3C (1997). Objects, images, and applets in html
documents. Retrieved 9 October 2021 from,
https://www.w3.org/TR/html401/struct/objects.html.
W3C (2016). H37: Using alt attributes on
img elements. Retrieved 9 October 2021
from, https://www.w3.org/TR/WCAG20-
TECHS/H37.html.
Weninger, M., Ortner, G., Hahn, T., Druemmer, O., and
Miesenberger, K. (2015). Asvg - accessible scalable
vector graphics: intention trees to make charts more
accessible and usable. Journal of Assistive Technolo-
gies, 9:239–246.
Wu, S., Wieland, J., Farivar, O., and Schiller, J. (2017). Au-
tomatic alt-text: Computer-generated image descrip-
tions for blind users on a social network service. In
Proceedings of the 2017 ACM Conference on Com-
puter Supported Cooperative Work and Social Com-
puting, CSCW ’17, page 1180–1192.
Alt-Texify: A Pipeline to Generate Alt-text from SVG Visualizations
281
