
What Indicators Can I Serve You with? An Evaluation of a
Research-Driven Learning Analytics Indicator Repository
Atezaz Ahmad, Jan Schneider, Joshua Weidlich, Daniele Di Mitri, Jane Yin-Kim Yau,
Daniel Schiffner and Hendrik Drachsler
DIPF, Leibniz Institute for Research and Information in Education, Frankfurt, Germany
Keywords: Learning Analytics, Indicators, Metrics, Learning Events, Learning Activities, Tool, Evidence-based
Research
Abstract: In recent years, Learning Analytics (LA) has become a very heterogeneous research field due to the diversity
in the data generated by the Learning Management Systems (LMS) as well as the researchers in a variety of
disciplines, who analyze this data from a range of perspectives. In this paper, we present the evaluation of a
LA tool that helps course designers, teachers, students and educational researchers to make informed decisions
about the selection of learning activities and LA indicators for their course design or LA dashboard. The aim
of this paper is to present Open Learning Analytics Indicator Repository (OpenLAIR) and provide a first
evaluation with key stakeholders (N=41). Moreover, it presents the results of the prevalence of indicators that
have been used over the past ten years in LA. Our results show that OpenLAIR can support course designers
in designing LA-based learning activities and courses. Furthermore, we found a significant difference between
the relevance and usage of LA indicators between educators and learners. The top rated LA indicators by
researchers and educators were not perceived as equally important from students' perspectives.
1 INTRODUCTION
Over the past few decades, educational organizations
have transformed from the traditional brick-and-
mortar institutions to more open and distance learning
ones through the increased offering of massive open
online courses (MOOCs) and distance learning
courses to full or part-time students, especially in the
time of the Corona pandemic. LA has begun playing
a significant role in this development (Ferguson,
2012). Although research in the field of LA has been
growing steadily previously, the actual uptake by
educational institutions and their teaching staff is still
minimal (Tsai et al., 2018). The reason for the limited
uptake is that there is no proper guidance or awareness
regarding where to start, what data to track, how to
overcome data privacy and the ethical constraints of
tracking students online interactions, how to use it to
improve students’ learning processes, experience or
effectiveness, and how to utilize LA to increase study
success (Ferguson, 2012; Macfadyen et al., 2020).
In the past 10 years of LA research, we have seen
a variety of different metrics/applications adopted to
examine and improve students’ learning experiences
and processes from very basic indicators such as total
page views, login/logout time and frequency
(Fancsali, 2011) to highly sophisticated LA
tools/inferences such as the presentation trainer for
helping learners to master their presentation skills
(Ochoa et al., 2018; Schneider et al., 2016) and
predicting student success (Van Goidsenhoven et al.,
2020). LA applications can track the learning
behaviors for cognitive, metacognitive and
psychomotor learning tasks (Mor et al., 2015; Park et
al., 2017). Nevertheless, in all these LA techniques
and procedures, clear guidelines for aligning the
collected data with the pedagogical models and
acquiring substantial results are still deficient
(Bakharia et al., 2016; Macfadyen et al., 2020). More
specifically, LA can track a large amount of data
relating to teachers' and learners' activities, but it is
still scarce concerning the methods to identify
relevant LA indicators that can support teachers and
learners using tracked datasets (Ferguson, 2012).
There is still a need for improvement in presenting
these inferences and findings to teachers and learners
to support the learning process (Macfadyen et al.,
2020). For example, if someone wants to apply LA to
evaluate students' performance, it is not clear what
relevant metrics to track and how to use these metrics
58
Ahmad, A., Schneider, J., Weidlich, J., Di Mitri, D., Yau, J., Schiffner, D. and Drachsler, H.
What Indicators Can I Serve You with? An Evaluation of a Research-Driven Learning Analytics Indicator Repository.
DOI: 10.5220/0010995800003182
In Proceedings of the 14th International Conference on Computer Supported Education (CSEDU 2022) - Volume 1, pages 58-68
ISBN: 978-989-758-562-3; ISSN: 2184-5026
Copyright
c
2022 by SCITEPRESS – Science and Technology Publications, Lda. All rights reserved

to create meaningful indicators about the students'
performance. Many initial LA approaches, therefore,
reinvent the wheel with the easiest collectible data.
But this approach often ends in counting activities
that are less relevant for the actual learning objectives
and are therefore not meaningful for the learners.
There is a lack of a meta-approach to monitor the
effectiveness of certain metrics and indicators over
time in different settings and contexts. Thus, a
structured approach to collect the empirical evidence
for successful and less-successful LA approaches and
their application domains. Accordingly, there is a
need for a mean that provides clear guidelines to
support teachers and learners. There have been
different initiatives to promote the adoption of LA.
For example, the LACE evidence hub
1
can be used to
provide an overview of the effects of LA studies
according to four propositions; whether they improve
and support learning outcomes, improve learning
support and teaching, are used and developed widely,
and are used ethically (Ferguson & Clow, 2017).
Another example of such initiatives is the LEAF
framework, which is used to extract evidence of
learning from LMS log data to support and assist the
education system (Ogata et al., 2018). From a more
technical point of view, some work on LA has
focused on increasing the interoperability of LA
solutions by looking for standards in the data models
(Del Blanco et al., 2013), considering issues such as
privacy by design (Flanagan & Ogata, 2017; Hoel &
Chen, 2016), design of open LA architectures (Hoel
& Xiao, 2018), etc.
One additional reason that we consider important
for the rollout of LA, is to provide course designers,
teachers and LA researchers with the possibility to
quickly identify LA best practices that can be applied
for their courses or research. To address this issue, we
developed a LA tool that assists users to select
meaningful indicators for their course design or
Learning Analytics Dashboard (LAD) along with
their corresponding metrics already aligned with
learning events and learning activities from Learning
Design (LD) (Ahmad et al., 2020; Gruber, 2019). In
this paper, we evaluated OpenLAIR
2
with senior
researchers, teachers, course designers, PhD students
and university students to assess the usability,
relevance, technology acceptance, and functionality
of OpenLAIR for the design of LA-supported course
designs. The contribution of this paper is to show how
such a tool is perceived and can be improved to
promote the adoption of LA in education.
1
https://lace.apps.slate.uib.no/evidence-hub/
2
https://latool.github.io/
2 OpenLAIR
OpenLAIR is a web application whose aim is to
present users with a structured approach for selecting
evidence-based indicators for educational practice so
that they can get an informed idea on how to
implement LA in their courses. It consists of four
elements: LD learning events, LD-LA activities, LA
indicators and LA metrics.
Learning Events: A learning objective is the
desired outcome of single or multiple learning
events and is used to establish learning
activities to achieve the overall learning
outcome (Bakkenes et al., 2010). (Leclercq &
Poumay, 2005; Verpoorten et al., 2007)
identified and presented the eight learning
events model that includes create, explore,
practice, imitate, receive, debate, meta-
learn/self-reflect, and experiment.
Learning Activities: A study by (Gruber,
2019) took the learning events model and
added learning activities to identify its
outcomes in LD. Learning activities are split
into in-class methods and tools, and online
methods and tools (Gruber, 2019; Kwakman,
2003). Examples of in-class methods and tools
are exercise, exam, presentation, discussion,
and demonstration. On the other hand, online
methods and tools are blogs, wikis, forums,
photo and audio notes, online tests and quizzes,
and e-portfolios.
Indicators: Metrics (measurements) are used
to create indicators. An indicator is the result of
the analysis of one or multiple metrics (e.g.,
number of views, login/logout frequency &
time, etc.) and gives a more comprehensive
picture of a particular (abstract) learner status,
e.g., reading comprehension, self-reflection,
etc. An indicator covers a specific aspect of an
abstract variable (e.g., student performance) by
using relevant (measurable) items.
Metrics: LA applications collect data from the
interaction between learners and LMSs. To
make sense of these captured data, they need to
be categorized in a corresponding unit of
measurement. Examples of metrics are number
of views, login/logout frequency & time, and
number of posts.
The information presented by OpenLAIR is the
result of a literature review, where we harvested and
What Indicators Can I Serve You with? An Evaluation of a Research-Driven Learning Analytics Indicator Repository
59
analyzed 175 LA papers from the last ten years (2011-
2020) and extracted from them LD-LA activities, LA
indicators and metrics based on the classification of
learning events and activities done by (Gruber, 2019;
Kwakman, 2003; Leclercq & Poumay, 2005). We
applied the framework shown in Figure 1 to link the
LA indicators and metrics with the LD-LA activities.
The publication outlets include Learning Analytics
and Knowledge Conference (LAK), Journal of
Learning Analytics (JLA), European Conference for
Technology Enhanced Learning (ECTEL), IEEE
Transactions on Learning Technologies, as well as
special issues for Learning Analytics in the Journal of
Computer Assisted Learning (JCAL).
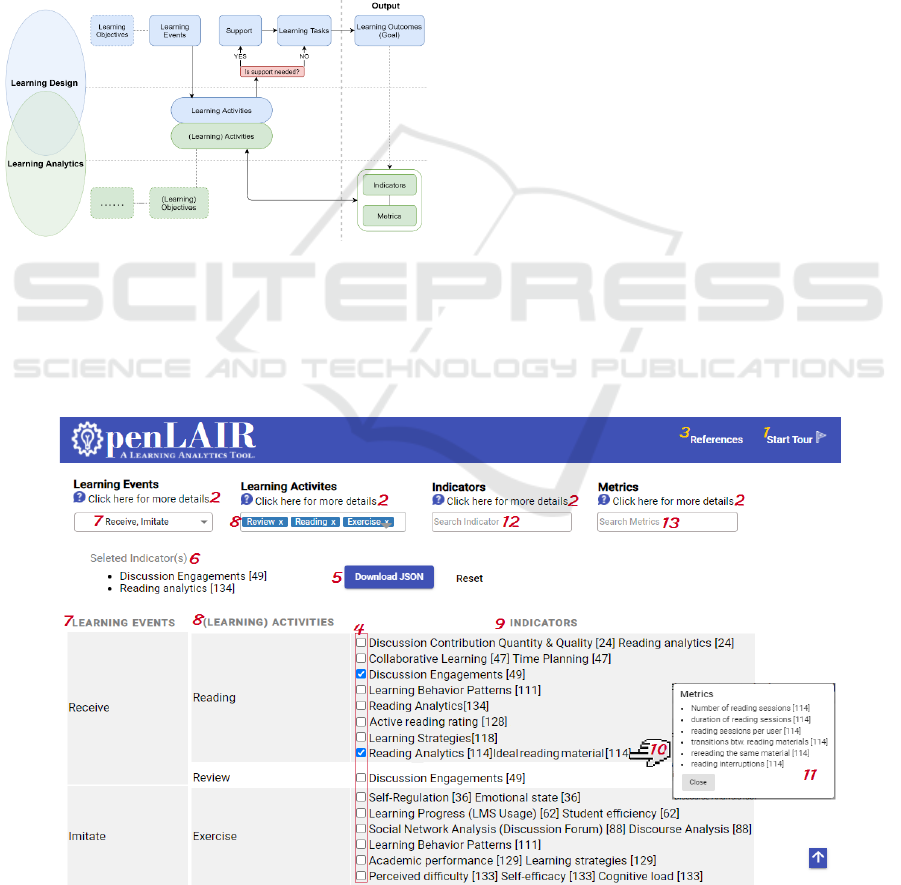
Figure 1: Proposed reference framework (Based on Ahmad
et al., 2020).
The proposed reference framework is based on
LD and LA elements. In LD and LA, it starts with a
learning objective, wherein LD the objective can be a
learning event or can lead to a learning event (refer to
the definition of learning event above). Then it leads
to learning activities. In LD, to fulfill a learning
activity, a learning task is required whether the
support (such as learning materials) is needed or not,
which leads to learning outcomes. In LA, learning
activities in a learning environment leads to the
generation of log data that forms metrics, and metrics
help create indicators for LADs. The learning
outcome in LD can be shown or presented via LA
indicator(s) for selected LD-LA activities. Our tool
uses the LD events and LD-LA activities and
provides LA indicators as an output for LD outcome.
2.1 OpenLAIR Features
OpenLAIR home page offers four filters/elements i.e.
learning events, learning activities, indicators, and
metrics, which are used to filter the desired learning
activities or indicators based on the learning event
(see Figure 2).
OpenLAIR offers a tour guide in order to help the
user understand the process by explaining all the
essential elements of OpenLAIR. The tour guide can
be started anytime by clicking the ‘Start Tour’ (see
Figure 2 no. 1) button in the top right corner.
OpenLAIR also offers definitions along with
examples. To see the explanation, users can click on
the text ‘Click here for more details’ (see Figure 2 no.
2), which is repeated for every element in OpenLAIR.
As this tool is the outcome of a literature review and
learning activities, indicators and metrics are
harvested from LA articles, every indicator under the
Figure 2: OpenLAIR interface.
CSEDU 2022 - 14th International Conference on Computer Supported Education
60
indicators column is followed by a reference number.
To see the reference users can click on the
‘References’ (see Figure 2 no. 3) button in the top
right corner. In front of every indicator, a checkbox
(see Figure 2 no. 4) is used for selecting a particular
indicator(s). OpenLAIR also offers a download
button (see Figure 2 no. 5) to download the selected
(see Figure 2 no. 6) indicators in JavaScript Object
Notation (JSON) format along with the metrics.
OpenLAIR can be used by selecting the desired
learning events (see Figure 2 no. 7). The event(s)
section will update the list of learning activities. The
selection of learning activities (see Figure 2 no. 8)
will update the list of possible indicators (see Figure
2 no. 9) that can be used for the desired learning
scenario. Every indicator is also clickable (see Figure
2 no. 10) and will show the list of metrics in a popup
window (see Figure 2 no. 11), which helps in
selecting relevant indicators. After the section of
relevant indicators by ticking the checkbox,
OpenLAIR will populate the list above (see Figure 2
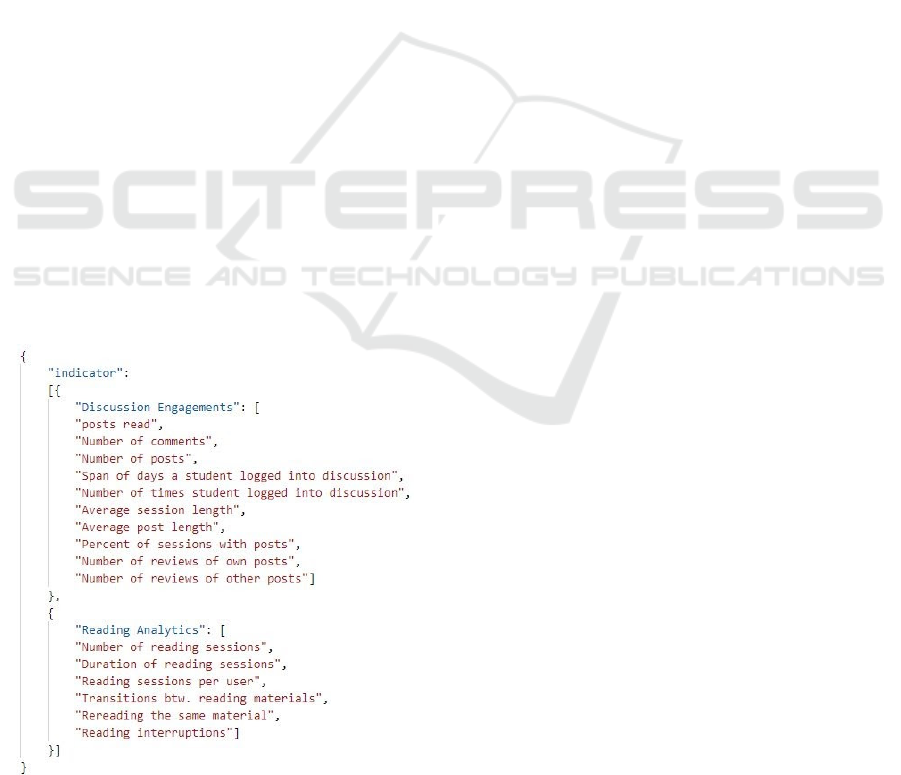
no. 6). Then the selected indicators can be
downloaded as JSON into the local repository (see
Figure 3). This JSON file consists of already tested
metrics used to develop the selected indicator(s)
successfully. Furthermore, OpenLAIR also has an
indicator search function, instead of choosing the
learning event or activity, one can use the indicator
search function by typing the indicator name in the
textbox (see Figure 2 no. 12). Similarly, OpenLAIR
also offers search indicator(s) by metrics (see Figure
2 no. 13). OpenLAIR will provide the search results
by filtering and highlighting the results.
Figure 3: JSON example for downloaded indicators.
OpenLAIR is aimed to support different types of
users. Teachers can use this already tested/existing
knowledge to select relevant learning activities that
may lead students to understand the topic/course
better. Instead of reinventing the wheel,
researchers/developers can use this knowledge to
design a LA indicators dashboard using the metrics
provided by OpenLAIR. This is a starting point or a
guide for teachers or researchers to use this already
existing knowledge to design a successful course or
apply LA.
3 RESEARCH METHODOLOGY
In this study, we evaluated OpenLAIR with the main
aim to identify how such a tool can support the
implementation of LA. We guided our study with the
following research questions to investigate the
usability, ease of use, usefulness, relevance of
OpenLAIR and the relevance of indicators:
RQ1: What is the perceived usability, ease of
use and usefulness of OpenLAIR?
To answer this question, we observed how
participants used OpenLAIR and applied
standardized self-report scales with the addition of
extra questions that were suited for our specific
scenario.
RQ2: How do users perceive the relevance of
OpenLAIR with respect to key Learning
Analytics implementation steps (i.e. planning,
designing, implementing LA for their LD)?
To answer this question, we will focus on
inquiring whether the presented information by
OpenLAIR can help to implement LA and design a
course. We will also explore to what extent
OpenLAIR plays a relevant role in the design of a
course and the development of LADs. It is also
important to identify important factors that might
influence the adoption and usage of OpenLAIR.
RQ3: How do users perceive the relevance of
main LA indicators and are there significant
differences across potential user groups?
To answer this question, we will provide four
different scenarios and will ask participants to rate the
relevance and usage of the indicators based on the
given use case.
3.1 Participants and Procedure
For the evaluation of OpenLAIR, we were able to
recruit 41 participants (12 females, 26 males, and 3
did not specify their gender). This sample consists of
12 senior researchers (mean age 36), 13 junior
What Indicators Can I Serve You with? An Evaluation of a Research-Driven Learning Analytics Indicator Repository
61

researchers (mean age 30), and 16 university
computer science students (mean age 26). Further,
senior researchers consist of those holding a PhD and
work as teachers, course designers, and/or
researchers. Juniors consist of PhD candidates that do
some teaching activities and are LA or LD
researchers. The students consist of 15 master’s
students and one bachelor’s student. All the
evaluations were conducted individually and online
using a teleconferencing OpenLAIR by the first
author. The procedure started with a short
introduction to OpenLAIR and the provision of a link
for accessing it. Once participants accessed
OpenLAIR, the main researcher asked them to start
and follow the tour guide. In the next step,
participants had a time frame of five minutes to
explore and read the definitions of LD and LA
provided by OpenLAIR.
To explore the potential of OpenLAIR from
different perspectives, we created three use cases to
guide the participants. In the first use case,
participants were tasked with finding indicators for
their ‘English Reading Class’ using OpenLAIR and
downloading relevant indicators together with their
corresponding metrics as a JSON file. This could be
achieved by first selecting the LD events and
activities suitable for the use case, selecting suitable
indicators from the filtered list provided by
OpenLAIR, and finally by downloading the JSON
file. For the second use case, participants were asked
to use OpenLAIR to identify learning events and
learning activities suitable for the indicator “Text
Analysis”. The reason for this use case was to see if
the participants can use and understand the indicator
search function and can find the learning activities
and events associated with the indicator. In the final
use case, the main researcher asked participants to use
OpenLAIR for their own scenario and find the
indicators that they think are relevant and download
them. During the participants' interaction with
OpenLAIR, the main researcher took notes about
their comments and behavior.
3.2 Apparatus and Material
To identify the participant background (i.e., age,
gender, profession), OpenLAIR usability, OpenLAIR
technology acceptance (usefulness and ease of use),
and specific questions related to OpenLAIR
participants answered a survey. To extract the
usability of OpenLAIR the survey contained the
System Usability Scale (SUS) questions (Brooke,
1986). For measuring usefulness and ease of use the
survey contained items from the Technology
Acceptance Model (TAM) (Davis, 1985). We further
asked general questions in the survey about
OpenLAIR tour guide, list of learning events, list of
learning activities, list of indicators, list of metrics,
and questions concerning the importance, relevance
and usage of OpenLAIR in LA and designing
learning activities.
We also asked four questions regarding the
relevance of the indicators. To this end, we presented
a list of most used indicators over the past ten years
(2011-2020) of LA, adding the top six indicators to
our survey and asking participants to rate the
perceived indicator relevance. The indicators
presented were Predictive analytics, Performance,
Self-regulation, Social network analysis, Learning
(behavior) patterns, and Engagement.
4 RESULTS
When interacting with OpenLAIR for the first use
case (finding relevant indicators for English reading
class), the learning event “Receive” was the most
common one selected by participants (35 out of 41
times). The most common selected learning activity
was “Reading” (41 out of 41 times). The process of
filtering learning event(s) and learning activities for
selecting the indicators went smoothly without any
problems or confusion, apart from two university
students. Understanding the concept behind the
selection of learning events took them more time and
led them to view the definition more than once. For
the second use case, we observed that the majority of
participants used the indicator search function
correctly to find the indicator “Text Analysis”. Based
on this search they selected suitable learning activities
and events. There were no issues or confusions
reported during this procedure. For the third use case
(using OpenLAIR for their own scenario) we noticed
that almost all the participants (38 out of 41) used
OpenLAIR accurately and successfully searched for
the learning activities and indicators they intended for
in the first attempt. Only three of the participants had
some difficulties in the selection of the learning
events or activities for their particular scenario but
after some time/delay and a few revisits to the lists,
they successfully achieved the anticipated results.
To measure OpenLAIR usability we use SUS
(Brooke, 1986) (see Table 1). The maximum value is
7 (agree) and the minimum value is 1 (disagree). Each
column value presents the mean (M) of the SUS
items. The SUS items were presented to three types
of participants after the study.
CSEDU 2022 - 14th International Conference on Computer Supported Education
62
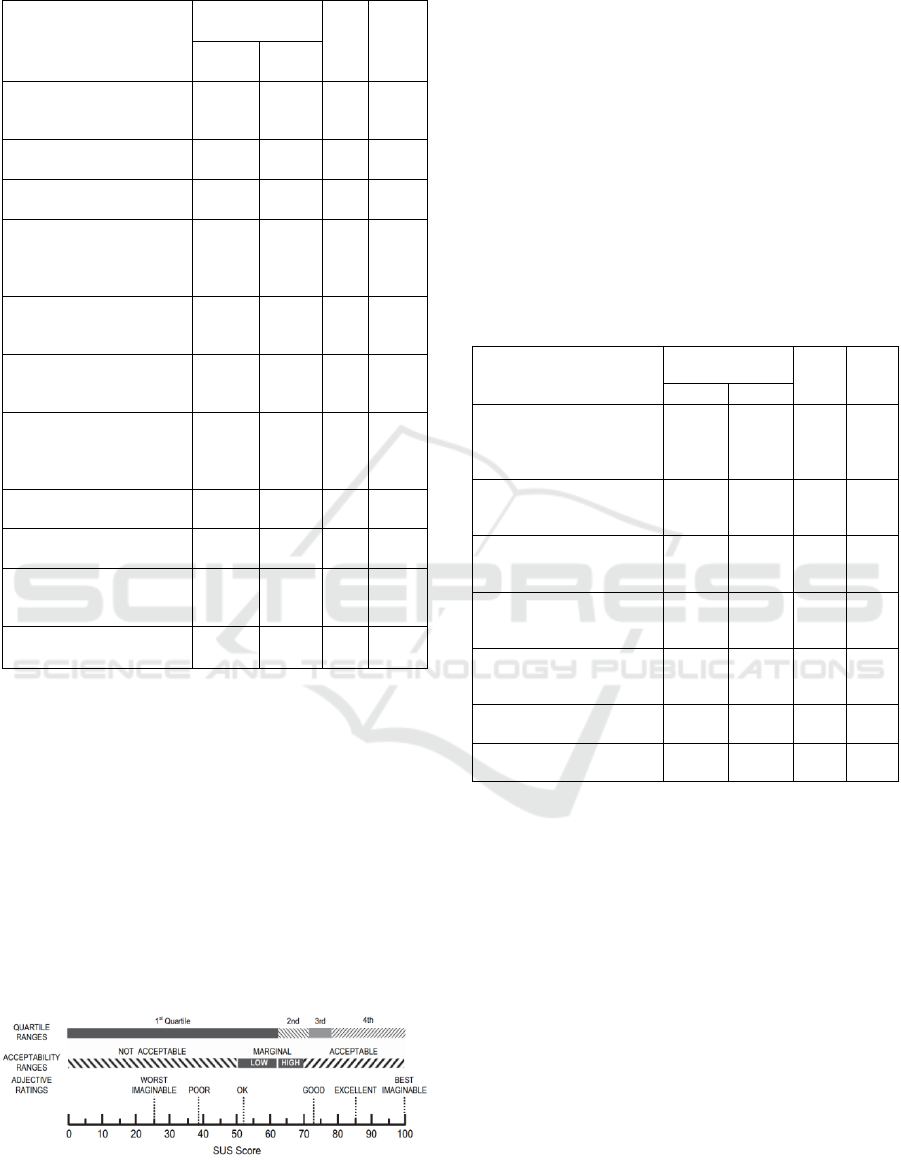
Table 1: System usability score for OpenLAIR.
SUS items Teachers/
researchers M
Stud.
M
M
Seniors Junior
s
1. I think that I would like
to use OpenLAIR
frequently.
5.4 4.6 5.1 5.2
2. I found OpenLAIR
unnecessarily complex.
1.9 2.1 1.4 1.8
3. I thought OpenLAIR
was easy to use.
5.9 5.6 6.4 5.9
4. I think that I would
need the support of a
technical person to be able
to use OpenLAIR.
1.9 1.8 2.2 2.0
5. I found the various
functions in OpenLAIR
were well integrated.
5.7 5.9 6.2 5.9
6. I thought there was too
much inconsistency in
OpenLAIR.
1.8 1.7 1.6 1.7
7. I would imagine that
most people would learn
to use OpenLAIR very
quickly.
5.9 6.1 6.6 6.1
8. I found OpenLAIR very
cumbersome to use.
1.7 1.9 1.4 1.7
9. I felt very confident
using OpenLAIR.
5.9 5.5 6.4 5.9
10. I needed to learn a lot
of things before I could
get going with OpenLAIR.
1.9 1.9 2.3 2.0
SUS mean score 5.5 5.4 5.7 5.5
(79%)
*Stud. M = University students mean
To find the SUS value, the SUS item values (such
as numbers 2, 4, 6, and 8) are inverted. Then we
calculated a mean of the values (see Table 1 last
column) of all the participants and converted it to a
percentage. The overall SUS acceptability score is
79% (see Table 1 last row). According to Bangor
(Bangor et al., 2008) SUS scale, 79% is a good
adjective rating and falls into an acceptable range (see
Figure 4). We conducted an ANOVA test to compare
the overall SUS scores from the three groups and
found no significant differences, meaning that the
usability of OpenLAIR does not depend on the type
of user.
Figure 4: SUS scores by quartile, adjective ratings, and the
acceptability of the overall SUS score (Bangor et al., 2008).
To measure OpenLAIR usefulness and ease of use
we used items adapted from TAM (Davis, 1985).
Table 2 presents the mean of the TAM usefulness for
OpenLAIR of all the participants. The values (1 to 7)
in columns are the mean of the responses for each
TAM usefulness item. To find the usefulness we
summed all the values in the mean column and
divided them by the total number of items. The
overall TAM usefulness mean score is 5.17 out of 7
(see Table 2 last row). We conducted an ANOVA test
to compare the overall TAM usefulness scores from
the three groups and found no significant differences,
meaning that the usefulness of OpenLAIR does not
depend on the type of user.
Table 2: TAM usefulness for OpenLAIR.
TAM usefulness items Teachers/
researchers M
Stud.
M
M
Seniors Juniors
Using OpenLAIR in my
job/work would enable me
to accomplish tasks more
quickly.
5.42 5.31 5.63 5.45
Using OpenLAIR would
improve my job/work
performance.
5.08 4.85 5.19 5.04
Using OpenLAIR in my
job/work would increase
my productivity.
5.08 5.00 5.06 5.05
Using OpenLAIR would
enhance my effectiveness
on the job/work.
5.17 4.62 5.19 4.99
Using OpenLAIR would
make it easier to do my
job/work.
4.83 5.08 5.38 5.10
I would find OpenLAIR
useful in my job/work.
5.58 5.38 5.25 5.40
TAM usefulness mean
score
5.19 5.04 5.28 5.17
Table 3 presents the mean of the TAM ease of use
for OpenLAIR for each item. To measure ease of use
we calculated the mean of the last column and divided
them by the total number of items. Thus the overall
TAM ease of use score is 6.23 out of 7 (see Table 3
last row). We conducted an ANOVA test to compare
the overall TAM ease of use scores from the three
groups and found no significant differences, meaning
that the ease of use of OpenLAIR does not depend on
the type of user.
Table 4 shows the mean values of the tool specific
questions. All the values (1 to 7) are the mean of each
question item for all the responses. The final right
column consists of the mean of all participants
groups. We conducted an ANOVA test to compare
the overall scores for other tool specific questions
from the three groups and found no significant
differences.
What Indicators Can I Serve You with? An Evaluation of a Research-Driven Learning Analytics Indicator Repository
63

Table 3: TAM ease of use for OpenLAIR.
TAM ease of use items Teachers/
researchers M
Stud.
M
M
Seniors Juniors
Learning to operate OpenLAIR
would be easy for me.
6.33 6.31 6.56 6.40
I would find it easy to get
OpenLAIR to do what I want it
to do.
6.17 6.23 6.13 6.18
My interaction with OpenLAIR
would be clear and
understandable.
6.17 6.15 6.13 6.15
I would find OpenLAIR to be
flexible to interact with.
5.75 5.85 6.13 5.91
It would be easy for me to
become skillful at using
OpenLAIR.
6.33 6.38 6.44 6.38
I would find OpenLAIR easy to
use.
6.33 6.08 6.63 6.35
TAM ease of use mean score 6.18 6.17 6.34 6.23
Table 4: Tool specific questions.
Tool specific questions items Teachers/
researchers M
Stud.
M
M
Senio
r
s Junio
r
s
I am satisfied with the list of
learning activities provided by
OpenLAIR.
5.8 6.3 6.6 6.2
I am satisfied with the list of
indicators provided by
OpenLAIR.
5.9 6.2 6.4 6.2
I am satisfied with the list of
metrics provided by OpenLAIR.
6.0 6.2 6.2 6.1
I find OpenLAIR suitable to find
relevant indicators to support the
implementation of LA or
designing a course.
5.7 5.9 6.2 5.9
I find the
guidelines/measurements/metrics
useful to support the
implementation of LA.
5.2 5.8 5.9 5.6
I find OpenLAIR relevant to
correctly implement LA for my
learning design (or activities).
5.6 5.2 6.2 5.7
OpenLAIR tour guide helped me
to understand and know how to
use the tool.
5.8 5.8 6.4 6.0
I would like to use OpenLAIR
the next time I design a course,
learning activity, or seek relevant
indicators.
5.7 6.1 6.1 6.0
How would you rate that
OpenLAIR is providing the right
implementation of LA
(indicators & metrics) for your
learning design (learning events
or activity)?
5.3 5.6 5.9 5.6
Having the option to see a mock-
up (visualization) of the selected
indicators will help me to make a
better selection/design
.
6.1 6.5 6.8 6.5
Tool specific items mean score 5.5 5.8 6.1 5.8
In our evaluation, we asked the participants to rate
these most used top six indicators (1 not useful - 7
very useful). The presented indicators include
Predictive analytics (including At-Risk Students,
Academic success, Dropout prediction, Early
warning, Grade prediction, Success prediction,
Predict performance, Retention prediction),
Performance (including Academic performance,
Student performance), Self-regulation (Or Self-
efficacy, Self-motivation, Alerting, Feedback,
Awareness), Social network analysis (including
Connectedness, Online Discussion Behavior,
Collaboration), Learning (behavior) patterns
(including Student interaction patterns, Student
behavior, Learning behavior, Learning strategies),
Engagement (including Keystroke analytics,
Clickstream analysis, disengagement, Long term
engagement). Each indicator (see Table 5) is rated
four times by asking four questions with different
scenarios. These questions were asked to teachers and
researchers in the following way:
Q1. As a teacher/researcher, how relevant are
these indicators?
Q2. As a teacher/researcher, how relevant are
these indicators to provide personalized
feedback to students?
Q3. As a teacher/researcher, how relevant are
these indicators to get an overview of the
students’ progress?
Q4. As a teacher/researcher, how relevant are
these indicators to adapt/improve students'
learning?
From students, we asked the following questions:
Q1. As a student, how relevant are these
indicators?
Q2. As a student, how relevant are these
indicators to provide personalized feedback?
Q3. As a student, how relevant are these
indicators to get an overview of your progress?
Q4. As a student, how relevant are these
indicators to adapt/improve learning?
To assess group differences in relevance ratings
of indicators, a variable was constructed via mean
ratings across all four questions i.e.,
(Q1+Q2+Q3+Q4)/4. Because of relatively small cell
sizes, we expect violated assumptions from this, thus
opting for a non-parametric alternative to Analysis of
Variance (ANOVA), the Kruskall-Wallis (Kruskal &
Wallis, 1952; McKight & Najab, 2010) test. The
omnibus test revealed significant group differences
for five of the six indicators, Predictive Analytics: X
2
(2) = 14.23, p <.001; Performance: X
2
(2) = 9.04, p
=.011; Self-Regulation: X
2
(2) = 9.06, p =.011; Social
Network Analysis: X
2
(2) = 10.55, p =.005;
CSEDU 2022 - 14th International Conference on Computer Supported Education
64
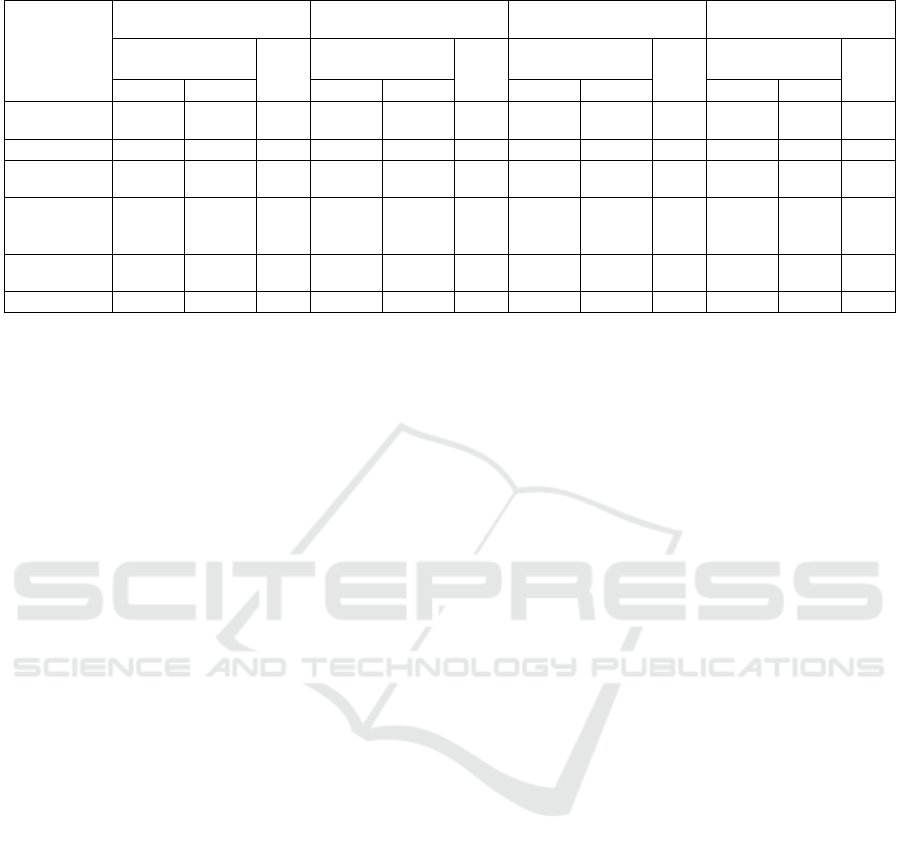
Table 5: The relevance of the most used indicators.
Indicators
Q1 (General relevance) Q2 (Personalized
Feedback)
Q3 (Overview Student
progress)
Q4 (Improve Learning)
Teachers/
researchers M
Stud
M
Teachers/
researchers M
Stud
M
Teachers/
researchers M
Stud
M
Teachers/
researchers M
Stud
M
Seniors Juniors Seniors Juniors Seniors Juniors
Seniors Juniors
Predictive
analytics
5.17 5.46 2.81 5.58 5.15 3.13 5.08 5.23 3.13 4.75 4.92 3.00
Performance 5.50 6.08 5.00 5.58 5.69 5.69 5.75 5.92 5.94 5.33 5.38 6.00
Self-
regulation
4.75 5.46 5.50 5.50 5.69 5.63 4.83 4.23 5.56 4.83 4.69 5.88
Social
network
analysis
4.67 4.69 2.94 4.50 4.38 2.88 5.00 4.85 2.63 4.58 4.15 2.88
Learning
patterns
5.33 5.23 5.25 4.58 4.69 5.56 5.00 4.62 5.19 4.92 4.54 5.31
Engagement 5.00 5.69 5.00 5.00 5.62 4.94 5.42 5.77 4.94 5.92 5.77 5.31
Engagement: X
2
(2) = 10.60, p =.005. For Learning
(Behavior) Patterns, group differences did not amount
to statistical significance, X
2
(2) = 5.99, p =.05.
Following up for significant omnibus tests,
Dwass-Steel-Critchlow-Fligner pairwise comparison
further supports the descriptive impression that
students reported lower relevance ratings across
many indicators, especially compared to seniors,
while there are also some less pronounced differences
between juniors and seniors as well as juniors and
students (see Table 5). Significant group differences
are found between seniors and students for Predictive
Analytics, W = 4.67, p = .003; Performance, W = 3.84,
p = .002; Social Network Analysis, W = 4.24, p =
.008. Significant differences between juniors and
students were found for Predictive Analytics only, W
= 4.01, p = .013, while significant group differences
were found between seniors and juniors for Self-
Regulation, W = 4.24, p = .008; Performance, W =
3.54, p = .033; Engagement, W = 5.03, p = .001.
5 DISCUSSION
RQ1 concerns the usability, ease of use and
usefulness of OpenLAIR. Our results from SUS
revealed that the participants rated the usability of
OpenLAIR as good and are acceptable. This can be
taken to mean that our tool did not show any big
usability issues, participants were able to quickly
learn how to use it and accomplished the prescribed
tasks without major problems. This is important
because (for example) system usability has been
shown to be an important predictor of actual system
use and user experience (Brooke, 1986). Similarly,
(Drew et al., 2018; Peres et al., 2013) showed that
SUS is a valid method and provides adequate results.
It is presumably safe to say that SUS will be a
common method in the foreseeable future (Lewis,
2018).
Regarding usefulness and ease of use, the results
from TAM showed decent ratings. Our results from
TAM perceived usefulness showed that OpenLAIR is
versatile enough to play a significant role in the
accomplishment of a relevant task. Furthermore, our
results from TAM perceived ease of use showed that
OpenLAIR is easy and straightforward to use and can
be handled independently. TAM is still popular and
valid for predicting the technology acceptance of a
system (Marangunić & Granić, 2015), especially, the
systems or tools related to information technology
(Al-Emran et al., 2018). Regardless of some
uncertainty reported by researchers on its theoretical
assumptions, TAM is still a popular, most used and
cited model (Chuttur, 2009). Therefore we believe
that it answers RQ1 up to a considerable degree.
RQ2 belongs to identifying the relevance of
OpenLAIR and if the information presented by
OpenLAIR were useful for the participants in the
implementation of LA. Our results showed that
overall good scores on SUS, TAM and tool specific
questions are independent of possible user types, thus
providing evidence for the suitability of this tool for
users with different degrees of knowledge and
experience in using the tool. It means that OpenLAIR
can help users to select useful and suitable LA
indicators based on the established LD events and
learning activities. Our results showed no significant
difference between educators and students in the
evaluation of the tool. Likewise, (van Leeuwen &
Rummel, 2020) showed that there is no significant
difference found in the results of teachers and
students evaluating LA applications, which aligns
with our findings.
What Indicators Can I Serve You with? An Evaluation of a Research-Driven Learning Analytics Indicator Repository
65

Similarly, participants provide a good score for
the list of learning activities, indicators and metrics
presented by OpenLAIR. The results showed that the
participants were satisfied with the list of learning
activities, indicators and metrics to support users in
designing learning experiences while applying LA.
There was a good rating that the participants will use
OpenLAIR next time when they design a course,
learning activity, or seek relevant indicators for LAD.
The metrics (guidelines or measurements) presented
by OpenLAIR were sufficiently rated that they
support the implementation of LA indicators. The
tour guide of OpenLAIR was adequately rated and
was considered helpful in providing an overview of
the tool and its functions by all the participants. As
stated by (Chiao et al., 2018; Joachims et al., 1997)
that the web tour guide is an effective and interactive
way of communicating and guiding users. Therefore,
we argue that OpenLAIR supports to a great extent
the implementation of LA based on established
learning events and activities from LD.
RQ3 deals with the relevance of LA indicators and
their significant differences across potential user
groups. Unexpectedly, our results showed that there
were evident differences between the groups of
participants. Our tests revealed that university
students rated lower relevance across many
indicators, whereas educators and researchers
reported higher ratings across all the indicators. It
means that the LA indicators that are developed,
researched and valued the most in the LA community
were found less relevant to the students or learners in
practice. We think that it is important to consider
students' opinions in the implementation of LA,
similarly argued in the studies (Schumacher &
Ifenthaler, 2018; Slade et al., 2019; Tsai & Gasevic,
2017) that it is necessary to keep the student and their
opinion in the loop.
This study has one main limitation. We
acknowledge that there could be a small margin of
human lapses or slips in the data harvesting or adding
some learning activities, indicators, metrics and
research papers to OpenLAIR. Nonetheless, we
consider that our current list of activities, indicators
and metrics are sufficiently exhaustive to provide
satisfactory results to the users. The study is
continued, and we will be adding/updating the data
and literature (for the years 2020/2021) to our tool.
6 CONCLUSION
In this paper we evaluated OpenLAIR with user tests
performed by different LA stakeholders such as
senior and junior researchers and university students.
Results from our evaluation show that OpenLAIR
presents no big usability issues and it has a good
perception in terms of technology acceptance.
Furthermore, in this paper, we investigated the
relevance and usage of LA indicators and we found
some significant differences between the perceived
relevance of LA indicators from LA stakeholders,
pointing out the importance to include all of them in
the design and implementation of LA interventions.
For future work, we envision three main research
directions. First, to investigate how the data presented
in OpenLAIR can be connected to an LMS database
and provide students and teachers instant feedback by
the activities they perform in the LMS. Similarly, a
study (Iraj et al., 2020), considers student interactions
and activities in LMS for providing personalized
feedback. Second, to investigate how to dynamically
present the selected indicators and metrics into
visualizations similar to functional LAD. This
dynamically rendered LAD will help users to better
understand the working and meaning of the selected
indicators. The rendered dashboard can also be
downloaded and used as a mock-up. Third, to
investigate how OpenLAIR can automatically or
semi-automatically update the list of LA indicators
and metrics with the purpose to keep the data up to
date with current LA research.
We foresee this work as a substantial step to
organize and make sense out of the heterogeneity of
the LA field and therefore support the design,
implementation and rollout of LA interventions.
REFERENCES
Ahmad, A., Schneider, J., & Drachsler, H. (2020).
OpenLAIR an Open Learning Analytics Indicator
Repository Dashboard. Addressing Global Challenges
and Quality Education: 15th European Conference on
Technology Enhanced Learning, EC-TEL 2020,
Heidelberg, Germany, September 14–18, 2020,
Proceedings, 467–471. https://doi.org/10.1007/978-3-
030-57717-9_46
Al-Emran, M., Mezhuyev, V., & Kamaludin, A. (2018).
Technology Acceptance Model in M-learning context:
A systematic review. Computers \& Education, 125,
389–412.
Bakharia, A., Corrin, L., De Barba, P., Kennedy, G.,
Gašević, D., Mulder, R., Williams, D., Dawson, S., &
Lockyer, L. (2016). A conceptual framework linking
learning design with learning analytics. Proceedings of
the Sixth International Conference on Learning
Analytics & Knowledge.
Bakkenes, I., Vermunt, J. D., & Wubbels, T. (2010).
Teacher learning in the context of educational
CSEDU 2022 - 14th International Conference on Computer Supported Education
66

innovation: Learning activities and learning outcomes
of experienced teachers. Learning and Instruction,
20(6), 533–548. https://doi.org/10.1016/
j.learninstruc.2009.09.001
Bangor, A., Kortum, P. T., & Miller, J. T. (2008). An
empirical evaluation of the system usability scale. Intl.
Journal of Human--Computer Interaction, 24(6), 574–
594.
Brooke, J. (1986). System usability scale (SUS): a quick-
and-dirty method of system evaluation user
information. Reading, UK: Digital Equipment Co Ltd,
43, 1–7.
Chiao, H.-M., Chen, Y.-L., & Huang, W.-H. (2018).
Examining the usability of an online virtual tour-
guiding platform for cultural tourism education.
Journal of Hospitality, Leisure, Sport \& Tourism
Education, 23, 29–38.
Chuttur, M. Y. (2009). Overview of the technology
acceptance model: Origins, developments and future
directions. Working Papers on Information Systems,
9(37), 9–37.
Davis, F. D. (1985). A technology acceptance model for
empirically testing new end-user information systems:
Theory and results. Massachusetts Institute of
Technology.
Del Blanco, Á., Serrano, Á., Freire, M., Mart\’\inez-Ortiz,
I., & Fernández-Manjón, B. (2013). E-Learning
standards and learning analytics. Can data collection be
improved by using standard data models? 2013 IEEE
Global Engineering Education Conference
(EDUCON), 1255–1261.
Drew, M. R., Falcone, B., & Baccus, W. L. (2018). What
does the system usability scale (SUS) measure?
International Conference of Design, User Experience,
and Usability, 356–366.
Fancsali, S. E. (2011). Variable construction for predictive
and causal modeling of online education data.
Proceedings of the 1st International Conference on
Learning Analytics and Knowledge, 54–63.
Ferguson, R. (2012). Learning analytics: drivers,
developments and challenges. International Journal of
Technology Enhanced Learning, 4(5–6), 304–317.
Ferguson, R., & Clow, D. (2017). Where is the evidence?
A call to action for learning analytics. Proceedings of
the Seventh International Learning Analytics \&
Knowledge Conference, 56–65.
Flanagan, B., & Ogata, H. (2017). 21 Integration of learning
analytics research and production systems while
protecting privacy. The 25th International Conference
on Computers in Education, Christchurch, New
Zealand, 333–338.
Gruber, M. R. (2019). Designing for Great Teaching with
Learning Design Cards. In UZH philosophy faculty -
digital teaching and research. https://bit.ly/3ceTVve
Hoel, T., & Chen, W. (2016). 20 Privacy-driven design of
Learning Analytics applications--exploring the design
space of solutions for data sharing and interoperability.
Journal of Learning Analytics, 3(1), 139–158.
Hoel, T., & Xiao, J. (2018). Towards an open architecture
for learning analytics in open and distance education.
Asia-Pacific Society for Computers in Education.
Iraj, H., Fudge, A., Faulkner, M., Pardo, A., & Kovanović,
V. (2020). Understanding students’ engagement with
personalised feedback messages. Proceedings of the
Tenth International Conference on Learning Analytics
\& Knowledge, 438–447.
Joachims, T., Freitag, D., Mitchell, T., & others. (1997).
Webwatcher: A tour guide for the world wide web.
International Joint Conference on Artificial
Intelligence, 770–777.
Kruskal, W. H., & Wallis, W. A. (1952). Use of ranks in
one-criterion variance analysis. Journal of the
American Statistical Association, 47(260), 583–621.
Kwakman, K. (2003). Factors affecting teachers’
participation in professional learning activities.
Teaching and Teacher Education, 19(2), 149–170.
Leclercq, D., & Poumay, M. (2005). The 8 learning Events
Model and its principles. University of Liège, 11.
Lewis, J. R. (2018). The system usability scale: past,
present, and future. International Journal of Human--
Computer Interaction, 34(7), 577–590.
Macfadyen, L. P., Lockyer, L., & Rienties, B. (2020).
Learning Design and Learning Analytics: Snapshot
2020. SOLAR. https://learning-analytics.info/
index.php/JLA/article/view/7389
Marangunić, N., & Granić, A. (2015). Technology
acceptance model: a literature review from 1986 to
2013. Universal Access in the Information Society,
14(1), 81–95.
McKight, P. E., & Najab, J. (2010). Kruskal-wallis test. The
Corsini Encyclopedia of Psychology, 1.
Mor, Y., Ferguson, R., & Wasson, B. (2015). Learning
design, teacher inquiry into student learning and
learning analytics: A call for action. Wiley Online
Library.
Ochoa, X., Dom\’\inguez, F., Guamán, B., Maya, R.,
Falcones, G., & Castells, J. (2018). The RAP system:
Automatic feedback of oral presentation skills using
multimodal analysis and low-cost sensors. Proceedings
of the 8th International Conference on Learning
Analytics and Knowledge, 360–364.
Ogata, H., Majumdar, R., AKÇAPINAR, G., HASNINE,
M. N., & Flanagan, B. (2018). Beyond learning
analytics: Framework for technology-enhanced
evidence-based education and learning. 26th
International Conference on Computers in Education
Workshop Proceedings, 493–496.
Park, J., Denaro, K., Rodriguez, F., Smyth, P., &
Warschauer, M. (2017). Detecting changes in student
behavior from clickstream data. Proceedings of the
Seventh International Learning Analytics \&
Knowledge Conference, 21–30.
Peres, S. C., Pham, T., & Phillips, R. (2013). Validation of
the system usability scale (SUS) SUS in the wild.
Proceedings of the Human Factors and Ergonomics
Society Annual Meeting, 57(1), 192–196.
Schneider, J., Börner, D., Van Rosmalen, P., & Specht, M.
(2016). Can you help me with my pitch? Studying a tool
for real-time automated feedback. IEEE Transactions
on Learning Technologies, 9(4), 318–327.
What Indicators Can I Serve You with? An Evaluation of a Research-Driven Learning Analytics Indicator Repository
67

Schumacher, C., & Ifenthaler, D. (2018). Features students
really expect from learning analytics. Computers in
Human Behavior, 78, 397–407.
Slade, S., Prinsloo, P., & Khalil, M. (2019). Learning
analytics at the intersections of student trust, disclosure
and benefit. Proceedings of the 9th International
Conference on Learning Analytics \& Knowledge, 235–
244.
Tsai, Y.-S., & Gasevic, D. (2017). Learning analytics in
higher education---challenges and policies: a review of
eight learning analytics policies. Proceedings of the
Seventh International Learning Analytics \&
Knowledge Conference, 233–242.
Tsai, Y.-S., Moreno-Marcos, P. M., Jivet, I., Scheffel, M.,
Tammets, K., Kollom, K., & Gašević, D. (2018). The
SHEILA framework: Informing institutional strategies
and policy processes of learning analytics. Journal of
Learning Analytics, 5(3), 5–20.
Van Goidsenhoven, S., Bogdanova, D., Deeva, G.,
Broucke, S. vanden, De Weerdt, J., & Snoeck, M.
(2020). Predicting student success in a blended learning
environment. Proceedings of the Tenth International
Conference on Learning Analytics \& Knowledge, 17–
25.
van Leeuwen, A., & Rummel, N. (2020). Comparing
Teachers’ Use of Mirroring and Advising Dashboards.
Proceedings of the Tenth International Conference on
Learning Analytics & Knowledge, 26–34.
https://doi.org/10.1145/3375462.3375471
Verpoorten, D., Poumay, M., & Leclercq, D. (2007). The
eight learning events model: A pedagogic conceptual
tool supporting diversification of learning methods.
Interactive Learning Environments, 15(2), 151–160.
CSEDU 2022 - 14th International Conference on Computer Supported Education
68
