
Electrodermal Activity Evaluation of Player Experience in Virtual
Reality Games: A Phasic Component Analysis
Diego Navarro
a
, Valeria Garro
b
and Veronica Sundstedt
c
Department of Computer Science, Blekinge Institute of Technology, Karlskrona, Sweden
Keywords:
Virtual Reality, Psychophysiology, Electrodermography, Phasic Component, Player Experience.
Abstract:
Electrodermal activity (EDA) is considered to be an effective metric for measuring changes in the arousal
level of people. In this paper, the phasic component of EDA data from players is analyzed in relation to their
reported experience from a standardized questionnaire, when interacting with a couple of virtual reality games
that featured two different input devices: the HTC Vive and Leap Motion controllers. Initial results show that
there are no significant differences in the phasic component data, despite having significant differences in their
respective player experience. Furthermore, no linear correlations are found between the phasic component
data and the evaluated experience variables, with the only exception of negative affect which features a weak
positive correlation. In conclusion, the phasic component of EDA data has here shown a limited correlation
with player experience and should be further explored in combination with other psychophysiological signals.
1 INTRODUCTION
Electrodermal activity (EDA) is considered a very
efficient methodology for measuring the changes
in arousal levels of players when playing video
games (Navarro et al., 2021). Because of this, sev-
eral publications have used EDA measurements in the
assessment of different variables in game research,
such as the emotional responses (Bontchev, 2016;
Moghimi et al., 2017) or the cognitive loads (Buch-
wald et al., 2019) of players.
A predominant area in which EDA data has been
analyzed in previous publications is the assessment
of player experience. Multiple studies have used
EDA data to quantitatively evaluate different experi-
ence variables in game research (Drachen et al., 2010;
Martey et al., 2014; Ang, 2017). However, the ma-
jority of those studies have focused on games played
on regular 2D screens. With the introduction of vir-
tual reality (VR) technologies into the consumer mar-
ket, novel interaction techniques have emerged, af-
fecting the manner in which players experience video
games. Few publications have explored the effects
that these novel interaction techniques may have in
the EDA data from players and their respective expe-
a
https://orcid.org/0000-0003-1503-8856
b
https://orcid.org/0000-0002-9527-4594
c
https://orcid.org/0000-0003-3639-9327
riences (Egan et al., 2016), offering the opportunity
to further explore the relationship that may exist be-
tween these variables.
Therefore, this study presents the following re-
search question: How may the differences in player
experience relate to the variations of their respective
EDA data in VR games?. In particular, this study fo-
cuses on analyzing the phasic component (see Sec-
tion 2) from players’ EDA data, gathered in a pre-
vious experimentation. We hypothesize that there
is a strong relationship between the EDA data from
players and their respective game experience: sig-
nificant differences in the arousal level of players
during gameplay, and consequently significant differ-
ences over the phasic component of EDA data, may be
an indicator of significant differences in the reported
player experience.
2 BACKGROUND
Electrodermal activity, also known as galvanic skin
response (GSR), is defined as the measurement of the
variations in the electrical conductivity on the skin,
due to Eccrine sweat glands activity (Boucsein, 2012;
Tasooji et al., 2019). EDA measurements focus on
applying an imperceptible amount of electric voltage
on the skin and measure the variation of the speed
in which this voltage travels trough it. When strong
108
Navarro, D., Garro, V. and Sundstedt, V.
Electrodermal Activity Evaluation of Player Experience in Virtual Reality Games: A Phasic Component Analysis.
DOI: 10.5220/0011006100003124
In Proceedings of the 17th International Joint Conference on Computer Vision, Imaging and Computer Graphics Theory and Applications (VISIGRAPP 2022) - Volume 2: HUCAPP, pages
108-116
ISBN: 978-989-758-555-5; ISSN: 2184-4321
Copyright
c
2022 by SCITEPRESS – Science and Technology Publications, Lda. All rights reserved

emotional reactions are experienced by people (i.e.
increase in their arousal levels), the body increases the
levels of perspiration on the skin and, consequently,
its electrical conductivity. Therefore, increases in the
EDA signal are often associated with increases in the
arousal level of people (Boucsein, 2012).
EDA signals have two main components called
tonic and phasic. The tonic component describes the
slow and gradual changes in the EDA signal over
time, establishing a baseline for the EDA signal called
skin conductance level (SCL). The phasic component
focuses on identifying quick and abrupt changes in
the EDA signal, commonly referred to as a skin con-
ductance response (SCR) (Boucsein, 2012; Navarro
et al., 2021).
3 RELATED WORK
Several publications have explored EDA data and
their potential relationship with multiple variables
from the player experience. An initial study by Ravaja
et al. (2006) focused on analyzing the changes of
the phasic component data during gameplay, com-
bining data from electromyography, heart rate, and
EDA; and showing a strong positive relationship be-
tween phasic increases of arousal and in-game re-
wards. A further study from Drachen et al. (2010)
aimed to generate a quantitative understanding of
player experience by analyzing its potential correla-
tion with EDA and heart rate data. A set of first-
person shooting games were used in this paper, show-
ing significant correlations between EDA data and
reported player experience, despite having limited
covariance between the physiological metrics. An-
other study using first-person shooting games was
presented by Nacke et al. (2010), exploring the ef-
fects of turning on and off the sound effects and mu-
sic on the arousal responses from players. The results
showed that changes in sonic stimuli had little effect
on players’ EDA data, despite showing significant ef-
fects over reported player experience. In (Klarkowski
et al., 2016, 2018) challenge, and the relationship
with EDA signals, were analyzed. Despite discrepan-
cies with extant literature, results from these studies
show a directly proportional relation between player
arousal and game challenge. Few articles, however,
have explored the variation of EDA data in VR games.
One such study compared the effects of VR and non-
VR environments in players’ EDA and heart rate
data (Egan et al., 2016), finding significant differences
between the gathered physiological metrics.
The analysis presented in this paper is based on
additional EDA data gathered in an earlier experi-
ment that evaluated player performance and experi-
ence when manipulating objects in two virtual reality
games (a pentomino puzzle and a ball throwing task)
with two different interaction devices: the HTC Vive
controller and the Leap Motion Controller. More de-
tails on the earlier experiment design and procedure
that is the basis for the EDA data gathering can be
found in (Navarro and Sundstedt, 2019). The per-
formance evaluation was carried out by analyzing the
amount of piece grabs require to complete the puzzle
in the pentomino game, and the number of throws re-
quired to hit all targets in the ball throwing game. Ad-
ditionally, completion times were included in this part
of the analysis. The experience evaluation was done
through a set of three questionnaires, two applied af-
ter completing the games with each respective inter-
action device, and one at the end of the experiment.
The questionnaires where a modified version of the
Game Experience Questionnaire (GEQ), a standard-
ized survey to evaluate player experience (IJsselsteijn
et al., 2013).
As an outcome of the previous work, the HTC
Vive was reported to offer an improved overall sub-
jective experience. The performance was reported to
decrease when using the Leap Motion controller and
gesturing with the hands was not perceived as reliable
as when using the HTC Vive for input control. How-
ever, the earlier work also showed potential in terms
of positive responses for both controllers, in particular
relating to enjoyment. Since there was a previous sig-
nificant difference reported in the player performance
it was considered relevant to also analyze the gathered
EDA data collected during the experiment in further
detail.
4 METHODOLOGY
A statistical evaluation between player EDA signals
and the reported experience results was established as
the main methodology for this study. Specifically, an
analysis of the phasic component of the EDA data and
its potential relationship with player experience vari-
ables.
4.1 Phasic Component Analysis
For the phasic component analysis, the metric peaks
per minute was used. Peaks per minute highlight the
ratio in which EDA signal peaks occurred within the
time required by players to complete each game. This
metric aims to compare how the different input de-
vices featured in each game might have affected the
arousal levels of players and, subsequently, their re-
Electrodermal Activity Evaluation of Player Experience in Virtual Reality Games: A Phasic Component Analysis
109

spective perceived experience results. The process
used to calculate the peaks per minute (P
min
) is shown
in Equation 1, where P represents the total number of
peaks (automatically detected by iMotions) between
the initial exposure time (t
o
in ms) and the completion
time (t
f
in ms), over the completion time divided by
6 ∗ 10
4
ms.
P
min
=
∑
t
f
t
o
P
t
f
6∗10
4
(1)
Peaks per minute were calculated for each game
(pentomino and ball throwing), and for each input de-
vice (HTC Vive controller and the Leap Motion con-
troller). A third measurement was done over the entire
exposure with each input modality, adding the peaks
from both games together.
4.2 Statistical Analysis
Several statistical analyses were carried out with the
calculated peaks per minute, and the reported player
experience results from the GEQ. First, the ANOVA
assumptions were tested for all the data sets using the
Shapiro-Wilk test for normality, and the Levene’s test
for homoscedasticity. Only the data sets that satisfied
the ANOVA assumptions were later compared using
a paired t-test, while all others were compared by us-
ing a Wilcoxon signed-rank test. Lastly, to evaluate
any potential correlation that might exist between the
calculated peaks per minute and the variables tested
in the GEQ, a Pearson correlation coefficient was cal-
culated with the data from the pentomino game, the
ball throwing game, and the overall experience.
4.3 Software Tools
To capture the participants’ EDA data, the iMotions
platform (iMotions, 2021) and the Shimmer3 GSR+
sensor were used. IMotions recorded and processed
the raw data captured by the GSR sensor, allowing us
to directly export the phasic component data. These
phasic data were later imported, processed, and ana-
lyzed using a script developed in Python (version 3.8).
The script used three main libraries to carry out the
analyses: Pandas (Pandas, 2021) was used to read,
store, and manipulate data frames; ScyPy (Virtanen
et al., 2020) was used to carry out the statistical sig-
nificance analyses; and Matplotlib (Matplotlib, 2021)
was used to plot the calculated data.
4.4 Ethical Considerations
The EDA data can be considered a sensitive metric
since it allows to identify when and how much the
arousal levels of a person change, when exposed to
a specific stimulus. Therefore, this study made the
identity of the players confidential, and made no di-
rect links between the participants and the gathered
EDA data. The study was submitted to a regional
ethics board in Sweden for its evaluation, and was
granted ethical approval (dnr: 2018/624).
5 RESULTS
A total of 20 participants volunteered for the experi-
ment. However, only data from 18 of them were ana-
lyzed and reported in this study. The EDA data from
participants 15 and 20 were affected by noise at the
end of the exposure with the Leap Motion controller,
which generated incomplete data sets when exported
from iMotions. Therefore, data from these partici-
pants were excluded from the analysis.
5.1 Peaks per Minute
For each game, two different peaks per minute data
sets were calculated, one for each input device.
Moreover, we computed also two additional peaks
per minute data sets for the entire stimuli exposure,
adding together the peaks per minute from the pen-
tomino and the ball throwing games for each interac-
tion device. An overview of the distribution of the
calculated peaks per minute is shown in Figure 1.
5.1.1 Pentomino Game
Both peaks per minute data sets for the pentomino
games passed the normality and homoscedasticity
tests, allowing the use of the paired sample t-test to
compare the data. Results from the test showed that
there was not a statistically significant difference in
the peaks per minute from players when playing the
pentomino game:
t − test
(1,n=18)
= 0.89, p > 0.05
5.1.2 Ball Throwing Game
The peaks per minute data set for the Leap Mo-
tion passed the normality test, while the one for the
HTC Vive controller failed it. Therefore, a Wilcoxon
signed-rank test was used to compare these data sets,
showing that there was not a statistically significant
difference in the peaks per minute from players when
playing the ball game:
W SR
(1,n=18)
= 48, p > 0.05
HUCAPP 2022 - 6th International Conference on Human Computer Interaction Theory and Applications
110
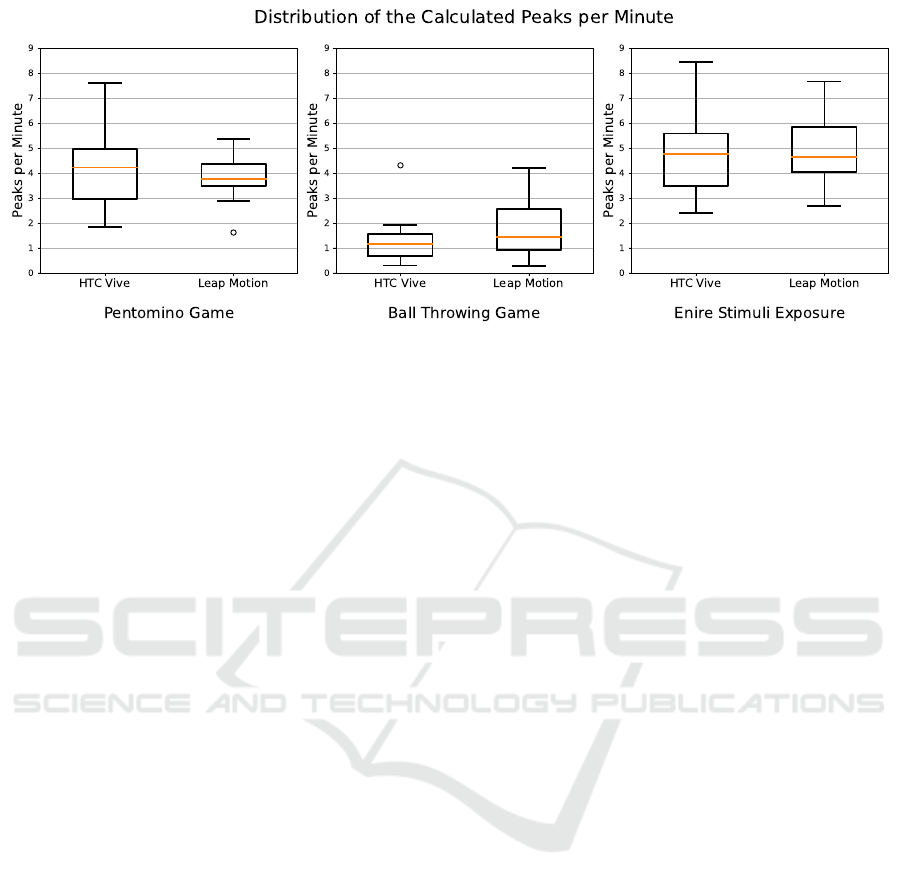
Figure 1: Calculated peaks per minute for the pentomino game, ball throwing game, and the entire stimuli exposure, between
the HTC Vive controller and the Leap Motion controller.
5.1.3 Entire Stimuli Exposure
The entire stimuli exposure data sets added the peaks
per minute from both games that used the same in-
put device. Both data sets that were calculated this
way passed the normality and homoscedasticity tests
and were compared using a t-test. Results from the
test showed that there was not a statistically signifi-
cant difference in the players’ peaks per minute when
using the HTC Vive and the Leap Motion:
t − test
(1,n=18)
= 0.10, p > 0.05
5.2 GEQ Results
Six different data sets (one per input device) were
created from the answers gathered in the GEQ: two
for the pentomino game experience, two for the ball
throwing game experience, and two for the overall ex-
perience reported by players.
In the GEQ, two different sets of variables were
used to evaluate player experience. The first set was
used to evaluate the experience when playing each of
the games, exploring the perceived competence, level
of challenge, tension, positive affect, and negative af-
fect from players. The second set explored the over-
all experience of using each input device in terms of
the perceived enjoyment, ease of use, sense of control,
and preference from players[CITE].
5.2.1 Pentomino Game
All experience variables failed the normality test
for the pentomino game. Therefore, the Wilcoxon
signed-rank test was used to evaluate the perceived
player experience. An overview of the distributions
from the results obtained in the GEQ for the pen-
tomino game is shown in Figure 2 . These results
from the test showed that there was a statistically sig-
nificant difference among all evaluated variables, with
the exception of the perceived negative affect:
• Competence: W SR
(1,n=18)
= 1, p < 0.05
• Level of challenge: W SR
(1,n=18)
= 3.5, p < 0.05
• Tension: W SR
(1,n=18)
= 8, p < 0.05
• Positive affect: W SR
(1,n=18)
= 10.5, p < 0.05
• Negative affect: W SR
(1,n=18)
= 8, p > 0.05
5.2.2 Ball Throwing Game
All experience variables failed the normality test for
the ball throwing game. The only exception occurred
with the perceived competence, which also passed the
homoscedasticity test. Given this, a t-test was used
to evaluate the perceived competence, while all other
variables were evaluated with the Wilcoxon signed-
rank test. An overview of the distributions from the
results obtained in the GEQ for the ball throwing
game is shown in Figure 3. Results from these tests
showed that there was a statistically significant differ-
ence between all evaluated experience variables:
• Competence: t −test
(1,n=18)
= 3.05, p < 0.05
• Level of challenge: W SR
(1,n=18)
= 9, p < 0.05
• Tension: W SR
(1,n=18)
= 20.5, p < 0.05
• Positive affect: W SR
(1,n=18)
= 12, p < 0.05
• Negative affect: W SR
(1,n=18)
= 11, p < 0.05
5.2.3 Overall Experience
An overview of the distributions from the results ob-
tained in the GEQ for the overall experience is shown
in Figure 4. The variables used to assess the overall
Electrodermal Activity Evaluation of Player Experience in Virtual Reality Games: A Phasic Component Analysis
111
Figure 2: Results of each variable evaluated with the GEQ
in the pentomino game, for the HTC Vive controller and the
Leap Motion controller.
Figure 3: Results of each variable evaluated with the GEQ
in the ball game, for the HTC Vive controller and the Leap
Motion controller.
HUCAPP 2022 - 6th International Conference on Human Computer Interaction Theory and Applications
112
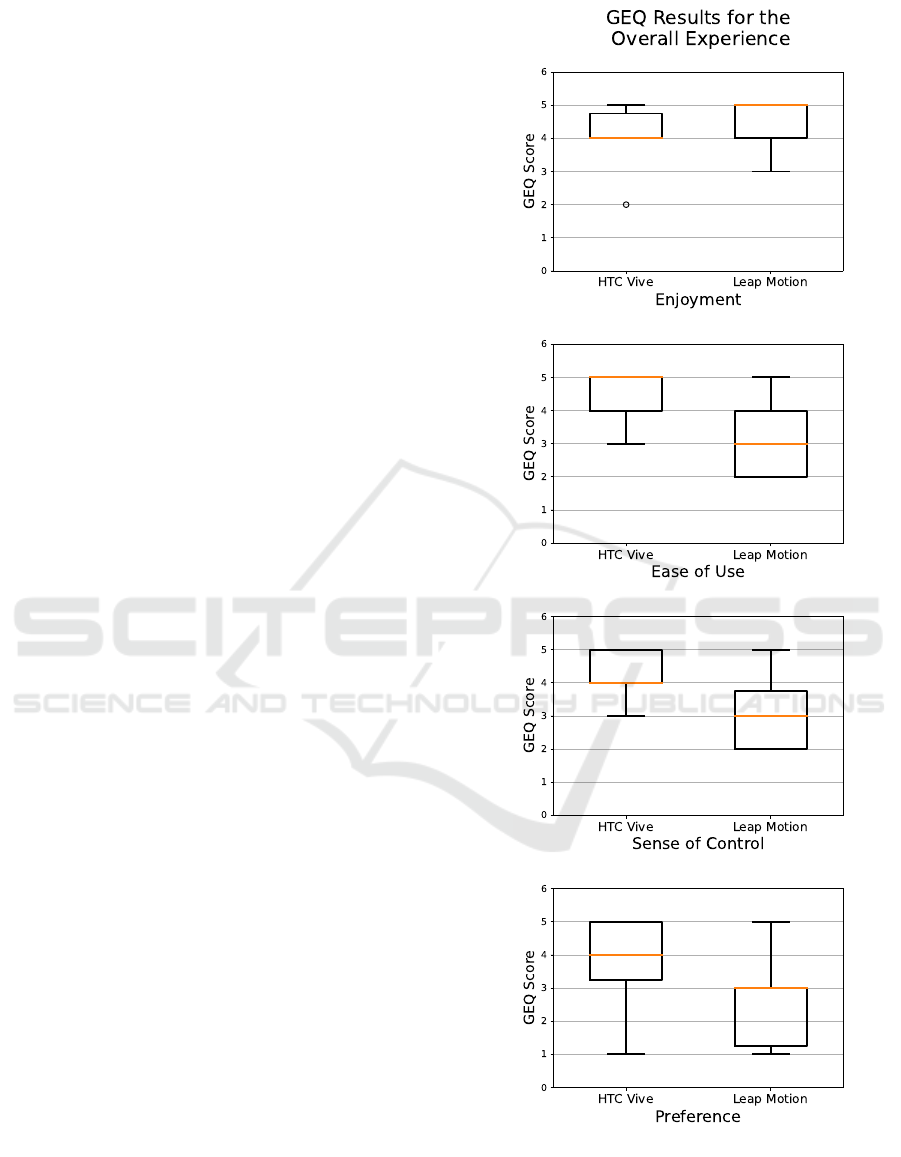
experience failed the normality test, and were evalu-
ated using the Wilcoxon signed-rank test. The results
of these tests showed that all variables had a statisti-
cal significant difference, with the exception of enjoy-
ment:
• Enjoyment: W SR
(1,n=18)
= 9, p > 0.05
• Ease of use: W SR
(1,n=18)
= 3.5, p < 0.05
• Sense of control: W SR
(1,n=18)
= 4, p < 0.05
• Preference: W SR
(1,n=18)
= 18.5, p < 0.05
5.3 Correlation Analysis
The correlation analysis evaluated the potential linear
correlation between the peaks per minute and GEQ
Scores. Results from this analysis were classified into
five different categories, based on the results obtained
in the Pearson coefficient (ρ) (Shevlyakov and Oja,
2016):
• A strong positive correlation when ρ was greater
than 0.8.
• A weak positive correlation when ρ was greater
than 0.4 but lesser than 0.8.
• No correlation when ρ was between the values of
0.4 and -0.4.
• A weak negative correlation when ρ was lesser
than -0.4 but greater than -0.8.
• A strong negative correlation when ρ was lesser
than -0.8.
Lastly, this analysis should be understood as ex-
ploratory and no correction for multiple comparisons
was performed on it.
5.3.1 Pentomino Game
For the HTC Vive controller, only the negative affect
showed a weak positive correlation with the peaks per
minute. All other GEQ variables showed no correla-
tion:
• Competence: ρ
(1,n=18)
= 0.017, p > 0.05
• Challenge: ρ
(1,n=18)
= −0.039, p > 0.05
• Tension: ρ
(1,n=18)
= 0.048, p > 0.05
• Positive affect: ρ
(1,n=18)
= −0.26, p > 0.05
• Negative affect: ρ
(1,n=18)
= 0.516, p < 0.05
For the Leap Motion controller, all GEQ variables
showed no correlation with the peaks per minute:
• Competence: ρ
(1,n=18)
= −0.057, p > 0.05
• Challenge: ρ
(1,n=18)
= −0.202, p > 0.05
• Tension: ρ
(1,n=18)
= −0.280, p > 0.05
• Positive affect: ρ
(1,n=18)
= −0.278, p > 0.05
• Negative affect: ρ
(1,n=18)
= −0.104, p > 0.05
Figure 4: Box plots from the results of each evaluated vari-
able with the GEQ for the overall player experience with
each input device.
5.3.2 Ball Throwing Game
For the HTC Vive controller, the variables of chal-
lenge, tension, and negative affect showed a weak
Electrodermal Activity Evaluation of Player Experience in Virtual Reality Games: A Phasic Component Analysis
113

positive correlation with the peaks per minute. All
other GEQ variables showed no correlation:
• Competence: ρ
(1,n=18)
= −0.259, p > 0.05
• Challenge: ρ
(1,n=18)
= 0.487, p < 0.05
• Tension: ρ
(1,n=18)
= 0.568, p < 0.05
• Positive affect: ρ
(1,n=18)
= 0.063, p > 0.05
• Negative affect: ρ
(1,n=18)
= 0.683, p < 0.05
In the case of the Leap motion controller, all
GEQ variables show no correlation with the peaks per
minute:
• Competence: ρ
(1,n=18)
= −0.329, p > 0.05
• Challenge: ρ
(1,n=18)
= 0.346, p > 0.05
• Tension: ρ
(1,n=18)
= −0.125, p > 0.05
• Positive affect: ρ
(1,n=18)
= −0.233, p > 0.05
• Negative affect: ρ
(1,n=18)
= 0.230, p > 0.05
5.3.3 Overall Experience
For both, the HTC Vive controller and the Leap Mo-
tion controller, all GEQ variables evaluated in the
overall experience showed no correlation with the cal-
culated peaks per minute for the entire stimuli expo-
sure. The results for the HTC Vive were:
• Enjoyment: ρ
(1,n=18)
= −0.094, p > 0.05
• Ease of use: ρ
(1,n=18)
= −0.127, p > 0.05
• Sense of control: ρ
(1,n=18)
= −0.001, p > 0.05
• Preference: ρ
(1,n=18)
= −0.154, p > 0.05
Similarly, the results obtained for the Leap Motion
controller were:
• Enjoyment: ρ
(1,n=18)
= −0.203, p > 0.05
• Ease of use: ρ
(1,n=18)
= −0.137, p > 0.05
• Sense of control: ρ
(1,n=18)
= −0.073, p > 0.05
• Preference: ρ
(1,n=18)
= −0.228, p > 0.05
6 DISCUSSION
The results from this study showed that there were
no significant statistical differences in the peaks per
minute within the players in the evaluated games.
However, the reported player experience did show
a significant statistical difference in the majority of
variables evaluated with the GEQ. In addition to this,
no strong correlation between the peaks per minute
and the evaluated experience variables was found in
the analysis.
These results show an initial discrepancy with our
proposed hypothesis. Nevertheless, this is not enough
evidence to propose its rejection with certainty. This
study should be interpreted as a work in progress and
reports only on the initial results from the phasic com-
ponent analysis. Previous publications that showed a
correlation between player experience and EDA data
focused on analyzing the tonic component (Drachen
et al., 2010), suggesting that variations in the skin
conductance level may display a stronger relationship
with the differences in the player experience, than the
variations of the peaks per minute.
Despite this, the results obtained in the phasic
component analysis showed an interesting consis-
tency with previous publications that proposed alike
methodologies, showing that positive correlations
have only been found between EDA data and negative
affects of player experience (Drachen et al., 2010).
Furthermore, the peaks per minute seemed to be af-
fected by the different game genres. An initial evalu-
ation of the peaks per minute showed statistically sig-
nificant differences between the pentomino and ball
throwing games for both, the HTC Vive controller
(W SR
(1,n=18)
= 0.0, p < 0.05) and the Leap Motion
controller (t − test
(1,n=18)
= 9.41, p < 0.05). Analyz-
ing the changes that different game genres may gen-
erate in players’ phasic component data is beyond the
scope established for this paper, but the results ob-
tained for the peaks per minute suggest that this could
be a potential relationship to further explore.
It has been suggested that the correlation between
experience variables and EDA data can be limited,
since the game genres and experimental approach can
affect the measurements (Martey et al., 2014; Egan
et al., 2016). Therefore, the use of multiple method-
ologies for relating player experience with EDA data
is recommended (Navarro et al., 2021).
7 CONCLUSION AND FUTURE
WORK
This article has presented an initial analysis of the
phasic component of EDA data gathered from play-
ers and evaluated its potential relationship with their
respective player experience. Initial results show that
there were no statistically significant differences in
the calculated peaks per minute within players, while
having statistically significant differences in their re-
spective experience; suggesting that phasic compo-
nent data captured during gameplay does not vary sig-
nificantly in terms of the player experience. However,
a weak positive linear correlation was evidenced be-
tween the peaks per minute and the negative affect of
HUCAPP 2022 - 6th International Conference on Human Computer Interaction Theory and Applications
114

players, which is consistent with the results disclosed
in other publications.
Future work should focus on continuing this eval-
uation, expanding over the analysis of the tonic com-
ponent of EDA data. In addition to this, other evalu-
ation metrics, such as heart rates, should also be con-
sidered when analyzing the potential relationships be-
tween player physiology and player experience, due
to the limited correlation that may exist with EDA
data alone.
ACKNOWLEDGEMENTS
This work has been financed partly by KK-stiftelsen
Sweden, through the ViaTecH Synergy Project (con-
tract 20170056).
REFERENCES
Ang, D. (2017). Difficulty in Video Games: Understand-
ing the Effects of Dynamic Difficulty Adjustment in
Video Games on Player Experience. In Proceedings
of the 2017 ACM SIGCHI Conference on Creativity
and Cognition - C&C ’17, pages 544–550, Singapore,
Singapore. ACM Press.
Bontchev, B. (2016). Adaptation in Affective Video Games:
A Literature Review. Cybernetics and Information
Technologies, 16(3).
Boucsein, W. (2012). Electrodermal Activity. Springer US,
Boston, MA.
Buchwald, M., Kupinski, S., Bykowski, A., Marcinkowska,
J., Ratajczyk, D., and Jukiewicz, M. (2019). Elec-
trodermal activity as a measure of cognitive load: a
methodological approach. In 2019 Signal Processing:
Algorithms, Architectures, Arrangements, and Appli-
cations (SPA), pages 175–179, Poznan, Poland. IEEE.
Drachen, A., Nacke, L. E., Yannakakis, G., and Pedersen,
A. L. (2010). Correlation between heart rate, electro-
dermal activity and player experience in first-person
shooter games. In Proceedings of the 5th ACM SIG-
GRAPH Symposium on Video Games - Sandbox ’10,
pages 49–54, Los Angeles, California. ACM Press.
Egan, D., Brennan, S., Barrett, J., Qiao, Y., Timmerer, C.,
and Murray, N. (2016). An evaluation of Heart Rate
and ElectroDermal Activity as an objective QoE eval-
uation method for immersive virtual reality environ-
ments. In 2016 Eighth International Conference on
Quality of Multimedia Experience (QoMEX), pages
1–6, Lisbon, Portugal. IEEE.
IJsselsteijn, W., de Kort, Y., and Poels, K. (2013). The
Game Experience Questionnaire. Technische Univer-
siteit Eindhoven.
iMotions (2021). iMotions Research Software. https:
//imotions.com/platform/. Accessed: 2021-11-23.
Klarkowski, M., Johnson, D., Wyeth, P., Phillips, C., and
Smith, S. (2016). Psychophysiology of Challenge
in Play: EDA and Self-Reported Arousal. In Pro-
ceedings of the 2016 CHI Conference Extended Ab-
stracts on Human Factors in Computing Systems,
pages 1930–1936, San Jose California USA. ACM.
Klarkowski, M., Johnson, D., Wyeth, P., Phillips, C., and
Smith, S. (2018). Don’t Sweat the Small Stuff: The
Effect of Challenge-Skill Manipulation on Electro-
dermal Activity. In Proceedings of the 2018 Annual
Symposium on Computer-Human Interaction in Play,
pages 231–242, Melbourne VIC Australia. ACM.
Martey, R. M., Kenski, K., Folkestad, J., Feldman, L.,
Gordis, E., Shaw, A., Stromer-Galley, J., Clegg, B.,
Zhang, H., Kaufman, N., Rabkin, A. N., Shaikh, S.,
and Strzalkowski, T. (2014). Measuring Game En-
gagement: Multiple Methods and Construct Complex-
ity. Simulation & Gaming, 45(4-5):528–547.
Matplotlib (2021). Matplotlib - Visualization with Python.
https://matplotlib.org/. Accessed: 2021-11-23.
Moghimi, M., Stone, R., and Rotshtein, P. (2017). Affective
Recognition in Dynamic and Interactive Virtual Envi-
ronments. IEEE Transactions on Affective Computing,
pages 1–1.
Nacke, L. E., Grimshaw, M. N., and Lindley, C. A. (2010).
More than a feeling: Measurement of sonic user expe-
rience and psychophysiology in a first-person shooter
game. Interacting with Computers, 22(5):336–343.
Navarro, D. and Sundstedt, V. (2019). Evaluating player
performance and experience in virtual reality game in-
teractions using the htc vive controller and leap mo-
tion sensor. In Proceedings of the 14th International
Joint Conference on Computer Vision, Imaging and
Computer Graphics Theory and Applications - HU-
CAPP,, pages 103–110. INSTICC, SciTePress.
Navarro, D., Sundstedt, V., and Garro, V. (2021). Biofeed-
back Methods in Entertainment Video Games: A Re-
view of Physiological Interaction Techniques. Pro-
ceedings of the ACM on Human-Computer Interac-
tion, 5(CHI PLAY):1–32.
Pandas (2021). Pandas - Python Data Analysis Library.
https://pandas.pydata.org/about/. Accessed: 2021-11-
23.
Ravaja, N., Saari, T., Salminen, M., Laarni, J., and Kalli-
nen, K. (2006). Phasic Emotional Reactions to Video
Game Events: A Psychophysiological Investigation.
Media Psychology, 8(4):343–367.
Shevlyakov, G. L. and Oja, H. (2016). Robust correlation:
theory and applications. Wiley series in probability
and statistics. Wiley, Chichester, West Sussex.
Tasooji, R., Buckingham, N., Gra
ˇ
canin, D., and Knapp,
R. B. (2019). An Approach to Analysis of Physio-
logical Responses to Stimulus: From Electrodermal
Activity to Combined Physiological Responses. In
Marcus, A. and Wang, W., editors, Design, User Ex-
perience, and Usability. Design Philosophy and The-
ory, volume 11583, pages 492–509. Springer Interna-
tional Publishing, Cham. Series Title: Lecture Notes
in Computer Science.
Virtanen, P., Gommers, R., Oliphant, T. E., Haberland, M.,
Reddy, T., Cournapeau, D., Burovski, E., Peterson, P.,
Electrodermal Activity Evaluation of Player Experience in Virtual Reality Games: A Phasic Component Analysis
115

Weckesser, W., Bright, J., van der Walt, S. J., Brett,
M., Wilson, J., Millman, K. J., Mayorov, N., Nel-
son, A. R. J., Jones, E., Kern, R., Larson, E., Carey,
C. J., Polat,
˙
I., Feng, Y., Moore, E. W., VanderPlas,
J., Laxalde, D., Perktold, J., Cimrman, R., Henriksen,
I., Quintero, E. A., Harris, C. R., Archibald, A. M.,
Ribeiro, A. H., Pedregosa, F., van Mulbregt, P., and
SciPy 1.0 Contributors (2020). SciPy 1.0: Fundamen-
tal Algorithms for Scientific Computing in Python.
Nature Methods, 17:261–272.
HUCAPP 2022 - 6th International Conference on Human Computer Interaction Theory and Applications
116
