
Effects of Cognitive-driven Development in the Early Stages of the
Software Development Life Cycle
Victor Hugo Santiago C. Pinto
1,2 a
and Alberto Luiz Oliveira Tavares De Souza
2
1
Federal University of Par
´
a (UFPA) - Bel
´
em, PA, Brazil
2
Zup Innovation - S
˜
ao Paulo, SP, Brazil
Keywords:
Cognitive-driven Development, Cognitive Complexity Metrics, Experimental Study.
Abstract:
The main goal of software design is to continue slicing the code to fit the human mind. A likely reason for that
is related to the fact that human work can be improved by a focus on a limited set of data. However, even with
advanced practices to support software quality, complex codes continue to be produced, resulting in cognitive
overload for the developers. Cognitive-Driven Development (CDD) is an inspiration from cognitive psychol-
ogy that aims to support the developers in defining a cognitive complexity constraint for the source code. The
main idea behind the CDD is keeping the implementation units under this constraint, even with the continuous
expansion of software scale. This paper presents an experimental study for verifying the CDD effects in the
early stages of development compared to conventional practices. Projects adopted for hiring developers in
Java by important Brazilian software companies were chosen. 44 experienced software engineers from the
same company attended this experiment and the CDD guided part of them. The projects were evaluated with
the following metrics: CBO (Coupling between objects), WMC (Weight Method Class), RFC (Response for a
Class), LCOM (Lack of Cohesion of Methods) and LOC (Lines of Code). The result suggests that CDD can
guide the developers to achieve better quality levels for the software with lower dispersion for the values of
such metrics.
1 INTRODUCTION
Separation of Concerns is one of the key principles of
software engineering (Liskov and Zilles, 1974; Par-
nas, 1972) that a software engineer can apply in all
software life-cycle. During analysis developers must
subdivide the problem and adopt an architectural pat-
tern in order to achieve proper modularity and cohe-
sion.
Software complexity increases as new features
are incorporated (Yi and Fang, 2020; Zuse, 2019;
Fraser et al., 2007) impacting its maintainability,
one of the most rewardful software quality attributes
(ISO:ISO/IEC 25010, 2011). Therefore, the separa-
tion of component responsibility must consider not
only the domain but also the cognitive complexity
of software as it goes through an evolution (Wang,
2006).
Over the years, researchers continue to seek bet-
ter and novel methods for handling complexity (Zuse,
2019; Clarke et al., 2016; Weyuker, 1988; Shepperd,
1988). Approaches have been adopted to support
a
https://orcid.org/0000-0001-8562-6384
code design based on architectural styles and code
quality metrics. Nevertheless, there is a lack of prac-
tical and clear strategies for changing the way that we
develop software with regard to maintenance efforts
efficiently.
Most research involving human cognition in soft-
ware engineering focuses on evaluating programs and
learning rather than on understanding how software
development could be guided by this factor (Duran
et al., 2018). Cognitive complexity departs from the
standard practice of using strictly numeric values to
assess software maintainability. It starts with the
precedents set by cyclomatic complexity (CYC) (Mc-
Cabe, 1976), but uses human judgment to determine
how the code’s structures should be interpreted. Shao
and Wang proposed a set of object-oriented cogni-
tive complexity metrics (Shao and Wang, 2003) and
Misra et al. (Misra et al., 2018) suggested a relation-
ship among basic control structures and correspond-
ing weights. Although cognitive complexity mea-
surements can help assessing the understandability of
source code, studies exploring how this strategy can
be used to reduce complexity in all stages of the de-
40
Pinto, V. and Tavares De Souza, A.
Effects of Cognitive-driven Development in the Early Stages of the Software Development Life Cycle.
DOI: 10.5220/0011009000003179
In Proceedings of the 24th International Conference on Enterprise Information Systems (ICEIS 2022) - Volume 2, pages 40-51
ISBN: 978-989-758-569-2; ISSN: 2184-4992
Copyright
c
2022 by SCITEPRESS – Science and Technology Publications, Lda. All rights reserved

velopment process are lacking.
In the cognitive psychology area, cognitive load
refers to the amount of information that working
memory resources can hold at one time. Cognitive
Load Theory (CLT) (Sweller, 2010; Chandler and
Sweller, 1991; Sweller, 1988) is generally discussed
in relation to learning. Problems that require many
items to be stored in short-term memory may con-
tribute to an excessive cognitive load. According to
Sweller (Sweller, 2010), some material is intrinsi-
cally difficult to understand and this is related to the
number of elements that must be simultaneously pro-
cessed in the working memory. Experimental stud-
ies performed by Miller (Miller, 1956) have suggested
that humans are generally able to hold only seven plus
or minus two units of information in short-term mem-
ory. Such limit for information units can be applied
for software once the source code has an intrinsic
complexity.
The developers are frequently affected by cogni-
tive overload when they need to add a feature, fixing
a bug, improve the design or optimize resource us-
age. Based on CLT and Miller’s works involving cog-
nitive complexity the principles for a method called
Cognitive-Driven Development (CDD) were formu-
lated (Souza and Pinto, 2020). The main idea of
our proposed method is to try to standardize the way
developers with different specialization degrees con-
sider the complexity of the code. However, each de-
veloper can assume different intrinsically complex el-
ements in the code. We suggest that such elements
can be defined in common agreement between the
members of the development team, considering ba-
sic control structures, code branches, project’s nature
and etc (Souza and Pinto, 2020). From these defini-
tions, it is possible setting a feasible constraint for the
cognitive software complexity.
This paper presents an experimental study for ver-
ifying the CDD effects in the early stages of develop-
ment compared to development without a complexity
constraint. This involved carrying out a static code
analysis through object-oriented metrics. For this,
we selected three real projects that Brazilian software
companies adopt for hiring Java developers. 44 expe-
rienced software engineers from the same company
attended this experiment, part of them were guided
a complexity constraint, as suggested by the CDD.
The resulting projects were evaluated with the fol-
lowing metrics: CBO (Coupling between objects),
WMC (Weight Method Class), RFC (Response for a
Class), LCOM (Lack of Cohesion of Methods) and
LOC (Lines of Code). The result suggests that CDD
can be useful in the early stages of software develop-
ment and its principles can help developers to keep
the software with lower dispersion for the values of
such metrics.
2 COGNITIVE-DRIVEN
DEVELOPMENT
Cognitive load represents the limit of what the work-
ing memory can process (Sweller, 2010). When you
experience too much cognitive load, you cannot prop-
erly process code. A considerable part of the software
development effort is focused on understanding code
from other team members to apply changes later, add
new features and fix faults. Human ability does not
follow the same proportion of the continuous expan-
sion of the software size, which makes this scenario
even more challenging.
Suppose that we have a single feature to be devel-
oped and a team with distinct specialization levels. It
is likely that different solutions will be delivered by
each programmer. This would not be a problem if
the intrinsic complexity degree for the source codes
were not different. Regardless of the solution, how
can we make all solutions remain at the same level
of complexity? Usually, classes are simple and over
time they become complex. How to standardize the
people’s perspective for the same code regarding the
understanding? Each developer may have a different
way of accounting for the elements that make it diffi-
cult to understand in the code. We assume that if the
code can be understood, it can be evolved more eas-
ily. In this way, our attempt was to define a measure
for the understanding degree based on the presence
of basic control structures on the code. With this in
mind, we were able to derive a complexity constraint
and evolve the code keeping this rule.
These observations were fundamental for the in-
vestigations in cognitive psychology, specifically in
CLT and in an important work known as “Magical
Number 7” to propose a method for software devel-
opment focusing on understanding called Cognitive-
Driven Development (CDD). The main CDD princi-
ple is considering a reasonable limit for intrinsic com-
plexity points (ICP) (Souza and Pinto, 2020) for re-
ducing the cognitive load.
A satisfactory complexity constraint can be de-
fined in discussions in the early stages of development
and calibrated later, considering the project’s nature
and level of team expertise. Although our proposal
is that the definition of this constraint includes code
branches (if-else, loops, when, switch/case, do-while,
try-catch-finally and etc.), functions as an argument,
conditionals, contextual coupling - coupling with spe-
cific project classes and inheritance of abstract or
Effects of Cognitive-driven Development in the Early Stages of the Software Development Life Cycle
41

concrete class (extends), developers can include other
elements as ICPs, such as SQL instructions and anno-
tations. As a suggestion, specific features of program-
ming languages and frameworks/libraries are not con-
sidered as ICPs, it is understood that such features are
part of common knowledge and under the domain of
the developers.
Figure 1 presents a piece of code from a Java class
called GenerateHistoryController. This class was im-
plemented for a project
1
called “complexity-tracker”
which tries to provide indications of how complexity
increases during the software evolution process. To
clarify how ICPs are accounted, at the top of the fig-
ure is shown the number 6 corresponding to the total
of ICPs: 4 points are related to contextual coupling
(lines 17, 22, 26 and 37) and the remaining points re-
fer to passing a function as an argument (lines 29 and
42).
3 RELATED WORK
A taxonomy of cognitive load in software engineer-
ing was provided by Gonc¸ales et al. (Gonc¸ales et al.,
2019). Based on this classification, recent advances
are related to programming tasks and machine learn-
ing techniques to identify the programmer’s difficulty
level and code-level comprehensibility. CDD can be
applied as a complementary design to mitigate the in-
crease in cognitive complexity regardless of the soft-
ware size.
Duran et al. (Duran et al., 2018) proposed a frame-
work for the Cognitive Complexity of Computer Pro-
grams (CCCP) that describes programs in terms of
the demands they place on human cognition. CCCP
is based on a model that recognizes factors when we
are mentally manipulating a program. The contribu-
tion made by this work is to concentrate on the cog-
nitive complexity present in program designs rather
than on how the developers could be guided to gen-
erate source code reducing the cognitive load, as sug-
gested by CDD.
Object-oriented cognitive complexity metrics
were proposed in the work of Shao and Wang in (Shao
and Wang, 2003) and extended by Misra et al. (Misra
et al., 2018). Theoretical and empirical validation
was carried out to evaluate the proposed metrics based
on Weyuker’s properties (Weyuker, 1988). The main
CDD principle is not the proposition of new metrics
but to provide an easy way to define a feasible com-
plexity constraint for the creation (and evolution) of
implementation units prioritizing the understanding.
1
https://github.com/asouza/complexity-tracker
The development team can use any quality metric or,
if they prefer, basic control structures in the code to
support their classification. With this in mind, the di-
rective suggested by CDD is to keep the complexity
for implementation units under a feasible constraint
to promote their readability, even with software com-
plexity expansion.
4 EXPERIMENTAL
METHODOLOGY
The goal of this paper is to verify the effects of em-
ploying the CDD in the early stages of develop-
ment in comparison to the conventional practices.
For this, an experimental study was carried out in
the industry context involving two groups of expe-
rienced developers who developed different projects
from the same company. The first group focused on
using CDD, i.e., coding without exceeding a cogni-
tive complexity constraint, and the second was free to
use conventional development practices. Both groups
attended training about quality metrics and their im-
portance for evaluating the code during development.
Resultant implementation units in this study were
compared through object-oriented metrics to iden-
tify the differences among the samples individually.
A complementary analysis was also carried out tak-
ing into account the distribution of complexity in the
projects. Such investigation could promote discus-
sions about the benefits of slicing the software to ad-
just it better in our human mind, reducing the cog-
nitive load and improving quality metrics. To this
end, we framed our research around the following Re-
search Questions (RQs):
RQ1: Is there a difference between the projects
developed under a cognitive complexity constraint in
comparison to those generated using conventional
practices in terms of quality metrics? In practice,
a previous study (Pinto. et al., 2021) was carried
out considering refactoring scenarios using known
projects by the Java developer community. As a
result, refactorings guided by cognitive complexity
constraints were better evaluated in quality metrics.
These results led us to question whether the same ef-
fect would be noticed in the early development stages
since there are usually not so many changes at the be-
ginning of a software project. To answer this ques-
tion, all the units created by the subjects were evalu-
ated using the same metrics
RQ2: Do the implementation units from the
projects developed with the CDD have a distribu-
tion closer to the quality metrics than in projects that
followed the non-CDD methods? In addition to the
ICEIS 2022 - 24th International Conference on Enterprise Information Systems
42

12 @Controller
13 public class GenerateHistoryController {
14
15 // Contextual Coupling
16 @Autowired
17 private GenerateComplexyHistory generateComplexyHistory;
18
19 @PostMapping(value = "/generate-history")
20
// Contextual Coupling
21 @ResponseBody
22 public ResponseEntity<?> generate(@Valid GenerateHistoryRequest request,
23 UriComponentsBuilder uriComponent) {
24
25 // Contextual Coupling
26 InMemoryComplexityHistoryWriter inMemoryWriter = new InMemoryComplexityHistoryWriter();
27
28 // Function as an argument
29 new RepoDriller().start(() -> {
30 request.toMining(inMemoryWriter).mine();
31 });
32 }
33
34 @PostMapping(value = "/generate-history-class")
35 // Contextual Coupling
36 @ResponseBody
37 public ResponseEntity<?> generatePerClass(@Valid GenerateHistoryPerClassRequest request,
38 UriComponentsBuilder uriComponent) {
39
40 InMemoryComplexityHistoryWriter inMemoryWriter = new InMemoryComplexityHistoryWriter();
41 // Function as an argument
42 new RepoDriller().start(() -> {
43 request.toMining(inMemoryWriter).mine();
44 });
45
46 generateComplexyHistory.execute(request,inMemoryWriter.getHistory());
47
48 URI complexityHistoryGroupedReportUri = uriComponent.path(
49 "/reports/pages/complexity-by-class?projectId={projectId}")
50 .buildAndExpand(request.getProjectId()).toUri();
51 return ResponseEntity.created(complexityHistoryGroupedReportUri)
52 .build();
53
}
...
54
}
1
1
1
1
1
1
6
Figure 1: Class GenerateHistoryController.
analysis of the implementation units in an individual
way, we believe that a high-level view for all projects
can support the discussions about the effects produced
when using a complexity constraint in favor of the de-
velopment. The distribution degree for metrics values
could indicate how much complexity has been sliced
among the implementation units. With this in mind,
we would like to identify the effects of adopting a
complexity limit in code quality and if this element
had some influence on the developers in the separa-
tion of concerns and complexity distribution.
4.1 Project Selection
Three real projects used for the technical evaluation
and hiring of software engineers by important Brazil-
ian software companies were chosen: (i) Lend of liter-
ary works (Virtual Library), (ii) Real Estate Financing
and (iii) Payment Service Provider. This choice was
motivated by the need to use real projects, the chal-
lenges of which could prove the difficulty in dealing
with complexity even in the early stages of software
development. It should be noticed that such projects
do not require knowledge about frameworks, specific
libraries, and APIs, the developers only need to con-
centrate on using Java language. When starting the
experiment, the subjects received one of the projects
with the required classes to develop a complete flow,
i.e., a minimal project and its corresponding require-
ments document.
Book lend and returns flow should be imple-
mented for Virtual library. In general, users request
a loan for a certain number of days and a particular
type of book. There are copies with unrestricted or
restricted circulation and two types of users: standard
and research users. The first user profile can only ac-
cess exemplars of free circulation, while the second
can request access to any copies. A complete flow for
Virtual Library starts from book loans until its returns.
More detailed specifications and constraints were pro-
vided to the developers.
The requirements document for Real Estate Fi-
nancing describes that several messaging systems are
employed to integrate different microservices. A list
of events containing data on loan proposals, real es-
tate guarantees and proponents was provided to the
subjects. Based on the validation rules, developers
need to return valid proposals after processing all
events. Note that a proposal is a template that contains
the loan information, including multiple proponents,
Effects of Cognitive-driven Development in the Early Stages of the Software Development Life Cycle
43

who are the people involved in the loan agreement.
The main idea of the Payment Service Provider
is that transactions related to purchases of products
from shopkeepers are received and then they can
make their withdrawals on top of the available balance
(receivables). The project provided contains pieces of
code responsible for sending the necessary data to im-
plement a complete flow of generation of receivables.
There were also test scripts to verify the resulting
code covering different execution scenarios in these
projects. A class called “solution” was provided;
more specifically, its method “run” is the main entry
point of the solution for these projects. Therefore, all
tests are performed from this method and the classes
available in the package called “ready” could not be
modified during the experiment.
4.2 Planning
The planning followed the Goal Question Metric
(GQM) (Van Solingen et al., 2002) model for defin-
ing the goals and evaluation methods. The principles
formulated by Wohlin et al. (Wohlin et al., 2012) were
also adopted for the experimentation process. The
characterization of this study can be formally sum-
marized as follows:
Analyzing the effects of the CDD in comparison to
conventional practices focusing on early-stage of
software development with the aim of comparing the
quality of resulting implementation units through
object-oriented metrics, regarding the distribution
degree to such metrics from the standpoint of
software engineers in the context of the industry.
The hypotheses and objectives for the experimen-
tal study are described in detail as follows. It should
be noticed that the single difference when using CDD
here is determining the ICPs and imposing a feasible
limit to guide the development, assuming that it helps
reduce the cognitive load on the code.
We suggested a complexity constraint of 7 ICPs
(maximum value) for the group that used the CDD as
a design rule for the code to be produced. The plan-
ning phase has six parts described in the following
subsections.
4.2.1 Context Selection
The experiment was conducted involving full and se-
nior developers from the same company and it was
performed in a controlled way.
4.2.2 Formulation of the Hypothesis
The RQ
1
was formalized into two hypotheses. Null
hypothesis (H
0
): There is no difference between the
conventional practices (Non-CDD) and the adoption
of a complexity constraint, suggested by CDD, in the
early stages of software development when compar-
ing the quality metrics adopted in this study.
Alternative Hypothesis (H
1
): There is a differ-
ence between the conventional practices and the adop-
tion of a complexity constraint, in the early stages
of software development under the perspective of the
quality metrics adopted in this study. These hypothe-
ses can be formalized by Equations 1 and 2:
H
0
: (µNon −CDD
metrics
= µCDD
metrics
)
(1)
H
1
: (µNon −CDD
metrics
6= µCDD
metrics
)
(2)
Similarly, the RQ
2
was formalized into two hy-
potheses. Null hypothesis (H
0
): There is no signif-
icant difference between the conventional practices
(Non-CDD) and the adoption of a complexity con-
straint, suggested by CDD, considering distribution
degree for the quality metrics adopted in this study,
since they are equivalent.
Alternative hypothesis (H
1
): There is a differ-
ence between the conventional practices and the adop-
tion of a complexity constraint, taking into account
the distribution degree for the quality metrics adopted
in this study. The hypotheses for the RQ2 can be for-
malized by Equations 3 and 4:
H
0
: (µNon −CDD
distribution
= µCDD
distribution
)
(3)
H
1
: (µNon −CDD
distribution
6= µCDD
distribution
)
(4)
4.2.3 Variable Selection
The dependent variables are: “the values from static
analysis for object-oriented metrics (CBO, WMC,
RFC, LCOM and LOC)”. CBO (Coupling between
objects): this counts the number of dependencies for
a certain class, such as field declaration, method re-
turn types, variable declarations, etc. For this experi-
ment, dependencies to Java itself were ignored. WMC
(Weight Method Class), so-called McCabe’s complex-
ity (McCabe, 1976), this counts the number of branch
instructions in a class. RFC (Response for a Class)
counts the number of unique method invocations in a
class. LCOM (Lack of Cohesion of Methods) calcu-
lates the LCOM metric. Finally, LOC (Lines of code)
counts the lines of code, when ignoring empty lines
and comments. Note that these metrics were selected
because they are considered important according to
the code quality concerns of the company.
The independent variables are the projects
adopted in this study: Virtual library, Real Estate
Financing and Payment Service Provider.
ICEIS 2022 - 24th International Conference on Enterprise Information Systems
44

4.2.4 Selection of Subjects
The subjects were selected according to convenience
sampling (Wohlin et al., 2012). 44 software engineers
who took part in the experiment were working on the
development of web projects and they had a degree of
knowledge of the Java language.
4.2.5 Experimental Design
The experimental principle of assembling subjects
in homogeneous blocks (Wohlin et al., 2012) was
adopted to increase the accuracy of this experiment.
We looked for ways to mitigate interference from the
subjects’ experience in the treatment outcomes. One
pilot experiment were carried out with a restricted
number of subjects. It should be noted that they were
not included in the real experiment and the gathered
data were helpful in select proper projects and fea-
tures to be developed as a challenge. In addition, this
process enabled the groups to be rearranged for the
real experiment.
When separating the subjects into balanced
groups, we first asked them to fill out a Categoriza-
tion Form with questions about their experience in ar-
eas related to the experiment, a self-evaluation. Based
on the data that was obtained, we divided them into
two blocks with the same number of subjects. How-
ever, not all developers were invited and filled the
categorization form accepting the participation in the
date defined attended the experiment. We had al-
most a hundred developers who attended the train-
ing about software quality metrics and how this could
guide software development. The main CDD prin-
ciples were taught for half of them. Finally, more
than 60 subjects attended the experiment but only
44 projects were considered valid, i.e., the solution
was completely developed and verified using the test
scripts provided in the study. From this set, one group
with 26 developers had to apply conventional devel-
opment practices focusing on quality and the metrics
explained during the training. In contrast, the second
group with 18 subjects attended a planned training
session about the CDD principles to generate high-
quality code without exceeding the complexity con-
straint for each software artifact.
The Categorization Form included questions re-
garding knowledge about: (i) Object-oriented pro-
gramming, Java, the number of books read about
software development (e.g., Java, Clean Code, Clean
Architecture, Domain-Driven Design, etc.) and the
number of real (corporate) projects with active par-
ticipation; (ii) professional experience in Java (More
than 3 years, 2 to 3 year or only 1 year); (iii) known
software metrics by them and that can eventually be
used to improve code cohesion and the separation of
concerns; (iv) programming practices and code de-
sign that they employ daily; Finally, (v) testing ac-
tivities and tools.
Figure 2 describes the results of the application
of this form in a grouped bar chart. The subjects
“S27-S15” (Part A) belong to the group that applied
CDD principles (“CDD group”) in their projects and
the subjects “S25-S80” (Part B) followed conven-
tional practices without a cognitive complexity con-
straint (“Non-CDD group”). This chart takes account
of numeric values (number of books, courses and
real/corporate projects) for each subject. The main
reason to use these elements is that the “time experi-
ence” is a relative measurement. For instance, likely,
a programmer with little time for development but
who has attended a higher number of projects can per-
form better than a person with more time experience
and attended a low number of projects. Nevertheless,
data related to professional experience were gathered
in terms of years of Java development. More than 3
years: 11 (CDD group) and 14 (Non-CDD group);
Only 1 year: 2 (CDD group) and 5 (Non-CDD group).
Finally, Between 2 to 3 years: 5 (CDD group) and 7
(Non-CDD group).
A
B
Figure 2: Gathered data with the Categorization Form.
Additional information was also obtained to de-
fine this separation which can be described as fol-
lows, including corresponding percentages of an-
Effects of Cognitive-driven Development in the Early Stages of the Software Development Life Cycle
45

swers. Such answers were also crucial in determining
which subjects should develop which projects.
With regard to software metrics, we asked the
participants which one they use to generate code
thinking about readability, cohesion and separation
of concerns. The choices/answers where as fol-
lows: Fan-in/Fan-out (9.09 %), Cyclomatic Com-
plexity (27.27 %), KLOC (29.55 %), Number of root
classes (9.09 %), Coupling between objects (72.73
%), LCOM (47.73 %), Class size (47.73 %), Coupling
factor (43.18 %) or Software Maturity Index (SMI)
value (11.36 %).
As regards the programming practices and code
design, most subjects underlined the importance of
following principles from: Clean Architecture (52.27
%), SOLID (79.55 %), Domain Driven Design (DDD)
(38.64 %), (Test Driven Development (TDD) (45.45
%), General responsibility assignment software pat-
terns (GRASP) (6.82 %) and Conventional practices
for code cohesion (47.73 %). Finally, for testing
techniques they were as follows: functional testing
techniques (56.82 %), structural testing techniques
(31.82 %) and some subjects reported that they do not
perform testing activities in a systematic way (11.36
%).
4.2.6 Instrumentation
A document was provided to the subjects that de-
scribed constraints and guidelines to assist them in
both the development and the data submission pro-
cess, as follows:
• The initial package structure had to be kept;
• Automated tests must be kept working completely
without any changes;
• It is not allowed to modify the classes available in
an specific package (called “pronto”).
Concerning the guidelines, our suggestion was to
fork the corresponding repository from GitHub and
import it into IDEs. Each subject was assigned to de-
velop just one of the three projects; the researchers
made this definition considering the balance of groups
concerning projects. After the development, the sub-
jects were requested to submit the URLs of their re-
mote repositories using a web form.
4.3 Operation
Once the experiment had been defined and planned, it
was undertaken through the following stages: prepa-
ration, operation and validation of the collected data.
4.3.1 Preparation
At this stage, the subjects were committed to exper-
imenting and were made aware of its purpose. They
accepted the confidentiality terms regarding the pro-
vided data, which would be only used for research
purposes, and were granted their freedom to withdraw
by signing a Consent Form. In addition, other objects
were provided:
• Characterization Form: A questionnaire in which
the subjects assessed their knowledge of the tech-
nologies and concepts used in the experiment;
• Instructions: A document describing all the
stages, including the instructions about the sub-
mission process of the forked repository and
classes provided for each project;
• Data Collection Form: Document to be filled in
by the participants with the information about the
projects and their suggestions to improve future
experimental studies..
The platform adopted had Java as its implementa-
tion language and Eclipse or IntelliJ IDEA as devel-
opment environments. The groups attended 1-hour
training in a web meeting format separately (one for
Non-CDD and the other for CDD group). In addition,
the meetings were recorded and shared to clarify the
main goal for our study: producing source code us-
ing excellent practices focusing on readability. Com-
plementary materials were provided and a webchat
was created for settling doubts before the experiment,
which lasted one week.
For the CDD group, a class from a real-world
project was selected to illustrate the identification pro-
cess of ICPs and define a complexity constraint to
keep a feasible understanding degree for all develop-
ers in a supposed team. The CDD fundamentals were
explained by highlighting the importance of defining
a cognitive complexity constraint to guide the devel-
opment (Souza and Pinto, 2020).
The maximum time to be spent for all subjects
during the development activity was defined as four
and a half hours. This includes the time to understand
the project specifications, create new classes, include
and fix features and finally, execute the test scripts.
This time interval was defined based on the average
time in a pilot study.
4.4 Data Analysis
This section examines our findings. The analysis is
divided into two areas: (i) descriptive statistics and
(ii) hypotheses testing.
ICEIS 2022 - 24th International Conference on Enterprise Information Systems
46
4.4.1 Descriptive Statistics
The quality of the input data (Wohlin et al., 2012) was
verified before the statistical methods were applied.
There is a risk that incorrect data sets can be obtained
due to some error or the presence of outliers, which
are data values much higher or much lower than the
remaining data.
The metrics adopted in this study have different
scales and when taking note of the “resulting imple-
mentation units” we decided to be conservative and
analyze all the gathered data, in an individual way
per metric. When clarifying descriptive statistics and
making comparisons, it is essential to explain that the
raw data for the metrics were analyzed. We also ap-
plied the standard deviations to measure the amount
of variation or dispersion of a set of values.
Standard deviations were calculated for each
project per subject, considering the implementation
units created during our study. Table 1 includes these
kinds of data, respectively. The data were separated
considering the projects, subjects from CDD or Non-
CDD group and finally, the SD(s) that is the standard
deviation of the sample standard deviations (s) for val-
ues of the metrics. For instance, in the left part of the
Table, a version of “Payment Service Provider” was
developed by S40 and the standard deviations for the
values collected for the metrics: CBO, WMC, RFC,
LCOM and LOC were: 1.41, 1.87, 2.59, 1.52 and
8.88, respectively. From another perspective, the stan-
dard deviations for CDD group (SD(s)) were 0.84,
1.13, 3.86, 1.30 and 15.90.
Although it is difficult to have a generalizable re-
sult, in most cases the standards deviations (SD(s)) for
the projects delivered by Non-CDD group are more
than the values for SD(s) considering the projects
developed by CDD group. This fact can raise sev-
eral discussions since all the projects were started
in this experiment, i.e., it was not expected to have
a difference between the dispersion of the metrics
for the projects developed by the two groups in the
early stages of software development. We assume that
adopting a cognitive complexity constraint, as sug-
gested by the CDD, enhances the possibility of slicing
the features. This contributes to achieving better val-
ues for the metrics adopted in this study.
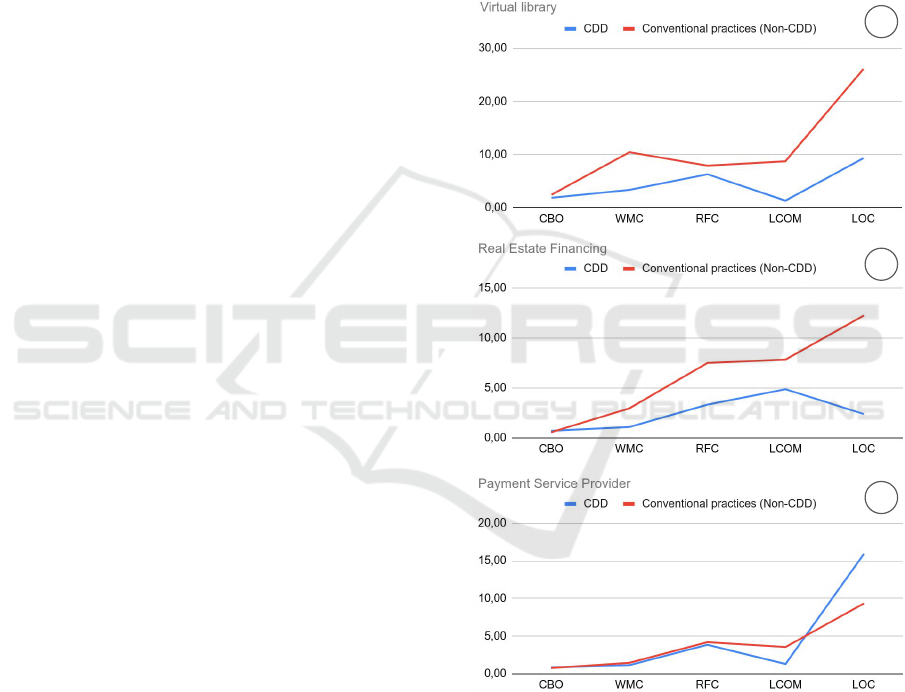
Figure 3 presents a summarized view for the
SD(s), taking into account all versions created by sub-
jects from CDD and Non-CDD group. This chart is
helpful to observe that the subjects that followed a
complexity constraint were implicitly guided to im-
prove the code quality. This behavior of the subjects
could be expected but the existence of a restriction
forced the results.
For Virtual library (A) and Real Estate Financing
(B) it is clear that versions implemented by Non-CDD
group had dispersion measures higher than the ver-
sions created by CDD group. Nonetheless, for the
versions of the Payment Service Provider (C) this per-
ception is not the same because the dispersion mea-
sures between the groups were very close. This effect
can be justified because this project is less complex
than the others in terms of features/business rules to
be implemented. Thus, we can not observe a very
distant dispersion measure between the values of the
metrics for the implementation units.
A
B
C
Figure 3: Standard deviations considering all projects
(SD(s)).
4.4.2 Hypotheses Testing
Metrics - Since some statistical tests only apply if
the population follows a normal distribution, before
choosing a statistical test, we examined whether our
gathered data departed from linearity. This involved
conducting the Shapiro-Wilk normality test to check
if the samples had a normal (ND) or non-normal dis-
tribution (NND).
Effects of Cognitive-driven Development in the Early Stages of the Software Development Life Cycle
47

Table 1: Standard deviations for the metrics considering all versions of projects per subject.
Payment Service Provider Real Estate Financing Virtual library
CDD group CDD group CDD group
CBO WMC RFC LCOM LOC CBO WMC RFC LCOM LOC CBO WMC RFC LCOM LOC
S27 2.15 1.46 3.48 3.68 4.24 S13 0.93 3.23 1.13 4.0 10.27 S7 3.76 1.57 3.58 0 5.44
S28 0.00 4.00 13.00 0.00 46.00 S16 1.42 4.11 4.16 8.45 13.57 S10 7.00 9.00 13.00 3 26.00
S32 1.64 3.65 3.54 2.05 14.72 S17 2.73 3.06 3.62 7.84 12.16 S11 2.31 1.53 0.58 0 4.04
S40 1.41 1.87 2.59 1.52 8.88 S18 1.96 3.59 11.82 14.09 11.82 S12 3.87 1.91 4.36 1.5 10.47
S42 2.00 2.22 4.20 0.58 10.02 S19 1.59 5.20 4.61 0.33 12.89 S15 6.00 6.00 15.00 0 19.00
S81 2.30 1.35 5.71 2.23 3.82 S24 1.10 2.39 4.34 0.45 8.22
SD(𝑠)
1.88 3.37 6.31 1.34 9.34
SD(𝑠)
0.84 1.13 3.86 1.30 15.90 S79 0.60 1.92 3.48 5.0 7.25
SD(𝑠)
0.71 1.09 3.33 4.87 2.40
Non-CDD group
CBO WMC RFC LCOM LOC Non-CDD group Non-CDD group
S25 1.90 3.49 7.89 5.65 9.33 CBO WMC RFC LCOM LOC CBO WMC RFC LCOM LOC
S35 1.15 1.15 1.00 0.00 1.00 S53 1.82 4.24 6.01 9.08 15.29 S8 2.94 1.71 2.38 0.00 3.77
S64 2.01 1.05 2.15 1.32 4.32 S55 2.01 4.36 3.18 21.26 14.85 S46 3.35 3.95 4.22 0.00 15.62
S66 3.16 4.62 6.31 11.05 15.83 S57 1.00 12.00 12.00 6.00 44.00 S47 7.00 18.00 20.00 21.00 61.00
S69 2.00 1.00 1.53 0.58 3.46 S59 2.42 3.32 4.70 10.76 10.65 S48 7.00 29.00 8.00 15.00 66.00
S70 1.77 4.03 6.29 5.55 15.84 S61 1.92 2.77 13.86 29.47 15.82 S50 2.36 1.73 1.91 0.00 5.25
S71 0.89 3.13 2.88 7.28 14.34 S67 0.74 5.45 3.52 16.99 11.26 S54 7.00 5.00 20.00 1.00 29.00
S74 0.58 1.53 6.11 3.21 11.55 S73 1.29 6.55 11.53 15.93 27.98 S80 1.53 3.51 4.73 1.15 10.69
S76 1.72 0.90 3.05 0.49 5.77 S85 1.91 7.27 25.50 22.90 34.30
SD(𝑠)
2.45 10.48 7.93 8.76 26.10
S87 0.71 3.54 9.90 0.00 25.46
SD(𝑠)
0.57 2.95 7.50 7.84 12.24
S89 1.00 4.00 15.00 3.00 31.00
SD(𝑠)
0.76 1.45 4.21 3.57 9.34
Table 2 shows the results of the normality tests for
all samples, i.e., averages of the values for the metrics
in relation to the versions implemented by the sub-
jects. For instance, considering all metrics adopted in
this study for versions of “Payment Service Provider”
developed by Non-CDD and CDD groups we do not
reject the hypothesis that the data are from a normally
distributed population. This is different when consid-
ering the metric LCOM for “Real State Financing”
because both Non-CDD and for CDD group we do
not reject the hypothesis that the data are from a non-
normal distribution.
Variance testing was performed for all metrics
considering the solutions produced by Non-CDD and
CDD groups for “Payment Service Provider”. The
p-values were 0.235, 0.5766, 0.8666, 0.1007 and
0.02448 for CBO, WMC, RFC, LCOM and LOC
(based on α = 0.05, respectively). Unpaired Two-
Samples T-test (or unpaired t-test) can be used to com-
pare the means of two unrelated groups of samples.
This kind of statistical testing was conducted and
the results for p-values were 0.5386, 0.8331, 0.9524,
0.2708 and 0.6592 for CBO, WMC, RFC, LCOM and
LOC, respectively. Therefore, we can not reject the
null hypothesis for the difference between the ver-
sions implemented by Non-CDD and CDD groups,
in terms of the metrics (on averages) adopted in this
study.
The same testing was carried out for the solutions
of “Real State Financing” considering the following
metrics: CBO, WMC, RFC and LOC. The p-values
were 0.1959, 0.00376, 0.2256 and 0.004085. With
this in mind, Unpaired Two-Samples T-test was ver-
ified and the p-values were 0.5753, 0.04231, 0.2091
and 0.03565. Therefore, it is possible to reject the null
hypothesis for WMC and LOC, considering α = 0.05.
Similarly, variance testing was performed for the
implementations of “Virtual library” considering just
CBO and LOC due to the values from the Shapiro-
Wilk normality test, as aforementioned. The p-values
were 0.7245 and 0.01444. Unpaired Two-Samples T-
test ware also verified and as a result, the p-values
were 0.8603 and 0.2184. Finally, we can not reject
the null hypothesis for CBO and LOC considering the
versions produced by Non-CDD and CDD groups.
The Mann-Whitney U Test is a nonparametric test
that can be used when one of the samples does not
follow a normal distribution. We applied this kind of
testing for LCOM considering the solutions for “Real
State Financing” and for WMC, RFC and LCOM for
“Virtual library”. Summarizing the results, the value
for p-value with respect to the LCOM samples was
0.005905. Thus, there is a difference between the ver-
sions for “Real State Financing” produced by Non-
CDD and CDD groups, i.e., it is possible to reject
the null hypothesis for LCOM is this project. On the
other hand, we can not reject the null hypothesis for
WMC, RFC and LCOM for “Virtual library”, the val-
ues for p-values were 0.8763, 0.8705 and 0.6647, re-
spectively.
Hypothesis Testing - Standard deviations: Simi-
larly, we applied statistical tests to determine if there
is a difference between the standard deviations for the
values of the metrics.
ICEIS 2022 - 24th International Conference on Enterprise Information Systems
48

Table 2: Shapiro-Wilk normality tests for metrics samples
(averages).
Payment Service Provider
Metric Samples Results
CBO
Non-CDD p-value = 0.1604 ND
CDD p-value = 0.6543
WMC
Non-CDD p-value = 0.241 ND
CDD p-value = 0.8814
RFC
Non-CDD p-value = 0.1015 ND
CDD p-value = 0.242
LCOM
Non-CDD p-value = 0.2942 ND
CDD p-value = 0.4326
LOC
Non-CDD p-value = 0.06566 ND
CDD p-value = 0.06413
Real State Financing
CBO
Non-CDD p-value = 0.5138 ND
CDD p-value = 0.6742
WMC
Non-CDD p-value = 0.1902 ND
CDD p-value = 0.2505
RFC
Non-CDD p-value = 0.6314 ND
CDD p-value = 0.7724
LCOM
Non-CDD p-value = 0.01147 NND
CDD p-value = 0.006358
LOC
Non-CDD p-value = 0.1637 ND
CDD p-value = 0.575
Virtual library
CBO
Non-CDD p-value = 0.1153 ND
CDD p-value = 0.6922
WMC
Non-CDD p-value = 0.005702 NND
CDD p-value = 0.3644
RFC
Non-CDD p-value = 0.03518 NND
CDD p-value = 0.2551
LCOM
Non-CDD p-value = 0.002211 NND
CDD p-value = 0.04824
LOC
Non-CDD p-value = 0.0508
CDD p-value = 0.6462 ND
Variance testing was performed for CBO and
LCOM samples considering the solutions produced
by Non-CDD and CDD groups for “Payment Service
Provider”. The p-values were 0.724 and 0.03802. Un-
paired Two-Samples T-test ware also verified and as
results, the p-values were 0.9062 and 0.1571. There-
fore, it is not possible to reject the null hypothesis for
the measures of the dispersion of the set of values re-
fer to such metrics.
Similarly, we carried out the variance testing for
CBO, WMC, LCOM and LOC for “Real State Fi-
nancing” and the results for p-values were 0.63,
0.06206, 0.007702 and 0.04069. Therefore, it is pos-
sible to reject the null hypothesis only for the LCOM
and LOC samples. Finally, for “Virtual library” the
variance testing was applied only for LOC sample,
resulting in 0.2719 as p-value. This indicates that we
can not reject the null hypothesis for such metric in
this project.
Mann-Whitney U Test was applied for the WMC,
RFC and LOC samples with respect to the solutions
produced for “Payment Service Provider” and the p-
values were 0.9199, 1 and 0.8836, respectively. Thus,
it is not possible to reject the null hypothesis for such
WMC, RFC and LOC samples in this project. This
same test was carried out for RFC sample taking into
account the “Real State Financing” and the p-value
was 0.1206. Finally, CBO, WMC, RFC and LCOM
samples obtained for “Virtual library” were evaluated
using Mann-Whitney U Test and as p-values the re-
sults were: 0.9341, 0.4318, 0.7449 and 0.6647. Fi-
nally, both for “Real State Financing” and “Virtual
library”, it is not possible to reject the null hypothe-
sis concerning the difference between the dispersion
in the values for such metrics.
4.5 Threats to Validity
Internal Validity. Level of Experience of Subjects:
One can argue that the heterogeneous knowledge of
the subjects could have affected the collected data.
To overcome this threat, the participants were divided
into two-balanced blocks that accounted for their level
of experience.
During the training, the subjects that had to apply
the cognitive complexity constraint attended a train-
ing session on how to use this limit to guide the de-
velopment process. Thus, they adopted conventional
practices during programming like the other group but
following such limit;
Productivity under evaluation: the results may
have been affected because the subjects often tend to
think they are being evaluated during an experiment.
We attempted to overcome this problem by explaining
to the subjects that no one was being evaluated and
their participation would be treated as anonymous;
Validity by Construction. Hypothesis expectations:
the subjects already knew the researchers, a point
which is reflected in one of our hypotheses. This issue
could have affected the collected data and caused the
experiment to be less impartial. Impartiality was kept
by insisting that the participants had to keep a steady
pace throughout the study. The main challenge for
the researchers was to perform this experiment com-
pletely using a web meeting room due to the restric-
tions of social isolation and the pandemic caused by
COVID-19.
External Validity. Interaction between configuration
and treatment: it is possible that the exercises car-
ried out in the experiment are not accurate for every
Java web application. To mitigate this threat, different
projects were selected based on the real-world crite-
rion, i.e., the complexity of the applications and the
Effects of Cognitive-driven Development in the Early Stages of the Software Development Life Cycle
49

Table 3: Shapiro-Wilk normality tests for standard devia-
tions samples.
Payment Service Provider
Metric Samples Results
CBO
Non-CDD p-value = 0.3137 ND
CDD p-value = 0.1119
WMC
Non-CDD p-value = 0.04006 NND
CDD p-value = 0.1895
RFC
Non-CDD p-value = 0.1956
CDD p-value = 0.01326 NND
LCOM
Non-CDD p-value = 0.1196 ND
CDD p-value = 0.9022
LOC
Non-CDD p-value = 0.4079
CDD p-value = 0.01003 NND
Real State Financing
CBO
Non-CDD p-value = 0.4938 ND
CDD p-value = 0.8474
WMC
Non-CDD p-value = 0.1584 ND
CDD p-value = 0.9514
RFC
Non-CDD p-value = 0.1098
CDD p-value = 0.01573 NND
LCOM
Non-CDD p-value = 0.921 ND
CDD p-value = 0.6014
LOC
Non-CDD p-value = 0.08716 ND
CDD p-value = 0.4502
Virtual library
CBO
Non-CDD p-value = 0.04983 NND
CDD p-value = 0.6808
WMC
Non-CDD p-value = 0.01113 NND
CDD p-value = 0.08483
RFC
Non-CDD p-value = 0.02475 NND
CDD p-value = 0.3184
LCOM
Non-CDD p-value = 0.002712 NND
CDD p-value = 0.04595
LOC
Non-CDD p-value = 0.08004 ND
CDD p-value = 0.4999
fact that the researchers have contact with real-world
projects of the company.
Conclusion Validity. Measure reliability: this refers
to the metrics used to measure the development effort.
To mitigate this threat, we only used the time spent,
which was captured in forms filled in by the subjects.
This was useful only to observe the Productivity of
the developers;
Low Statistical Power: a statistical test can reveal re-
liable data. Unpaired Two-Samples T-test and Mann-
Whitney U Test were adopted to analyze the metrics
for all the delivered versions statistically.
5 CONCLUSION
Human factors in software engineering impose sev-
eral challenges. The maintenance can consume more
resources than all the effort spent in the creation of
new software (Lenberg et al., 2015). Cognitive Load
Theory is a framework for investigating the effects
of human cognition on task performance and learn-
ing (Sweller, 1988; Sweller, 2010). Cognition is con-
strained by a bottleneck created by working mem-
ory, in which we humans can only hold a handful
of elements at a time for active processing; to the
best of our knowledge, the cognitive complexity con-
straint has not been applied previously to guide soft-
ware development. Thus, we proposed a method
called Cognitive-driven development (CDD) (Souza
and Pinto, 2020) in which a pre-defined cognitive
complexity for application code can be used to limit
the number of intrinsic complexity points and tack-
ling the growing problem of software complexity, by
reducing the cognitive overload.
The main focus of this work was to assess the ef-
fects of adopting a complexity constraint in the early
stages of software development. Software Develop-
ment Companies in Brazil use the projects chosen for
this study for hiring new software engineers. 44 expe-
rienced developers attended our experiment, divided
into Non-CDD and CDD groups. Both groups were
aware of the importance of quality metrics and the
need to produce high-quality code for other develop-
ers to understand. The CDD group received different
training that included practices guided by a cognitive
complexity limit, including our suggestions for ele-
ments to set a constraint.
The main findings of our experiment showed that
in terms of quality metrics (on average) there was no
statistically significant difference between samples of
CBO, WMC, RFC, LCOM and LOC, with or with-
out complexity constraint, i.e., projects developed by
Non-CDD and CDD groups. However, this is not true
for WMC, LOC, and LCOM samples regarding the
“Real State Financing” because the projects delivered
by the CDD group were better evaluated considering
such metrics. Regarding the standard deviations for
the samples, only LCOM and LOC for “Real State Fi-
nancing” had differences when employing a complex-
ity constraint. In addition, it was possible to note a
lower dispersion for the values of the metrics samples
gathered when analyzing the projects implemented
by the CDD group. Such results can be considered
positive since all projects were evaluated in the early
stages of development. A package containing the
tools, materials and more details about the experimen-
tal stages is available at https://bit.ly/3xUdsuo.
ICEIS 2022 - 24th International Conference on Enterprise Information Systems
50

As future investigations, we intend to explore the
following factors: (i) defining an automated refactor-
ing strategy employing search-based refactoring and
cognitive complexity constraints and (ii) carrying out
new empirical-based studies to evaluate restructured
projects with CDD principles, by exploring the num-
ber of faults and understanding development in the
medium and long term.
ACKNOWLEDGEMENT
This study was financed in part by the PROPESP and
PROINTER/UFPA.
REFERENCES
Chandler, P. and Sweller, J. (1991). Cognitive load theory
and the format of instruction. Cognition and instruc-
tion, 8(4):293–332.
Clarke, P., O’Connor, R. V., and Leavy, B. (2016). A com-
plexity theory viewpoint on the software development
process and situational context. In Proceedings of
the International Conference on Software and Systems
Process, pages 86–90.
Duran, R., Sorva, J., and Leite, S. (2018). Towards an anal-
ysis of program complexity from a cognitive perspec-
tive. In Proceedings of the 2018 ACM Conference on
International Computing Education Research, pages
21–30.
Fraser, S. D., Brooks, F. P., Fowler, M., Lopez, R.,
Namioka, A., Northrop, L., Parnas, D. L., and
Thomas, D. (2007). “No Silver Bullet” Reloaded:
Retrospective on “Essence and Accidents of Software
Engineering”. In Companion to the 22nd ACM SIG-
PLAN Conference on Object-Oriented Programming
Systems and Applications Companion, OOPSLA ’07,
page 1026–1030, New York, NY, USA. Association
for Computing Machinery.
Gonc¸ales, L., Farias, K., da Silva, B., and Fessler, J. (2019).
Measuring the cognitive load of software developers:
a systematic mapping study. In 2019 IEEE/ACM 27th
International Conference on Program Comprehension
(ICPC), pages 42–52. IEEE.
ISO:ISO/IEC 25010 (2011). Systems and software engi-
neering – Systems and software Quality Requirements
and Evaluation (SQuaRE), System and software qual-
ity models. International Organization for Standard-
ization ISO.
Lenberg, P., Feldt, R., and Wallgren, L. G. (2015). Human
factors related challenges in software engineering–an
industrial perspective. In 2015 ieee/acm 8th interna-
tional workshop on cooperative and human aspects of
software engineering, pages 43–49. IEEE.
Liskov, B. and Zilles, S. (1974). Programming with abstract
data types. ACM Sigplan Notices, 9(4):50–59.
McCabe, T. J. (1976). A complexity measure. IEEE Trans-
actions on software Engineering, (4):308–320.
Miller, G. A. (1956). The magical number seven, plus or
minus two: Some limits on our capacity for processing
information. Psychological review, 63(2):81.
Misra, S., Adewumi, A., Fernandez-Sanz, L., and Damase-
vicius, R. (2018). A suite of object oriented cognitive
complexity metrics. IEEE Access, 6:8782–8796.
Parnas, D. L. (1972). On the criteria to be used in decom-
posing systems into modules. In Pioneers and Their
Contributions to Software Engineering, pages 479–
498. Springer.
Pinto., V., Tavares de Souza., A., Barboza de Oliveira., Y.,
and Ribeiro., D. (2021). Cognitive-driven develop-
ment: Preliminary results on software refactorings.
In Proceedings of the 16th International Conference
on Evaluation of Novel Approaches to Software En-
gineering - Volume 1: ENASE,, pages 92–102. IN-
STICC, SciTePress.
Shao, J. and Wang, Y. (2003). A new measure of soft-
ware complexity based on cognitive weights. Cana-
dian Journal of Electrical and Computer Engineering,
28(2):69–74.
Shepperd, M. (1988). A critique of cyclomatic complexity
as a software metric. Software Engineering Journal,
3(2):30–36.
Souza, A. L. O. T. d. and Pinto, V. H. S. C. (2020). Toward
a definition of cognitive-driven development. In Pro-
ceedings of 36th IEEE International Conference on
Software Maintenance and Evolution (ICSME), pages
776–778.
Sweller, J. (1988). Cognitive load during problem solving:
Effects on learning. Cognitive science, 12(2):257–
285.
Sweller, J. (2010). Cognitive load theory: Recent theoreti-
cal advances.
Van Solingen, R., Basili, V., Caldiera, G., and Rombach,
H. D. (2002). Goal question metric (gqm) approach.
Encyclopedia of software engineering.
Wang, Y. (2006). Cognitive complexity of software and its
measurement. In 2006 5th IEEE International Confer-
ence on Cognitive Informatics, volume 1, pages 226–
235. IEEE.
Weyuker, E. J. (1988). Evaluating software complexity
measures. IEEE transactions on Software Engineer-
ing, 14(9):1357–1365.
Wohlin, C., Runeson, P., H
¨
ost, M., Ohlsson, M. C., Reg-
nell, B., and Wessl
´
en, A. (2012). Experimentation in
Software Engineering. Springer Berlin Heidelberg.
Yi, T. and Fang, C. (2020). A complexity metric for object-
oriented software. International Journal of Computers
and Applications, 42(6):544–549.
Zuse, H. (2019). Software complexity: measures and meth-
ods, volume 4. Walter de Gruyter GmbH & Co KG.
Effects of Cognitive-driven Development in the Early Stages of the Software Development Life Cycle
51
