
Design of an Energy-efficient Hybrid UWB-RF Indoor Distance
Estimation System
Sabrine Khriji
a
, Dhouha El Houssaini
b
and Olfa Kanoun
c
Chair of Measurement and Sensor Technology, Chemnitz University of Technhology, Reichenhainer Straße 70,
09126 Chemnitz, Germany
Keywords:
WSN, UWB, RF, Indoor Localization, Energy-saving, Wireless Communication.
Abstract:
Wireless Sensor Network (WSN) plays a significant role in modern applications by offering different services,
including state machines monitoring, predictive maintenance, and vehicle/store tracking. In such applications,
it is crucial to apply localization methods to identify the current location of sensor nodes with high accuracy.
Due to the energy constraint of sensor nodes, the energy consumption needs to be highly considered while
performing the localization process. In this regard, this paper aims to design an energy-efficient and accurate
localization system. Therefore, a novel hybrid solution is designed involving the Ultra Wide Band (UWB)
technology and Radio Frequency (RF) transceiver. The UWB is based on Decawave’s DWM1000 transceiver,
which provides accurate distance measurements with a high power consumption. To reduce the power con-
sumption, the data transmission between nodes is performed by the low-power RF transceiver. Using this
architecture, the experimental validation shows a good performance in both power consumption and accuracy.
The system’s overall power consumption is reduced as well as a 10-centimeter accuracy level is achieved.
1 INTRODUCTION
Internet of Things (IoT) is nowadays of high inter-
est in several sectors, including smart home, precision
agriculture and e-health and industry 4.0 (Kanoun
et al., 2021). In particular, Wireless Sensor Networks
(WSNs) are gaining importance as enabling technol-
ogy for monitoring and decision-making (Khriji et al.,
2018), (El Houssaini et al., 2018a). With the ad-
vancements in WSNs, indoor localization becomes
inevitable to track objects in indoor environments by
offering many services, including predictive mainte-
nance, store tracking and state machine monitoring
(H
¨
oflinger et al., 2018), (Obeidat et al., 2021) and
(El Houssaini et al., 2018b). Therefore, different posi-
tioning techniques are investigated to locate wireless
sensor nodes.
Determining the current location of sensor nodes
with high accuracy is the principal target of most ex-
isting localization studies. However, this requires a
high power demand. Due to the energy constraint
of sensor nodes, the energy consumption needs to
a
https://orcid.org/0000-0002-0562-0116
b
https://orcid.org/0000-0003-1764-6601
c
https://orcid.org/0000-0002-7166-1266
be highly considered while performing the localiza-
tion process. Only a few research (Kaur and Mal-
hotra, 2016), (Cheng, 2021), and (Amutha et al.,
2020) address the energy aspects of localization along
with the accuracy. Therefore, the main aim of this
paper is to establish a trade-off between accuracy
and energy consumption for indoor positioning. In
this context, an energy-efficient accurate positioning
system is designed, which embeds the Ultra Wide
Band (UWB) compliant wireless transceiver mod-
ule, DWM1000 and the low-power wireless mod-
ule, panStamp. The first module determines the dis-
tance between nodes with high accuracy. The distance
calculation as well as performing different packets
transmission/reception are carried out with the low-
power radio transceiver in-built on the panStamp
node. Thus, it reduces the overall power consump-
tion needed for node positioning. To conclude, the
key contributions of this work are:
• A panoramic view of indoor positioning technolo-
gies
• Design of energy-efficient accurate positioning
system involving UWB wireless module and low-
power RF transceiver
The rest of the paper is organized as follows. Section
Khriji, S., El Houssaini, D. and Kanoun, O.
Design of an Energy-efficient Hybrid UWB-RF Indoor Distance Estimation System.
DOI: 10.5220/0011012700003118
In Proceedings of the 11th International Conference on Sensor Networks (SENSORNETS 2022), pages 249-255
ISBN: 978-989-758-551-7; ISSN: 2184-4380
Copyright
c
2022 by SCITEPRESS – Science and Technology Publications, Lda. All rights reserved
249
2 presents an overview of indoor positioning tech-
nologies with highlighting the use of the UWB tech-
nology. The design and implementation of the pro-
posed distance measurement architecture is provided
in section 3. Section 4 presents the experimental re-
sults of the designed system in terms of accuracy and
power consumption. Section 5 concludes the paper.
2 OVERVIEW OF INDOOR
POSITIONING
TECHNOLOGIES
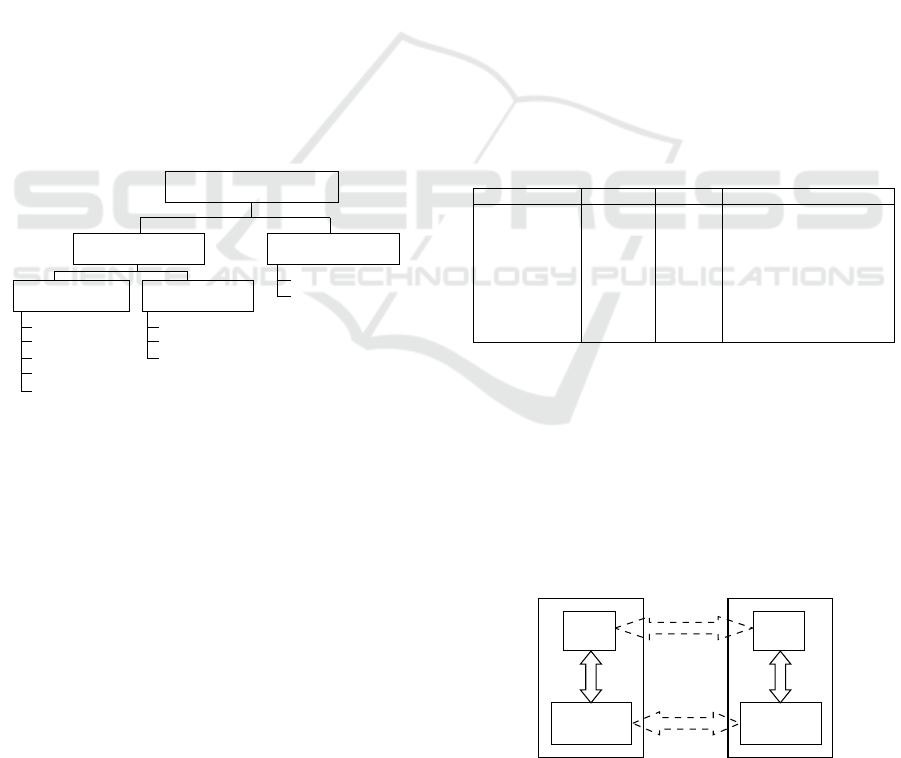
Indoor positioning can be divided into building de-
pendent and building independent (Alarifi et al.,
2016) technologies (see Fig. 1). Building dependent
technologies rely on the building, where they are go-
ing to be installed. They are based on an available
technology in the building, or on the building’s struc-
ture and layout. This category can be further clas-
sified into two classes: Dedicated infrastructure re-
quired and building’s infrastructure utilized. The in-
door positioning that needs a dedicated infrastructure
can be RFID, infrared, ultrasonic, Zigbee and UWB.
Indoor positioning technologies
Building dependent Building independent
Dedicated
infrastructure required
Building’s
infrastructure utilized
RFID
UWB
Infrared
Ultrasonic
Zigbee
WiFi
Bluetooth
Cellular-based
Dead reckoning
Image-based technology
Figure 1: Indoor positioning technologies.
RFID systems rely on proximity detection, and
hence have an accuracy of dm-m level (Xu et al.,
2017). A larger area requires several RFID tags, re-
sulting on increasing the cost as well as power con-
sumption. UWB systems can work in Non-Line of
Sight (NLOS) conditions. UWB operates within 3.5
to 6.5 GHz, which does not interfere with other fre-
quencies. The Infrared (IR) wireless communication
uses the invisible spectrum of light (Arbula and Lju-
bic, 2020). Differential phase-shift and angle of ar-
rival (AoA) localization methods are commonly used
with IR technology. Another technology requiring the
building’s infrastructure is the ultrasonic technology.
It is based on the ToF (Time of Flight) localization
method. Therefore, ultrasound impulses are carried
out by the tag to measure the distance to the anchor.
This technology has a short-range, and does not inter-
fere with electromagnetic waves.
The Zigbee technology can be also used to de-
termine the nodes’ positions. This technology is de-
signed for applications requiring low throughput and
low power consumption. It comprises a microcon-
troller and a multi-channel bidirectional radio on a
single piece of silicon (Aykac¸ et al., 2017). Typically,
Received Signal Strength (RSS) values have been em-
ployed to determine the distance between Zigbee-
based sensor nodes.
WiFi, Bluetooth and cellular-based technologies
refer to the indoor positioning technologies that use
the building’ infrastructure. WiFi positioning systems
can reach up to a range of 50 m, but the accuracy ob-
tained is very low (in meters).
Furthermore, building independent technologies
can be a dead reckoning and image-based technolo-
gies. In dead reckoning, the current position of an
object can be determined by its previous position, di-
rection of travel and speed (Zhou et al., 2015). On the
other hand, image-based technologies are often sup-
ported by cameras and computer vision technologies
(Wu et al., 2018). A summary of different indoor po-
sitioning technologies is depicted in Table. 1.
Table 1: Indoor positioning technologies.
Technology Range Accuracy Measuring Principle
RFID 50 m dm-m Cell of Origin
Ultra-Wide Band 50 m cm TWR,ToA,TDoA
Infrared 5 m cm-m Differential phase-shift, AoA
Ultrasound 10 m cm ToA, TDoA
Zigbee 20 -30 m cm Trilateration, RSSI
WiFi 50 m m RSSI,ToA,TDoA
Bluetooth 10 - 100 m m Proximity, RSS
Dead reckoning - m Tracking
Cameras 10 m mm-dm Pattern recognition
3 DESIGNED HYBRID SYSTEM
The main aim of the proposed system is to determine
the distance between sensor nodes with a high accu-
racy and less power consumption. The block diagram
of the localization system architecture is depicted in
Fig. 2.
SPI
µC
UWB
Transceiver
UWB
Transceiver
µC
SPI
UWB
3.5 - 6.5 GHz
868 MHz
RF
Tag
Anchor (x3+)
Figure 2: UWB localisation system architecture.
Therefore, the UWB system consists of a tag and
EWSN-IoT 2022 - Special Session on Energy-Aware Wireless Sensor Networks for IoT
250

several anchors. Both tag and anchor consist of the
same hardware, with a microcontroller and an UWB
transceiver. The UWB technology is used to pro-
vide a high accuracy with limited range. A low-
power microcontroller is connected to the UWB via
Serial Peripheral Interface (SPI) to ensure the compu-
tation of distance measurements. A low-power radio
transceiver with a frequency of 868 MHz is used to
exchange other data needed by the application.
DWM1000
Panstamp
NRG 2.0
17
IRQ
D7
16
SCK
D2
15
MISO
D1
14
MOSI
D0
13
CSn
D22
18
3
RST
D21
Figure 3: Interfacing DWM1000 with Panstamp NRG 2.0.
To determine the distance between the tag
and anchor nodes, the wireless transceiver module
DWM1000 is used, which is an IEEE802.15.4-2011
UWB compliant module. This transceiver is used
only for communicating the distance between two
nodes (DWM, 2021). The main advantage of the se-
lected UWB transceiver is the high data rate commu-
nication, as it can transmit pulses with a bandwidth
up to 6.8 Mbps. It determines also the positions of
objects with an accuracy of 10 centimetres in NLoS
conditions. It supports TDoA and ToF location tech-
niques. This transceiver consists of the Two-Way
Ranging (TWR) method, which determines the ToA
of the UWB RF signal. Then, it calculates the dis-
tance between nodes by multiplying the time by the
speed of light.
To measure the distance between two nodes, three
messages need to be exchanged (see Fig. 4). The tag
sends a Poll message to know the address of the an-
chor in time referred to Time of Sending Poll (T
SP
).
The time of the Poll reception (T
RP
) is recorded by
the anchor, which replies with the response message
at time T
SR
. By receiving the response message, the
tag node records the time T
RR
, and composes a Final
message, including its address, T
SP
, T
RR
and T
SF
infor-
mation. Based on the timestamps, the communicated
signals between the tag and anchor are used to mea-
sure the ToA of the UWB signal, as presented in equa-
tion 1. Thereby, the distance is determined by multi-
plying the ToA of the UWB signal with the speed of
light c as depicted in equation 2.
Tag
Anchor
Poll
T
SP
T
RP
ToA
reply
1
ToA
T
SR
T
RR
Response
T
SF
T
RF
Final
reply
2
ToA
Report distance
Figure 4: Distance measurement using TWR technique im-
plemented on DWM1000 transceiver.
ToA =
(T
RR
−T
SP
)−(T
SR
−T
RP
)+(T
RF
−T
SR
)−(T
SF
−T
RR
)
4
(1)
distance = c × ToA (2)
Due to limited ressources of sensor node, the
power consumption is a key feature in wireless sen-
sor networks. Thereby, choosing low-power hardware
can reduce the overall node power consumption. In
this direction, the low-power RF-based wireless sen-
sor node, panStamp, is used. The module is based
on the CC430F5137 System on chip (SoC), including
the MSP430 microcontroller and CC1101 radio chip
(Salem et al., 2019), which operates at different fre-
quencies like 433 MHz, 868 MHz and 915 MHz. It
supports SPI communication, which enables the com-
munication with the DWM1000 module. The con-
nections are shown in Fig. 3. The panStamp com-
municates with the DWM1000 at 4 MHz SPI fre-
quency. Apart from SPI connection, a reset line (RST)
and interrupt request (IRQ) lines are connected to the
DWM1000. The RST line can be pulled low to re-
set the DWM1000 module. The IRQ is an input to
the Panstamp and is active high. An interrupt is gen-
erated by the DWM1000 to notify Panstamp at each
event such as transmission, reception or wake up.
Fig. 5 shows the block diagram of the tag node.
The initialization step includes the configuration of
the SPI interface with the microcontroller. The SPI
communication is initiated at the desired rate. During
this phase, the DWM1000 transmission rate and fre-
quency are configured. A TimerDelay is set, which
defines the rate of the distance measurement. Every
time, the internal clock of the microcontroller reaches
the TimerDelay, a ranging cycle is initiated. This
Design of an Energy-efficient Hybrid UWB-RF Indoor Distance Estimation System
251
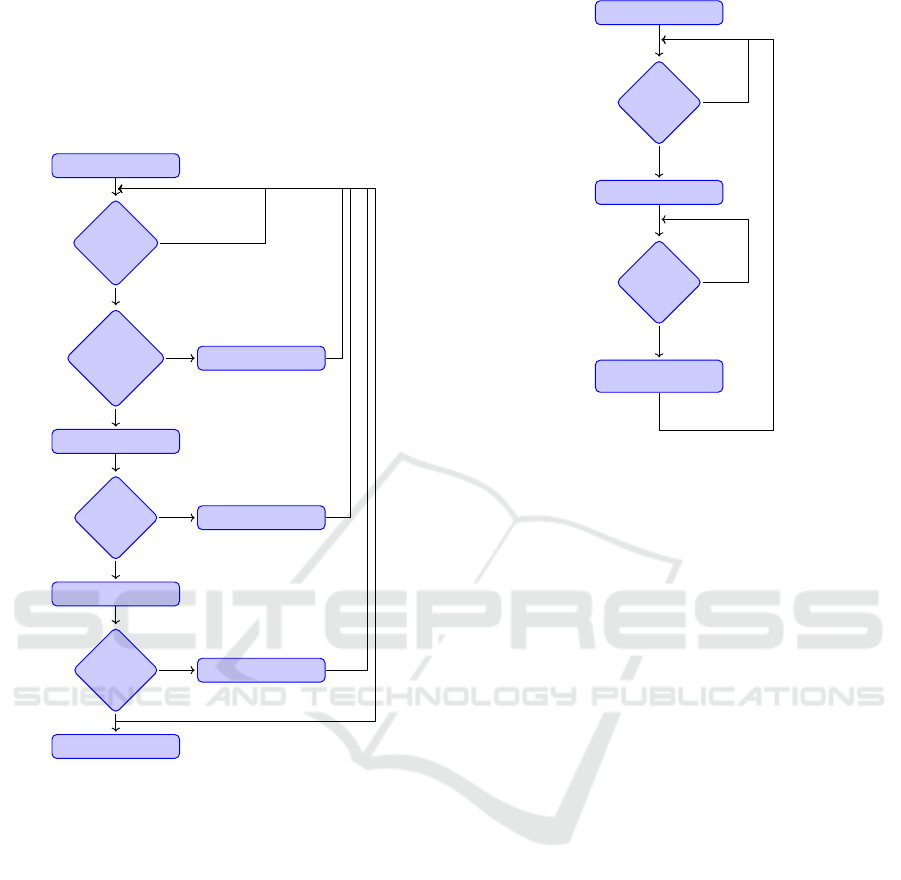
starts with a polling message sent by the tag, and
ends after receiving the range report from the anchor.
The tag is responsible for sending timestamps in the
range message. After each range measurement, the
tag switches to the sleep mode and wakes up again
before initiating the measurement sequence.
Initialization
TimerDelay
elapsed
Counter for
Blink
reached
Transmit Blink
Transmit Poll
PollAck
Received
Wait
Transmit Range
RangeReport
Received
Wait
Display Range
yes
no
yes
no
no
yes
no
yes
Figure 5: Ranging algorithm for the tag node.
As depicted in Fig. 6, the anchor node starts in the
receiving mode, waiting for a Poll message from the
tag. On receiving this message, it acknowledges by
transmitting a PollAck message and waits for a range
message. The range message includes all the times-
tamps calculated on the tag side and, along with the
timestamps measured at the anchor, a Time-of-Flight
(ToF) is computed. This ToF is converted into the dis-
tance, and thus transmitted back to the tag as a range
report message.
4 EXPERIMENTAL RESULTS
The designed indoor localization system is evaluated
in terms od power consumption and accuracy.
Init
Poll
Received
Transmit PollAck
Range
Received
Compute Range,
Transmit RangeReport
yes
no
no
yes
Figure 6: Ranging algorithm for the anchor node.
4.1 Power Consumption
The main aim of using a panStamp as a microcon-
troller for DWM1000 is its low-power consumption
along with its wireless capabilities. The Rx and Tx
current for panStamp is 18 mA and 36 mA respec-
tively, which is far less than the DWM1000 current
consumption (140 mA and 160 mA). Thus, messages
that do not play a part in the range calculation can be
transmitted using the radio module in panstamp in-
stead of DWM1000. Messages that can be replaced
are Blink, RangingInit, RangeReport.
Since receiving a message consumes a lot of
power, we turn on the receiver exactly at the time a
message is expected. Thus, scheduling of the mes-
sages is very important. Also, when in sleep mode,
the microcontrollers of tag and anchors need to com-
municate with each others to wake up the DWM1000
at the right time. In the case of panStamp, this
is carried out using the radio module available on
panStamp. The maximum current consumption as per
the datasheets of DWM1000 and panStamp is given
in Table 2. Based on the timestamps generated from
Panstamp using the serial monitor, the total current
consumption of the system can be estimated accord-
ingly as the maximum current consumption is known.
For this, consider a measurement cycle between a Tag
and Anchor. As the radio signals travel at the speed
of light, the signal transmission time in the air is very
low and would not differ much for the operating range
of 50 meters. Various events are recorded using the
serial monitor of the Panstamp and a summary of time
and current required for each event in tag and anchor
EWSN-IoT 2022 - Special Session on Energy-Aware Wireless Sensor Networks for IoT
252
can be seen in Fig. 3, Fig. 8 and Tables 3 and 4.
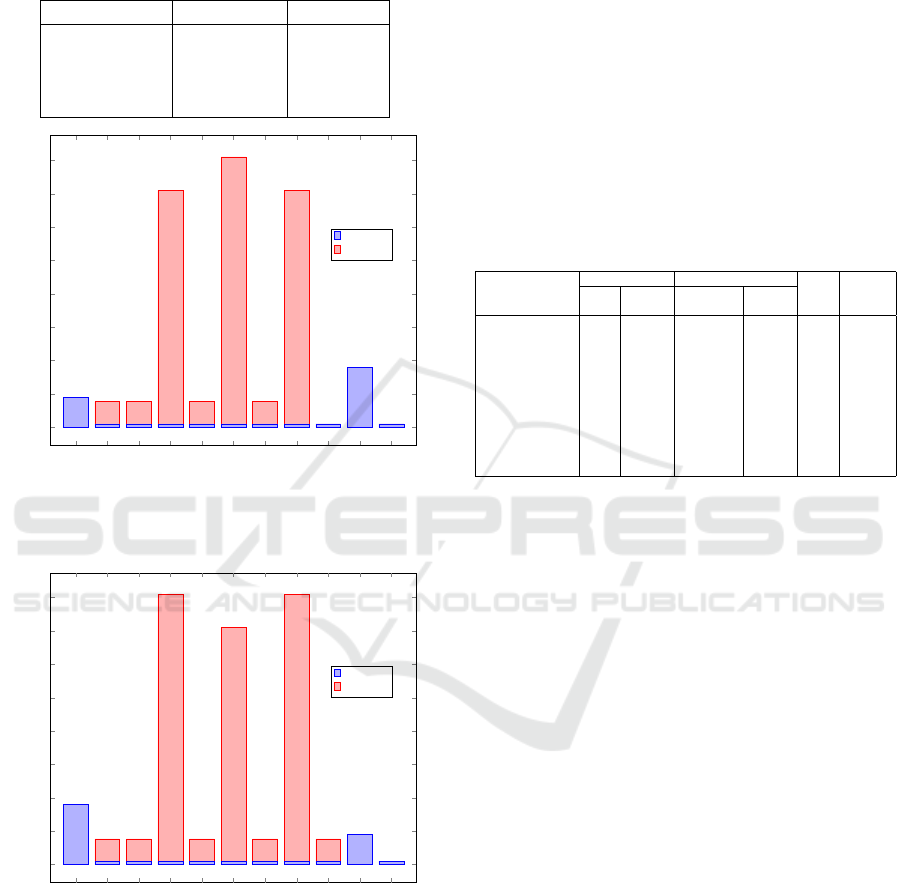
Table 2: Maximum current consumption for DWM1000 and
panStamp.
Device Mode DWM1000 Panstamp
Tx 140 mA 18 mA
Rx 160 mA 36 mA
Deepsleep 200 nA 2 uA
Idle 13.4 mA 2 mA
Wakeup Tx
DW1000 Wakeup
DW1000 Init
Tx Poll
Rx wait
Rx PollAck
Tx wait
Tx Range
Rx wait2
Rx Report
Idle
0
20
40
60
80
100
120
140
160
4 ms
3 ms 46 ms
1 ms
5 ms
1 ms
7 ms
1 ms 12 ms 1 ms
919ms
18
15.4 15.4
142
15.4
162
15.4
142
2
36
2
18
2 2 2 2 2 2 2 2
36
2
Event
Current (mA)
Panstamp
DWM1000
Figure 7: Interfacing DWM1000 with Panstamp NRG 2.0.
Wakeup Rx
DW1000 Wakeup
DW1000 Init
Rx Poll
Tx wait
Tx PollAck
Rx wait
Rx Range
Compute Range
Tx Report
Idle
0
20
40
60
80
100
120
140
160
8 ms 3 ms 46 ms
1 ms
6 ms
1 ms
6 ms
1 ms
8 ms 6 ms
914ms
36
15.4 15.4
162
15.4
142
15.4
162
15.4
18
2
36
2 2 2 2 2 2 2 2
18
2
Event
Current (mA)
Panstamp
DWM1000
Figure 8: Estimated current consumption in anchor for one
cycle.
Each cycle includes a range measurement between
a Tag and Anchor using DWM1000 and panStamp.
Initially, both DWM1000 modules are in deep sleep
mode and the panStamp node of the tag is in Idle
mode, while the panStamp node of the anchor is in re-
ceiving mode. Therefore, the total current consump-
tion is 2 mA for the tag, and 36 mA for the anchor
node. To initiate a measurement, the tag sends a
wake-up signal to the anchor via the radio module of
panStamp. This message includes 2 bytes signal with
the address of the anchor node and message ID for
wake-up command. Immediately, after the transmis-
sion from the tag, the radio module of panStamp is
turned off and an SPI signal from panStamp wakes up
the DWM1000. This takes approximately 3 ms. As
the DWM1000 is in deep sleep mode, it needs to be
reconfigured. The initialization of the module takes
around 46 ms. The DWM1000 starts in idle mode
and consumes around 13.4 mA current.
Table 3: Estimated current consumption of the tag for one
cycle.
Event
panStamp DWM1000 Time
(ms)
Total
Current
(mA)
State
Current
(mA)
State
Current
(mA)
Wakeup Tx Tx 18 Deepsleep 0.0002 4 18.0002
DW1000 wakeup Idle 2 Idle 13.4 3 15.4
DW1000 init Idle 2 Idle 13.4 46 15.4
Tx Poll Idle 2 Tx 140 1 142
Rx wait Idle 2 Idle 13.4 5 15.4
Rx PollAck Idle 2 Rx 160 1 162
Tx wait Idle 2 Idle 13.4 7 15.4
Tx range Idle 2 Tx 140 1 142
PS Rx wait Idle 2 Deepsleep 0.0002 12 2.0002
Rx RangeReport Rx 36 Deepsleep 0.0002 1 36.0002
Idle Idle 2 Deepsleep 0.0002 919 2.0002
On receiving the wake-up command from the ra-
dio module of panStamp, the anchor node wakes up
the DWM1000 module via the SPI communication.
The receiver of the panStamp radio is also turned off
to save power. After completing the initialization of
the DWM1000, the receiver is turned on, and the tag
transmits the first message from DWM1000, the Poll
message. Thus, the anchor receives this message at
the same time. The time difference between turning
on the receiver and actual reception is calculated at
the anchor side, which is approximately 1 ms. There-
fore, the 160 mA consumption of the DWM1000 in
the receiving state only occurred for 1 ms. The trans-
mission of 128 symbol preamble and 20 bytes of data
requires only 0.2 ms when operating at 6.8 Mbps data
rate. This means that the transmitter of the DWM1000
would be operating only for 0.2 ms consuming 140
mA current. All the transmissions in the DWM1000
are carried out at this rate, but for calculating the cur-
rent consumption, we assume the transmission time
as 1 ms for all the messages.
The DWM1000 is a half-duplex transceiver that
can either transmit or receive a message at a single
time. By default, the module switches to its idle state
after transmitting or receiving a message. After re-
ceiving the Poll message, the anchor saves the times-
tamp in the panStamp memory, and starts transmitting
the PollAck message. This time is termed as Tx wait,
where the DWM1000 is in idle state and ready for
Design of an Energy-efficient Hybrid UWB-RF Indoor Distance Estimation System
253
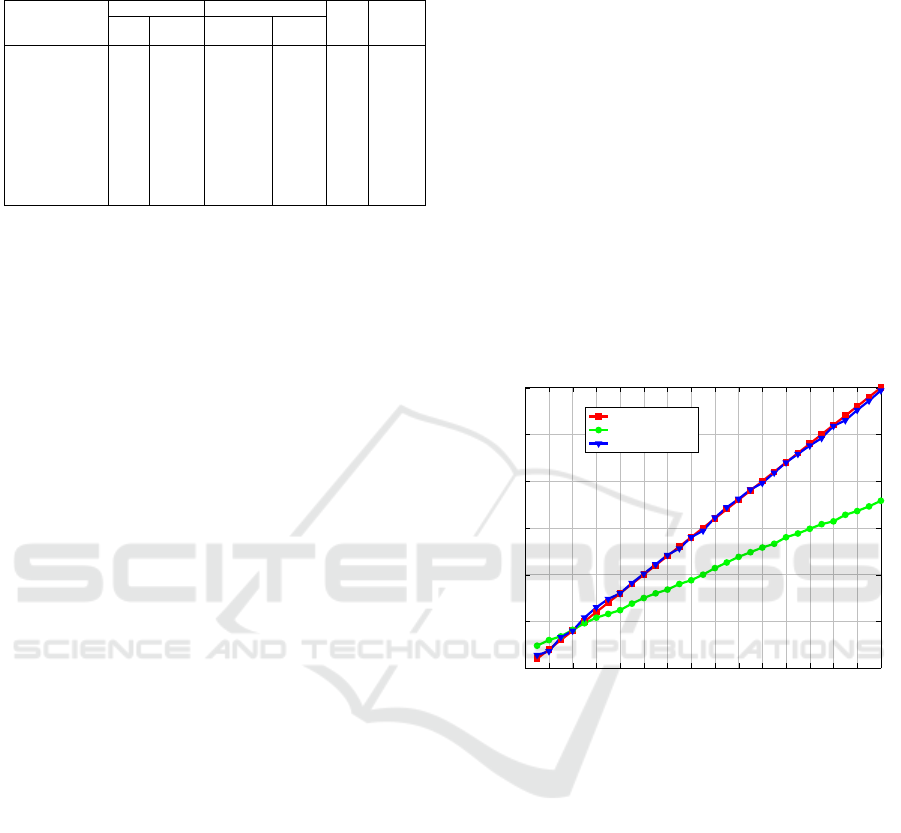
Table 4: Estimated current consumption of the anchor for
one cycle.
Event
Panstamp DWM1000 Time
(ms)
Total
Current
(mA)
State
Current
(mA)
State
Current
(mA)
Wakeup on Rx Rx 36 Deepsleep 0.0002 8 36.0002
DW1000 wakeup Idle 2 Idle 13.4 3 15.4
DW1000 init Idle 2 Idle 13.4 46 15.4
Rx Poll Idle 2 Rx 160 1 162
Tx wait Idle 2 Idle 13.4 6 15.4
Tx PollAck Idle 2 Tx 140 1 142
Rx wait Idle 2 Idle 13.4 6 15.4
Rx range Idle 2 Rx 160 1 162
Compute range Idle 2 Idle 13.4 8 15.4
Tx RangeReport Tx 18 Deepsleep 0.0002 6 18.0002
Idle Idle 2 Deepsleep 0.0002 914 2.0002
its next transmission. The tag also saves the times-
tamp it sent the Poll message and is now waiting for
its next reception. Since the PollAck is not sent im-
mediately, the tag stays in idle state to save power,
which is termed as Rx wait. After waiting for a few
seconds, the tag switches to receiving mode to receive
the PollAck message. Higher Rx wait time refers to
a lower reception time for the tag resulting on power
saving. The Rx wait time is gradually increased in
the tag until the message reception is possible. Once
stable receptions are available, the time is fixed as Rx
wait time.
Upon receiving the PollAck, the tag records this
timestamp. This timestamps has to be transmitted to
the anchor. During the Tx wait, the tag gathers all the
available timestamps and prepares the ranging mes-
sage. This took around 7 ms for the tag. Once the
message is ready, the tag transmits this range message
and sets the DWM1000 to deep sleep. The Rx wait
time for this message was also optimized on the an-
chor side, where the DWM1000 was idle for 6 ms. On
receiving the range message, the anchor has to calcu-
late the exact range between the tag and anchor based
on the timestamps available and those received from
the range message. This calculation took around 8 ms
after which the DWWM1000 is switched from idle
state to deep sleep mode. Since the range is already
calculated, both the DWM1000 are not required to be
active and are sent to deep sleep. At this point, only
the anchor knows the range between the two points,
and has to transmit this information to the tag. The
transmission of the RangeReport happens over the
panStamp radio module. To receive this message, the
panStamp receiver at the tag has to be turned on as
well. The Rx wait time is calculated and upon re-
ceiving the RangeReport message, the Panstamp Ra-
dio module is turned off. At this point, both the tag
and anchor have calculated the range, and enter the
idle state, waiting for the next measurement cycle.
The next measurement cycle starts with the wake-
up signal from the tag, but to receive this message
the panStamp radio has to be in the receiving mode.
Therefore, depending upon the update rate required,
the receiver at the anchor is automatically turned on
after a fixed delay time. The panStamp can also be
used in Wake-on-Radio (WOR) mode to continuously
check for the reception after certain time intervals.
By combining the total estimated current con-
sumption with the time required for each state, an
average current consumption can be calculated. For
ranging a new measurement every second, the aver-
age current consumption estimated is 3.35 mA for tag
and 3.75 mA for anchor. This is a considerable reduc-
tion in the power consumption for DWM1000 mod-
ules along with the microcontroller. Reducing the up-
date rate would further reduce power consumption.
4.2 Distance Measurements
Fig. 9 shows the distance measurement using
DWM1000 interfaced with a panStamp module.
0 20 40
60
80 100 120 140
160
180 200 220 240
260
280 300
0
50
100
150
200
250
300
Distance (cm)
Distance (cm)
Actual distance
Measured distance
Filtred distance
Figure 9: Measured distance using DWM1000 with
Panstamp.
It can be seen that the raw measured distance is
far away from the actual distance, but follows a lin-
ear pattern. This can be corrected by adjusting the
antenna delay value provided in the timestamp cal-
culation. The antenna itself has a fixed transmission
delay. To compensate for this delay in DWM1000, an
integer value is set during the initialization. Since the
plot is linear for the raw measured data, a linear filter
is applied during the calculation of the distance to get
more accurate readings. Using least squares fitting,
the following polynomial is obtained for the curve:
Filter dist = 0.53375 ×Measur dist +20.469 (3)
The raw measurements are then linearised using this
filter. It can be seen from Fig. 9 that an accuracy of
10 cm can be achieved in indoor environment using a
DWM1000 with panStamp.
EWSN-IoT 2022 - Special Session on Energy-Aware Wireless Sensor Networks for IoT
254

5 CONCLUSION
An Ultra-wideband localization system is designed
using Decawave’s DWM1000 and panStamp wire-
less node. The panStamp enables a second channel
for the communication within the nodes, thus keep-
ing the UWB messages to the minimum. Two fre-
quency bands are utilized by the system, 6.5 GHz
for DWM1000 and 868 MHz for the panStamp radio.
The Panstamp operates at very low current, which re-
duces the overall current consumption of the system.
It is estimated that the system consumes a total of 3.35
mA current for tag and 3.75 mA current for anchor
during operation at 1 Hz update frequency. Even with
the low power microcontroller, a good performance
of the system is achieved. Tests performed indoors
within a distance of 3 meters show an accuracy of 10
cm.
REFERENCES
(2021). DW1000 Datasheet. decaWave.
Alarifi, A., Al-Salman, A., Alsaleh, M., Alnafessah, A.,
Al-Hadhrami, S., Al-Ammar, M. A., and Al-Khalifa,
H. S. (2016). Ultra wideband indoor positioning tech-
nologies: Analysis and recent advances. Sensors,
16(5):707.
Amutha, J., Sharma, S., and Nagar, J. (2020). Wsn strate-
gies based on sensors, deployment, sensing models,
coverage and energy efficiency: Review, approaches
and open issues. Wireless Personal Communications,
111(2):1089–1115.
Arbula, D. and Ljubic, S. (2020). Indoor localization based
on infrared angle of arrival sensor network. Sensors,
20(21):6278.
Aykac¸, M., Erc¸elebi, E., and Aldin, N. B. (2017). Zigbee-
based indoor localization system with the personal dy-
namic positioning method and modified particle fil-
ter estimation. Analog Integrated Circuits and Signal
Processing, 92(2):263–279.
Cheng, Q. (2021). A robust indoor localization algo-
rithm for wsn in los and nlos environment. In
2021 IEEE 11th International Conference on Elec-
tronics Information and Emergency Communication
(ICEIEC) 2021 IEEE 11th International Conference
on Electronics Information and Emergency Commu-
nication (ICEIEC), pages 91–94. IEEE.
El Houssaini, D., Khriji, S., Besbes, K., and Kanoun, O.
(2018a). Wireless sensor networks in agricultural ap-
plications. In Energy Harvesting for Wireless Sensor
Networks, pages 323–342. De Gruyter Oldenbourg.
El Houssaini, D., Mohamed, Z., Khriji, S., Besbes, K.,
and Kanoun, O. (2018b). A filtered rssi model based
on hardware characteristic for localization algorithm
in wireless sensor networks. In 2018 32nd Interna-
tional Conference on Advanced Information Network-
ing and Applications Workshops (WAINA), pages 118–
123. IEEE.
H
¨
oflinger, F., Bordoy, J., Zhang, R., Bannoura, A., Si-
mon, N., Reindl, L. M., and Schindelhauer, C. (2018).
Localization system based on ultra low-power radio
landmarks. In SENSORNETS, pages 51–59.
Kanoun, O., Khriji, S., Naifar, S., Bradai, S., Bouattour, G.,
Bouhamed, A., El Houssaini, D., and Viehweger, C.
(2021). Prospects of wireless energy-aware sensors
for smart factories in the industry 4.0 era. Electronics,
10(23):2929.
Kaur, R. and Malhotra, J. (2016). Efficient localization in
wsn based on structured deployment of anchor nodes
in dv-hop. International Journal of Future Generation
Communication and Networking, 9(3):155–166.
Khriji, S., El Houssaini, D., Kammoun, I., and Kanoun, O.
(2018). A fuzzy based energy aware unequal clus-
tering for wireless sensor networks. In International
Conference on Ad-Hoc Networks and Wireless, pages
126–131. Springer.
Obeidat, H., Shuaieb, W., Obeidat, O., and Abd-Alhameed,
R. (2021). A review of indoor localization techniques
and wireless technologies. Wireless Personal Commu-
nications, pages 1–39.
Salem, J. B., Khriji, S., Baklouti, M., Kammoun, I., and
Kanoun, O. (2019). Testbed implementation of a
fuzzy based energy efficient clustering algorithm for
wireless sensor networks. In 2019 16th Interna-
tional Multi-Conference on Systems, Signals & De-
vices (SSD), pages 351–356. IEEE.
Wu, Y., Tang, F., and Li, H. (2018). Image-based camera
localization: an overview. Visual Computing for In-
dustry, Biomedicine, and Art, 1(1):1–13.
Xu, H., Ding, Y., Li, P., Wang, R., and Li, Y. (2017). An rfid
indoor positioning algorithm based on bayesian prob-
ability and k-nearest neighbor. Sensors, 17(8):1806.
Zhou, Z., Chen, T., and Xu, L. (2015). An improved
dead reckoning algorithm for indoor positioning based
on inertial sensors. In International Conference of
Electrical, Automation and Mechanical Engineering
(EAME 2015), pages 369–371.
Design of an Energy-efficient Hybrid UWB-RF Indoor Distance Estimation System
255
